Forum on trading, automated trading systems and testing trading strategies
Indicators: Price Action Indicator
newdigital, 2014.06.13 15:52
Indicators VS Forex Price Action (based on article)
There is an endless debate within the forex trading community whether investors are better suited to use price action mechanisms or technical indicators when developing their portfolio strategies. The reality is that both sets of strategies have advantages and disadvantages, but the benefits gained from them are based heavily on the timeframe. Let us take a look at some important factors to keep in mind when determining which strategy to use.
What is price action?
The
most basic definition of price action is a strategy that involves an
investor taking all forex trading decisions based solely on the movement
of a currency’s price. A price action strategy does not take into
account any technical indicators that may be typically used to determine
whether a currency is supporting or resisting a particular trend.
Regardless of the various complicated strategies that investors around
the world may use, their actions are all accounted for in the final
price chart. The need to predict the impact of external global events on
the market is eliminated because the price chart will inevitably come
to reflect the impact on its own.
The entire focus in price
action trading is the current movements taking place on a price chart.
There are a number of tools that price action traders use, with one
notable example being that of candlesticks. Candlesticks are tools that
are used to determine whether a currency is truly on an upward or
downward trend. The only information taken into account is that which is
provided on a currency’s price chart.
What are technical indicators?
Forex
trading using technical indicators goes above and beyond the
information presented on a currency’s price chart. While price action
trading involves using only price data, technical indicators are used to
discover why a particular currency is moving in a certain direction to
predict its future behavior. Nowadays, there are a number of technical
indicators available for use in the market. However, most forex traders
using technical analysis incorporate three main indicators – moving
averages, bolinger bands and average directional indexes.
A
moving average line is one of the most common indicators that helps
forex traders determine whether a currency is exhibiting a bearish or
bullish trend, or if there is no trend at all. Moving averages can also
help investors identify whether a currency is resisting or supporting
price movements. Moving averages are usually created by determining a
particular period of time, and calculating the average price within that
period.
Bolinger bands are bands that are typically located
around a moving average and a currency price. They help investors
determine whether a currency is trending, while also suggesting points
at which this trend may begin reversing. They help in identifying
support or resistance patterns, and in calculating the volatility of a
currency.
Average directional indexes are used in tandem with
Bolinger bands and moving averages. An ADX essentially calculates the
strength of a trend through measurement of gradient. From these calculations, an investor will be able to determine whether a trend is
strong or weak.
Which one works?
Financial
theorists who develop technical indicators and publish them within the
market do so by studying market behavior in the past. As such, they are
using previous data and creating measurements that fall in line with
this data. When these measurements hold, they can be used by investors
to predict the price movement of a currency.
Price action
traders, however, live in the present. They react to how a currency is
doing presently, and trends that are easily visible on a price chart.
When price action traders look at a price chart, they do not need to
understand the interplay between demand and supply, but only the final
outcome as reflected in a price movement.
The two types of
strategies both have their own uses. Technical indicators are shown to
have an extremely low probability of success when the timeframe is
short. The opposite holds for price action trading. However, as the
timeframe of analysis increases, the probability of technical indicators
working begins to rise. Investors who are looking for long-term trading
strategies may be best placed to use technical indicators over price
action. Conversely, investors who prefer to make quick trades within the
short term are better suited to a price action trading strategy.
Forum on trading, automated trading systems and testing trading strategies
Something Interesting in Financial Video March 2014
newdigital, 2014.03.17 09:55
What is Price Action?
"A common beginner question to trading is what exactly is Price Action? Well, good question, let me sum it up for you."
Forum on trading, automated trading systems and testing trading strategies
Something Interesting to Read February 2014
newdigital, 2014.02.04 15:21
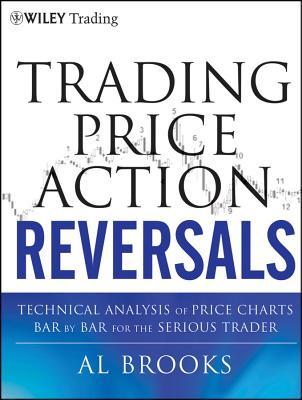
Trading Price Action Reversals : Al Brooks

detailed guide to profiting from trend reversals using the technical analysis of price action
The key to being a successful trader is finding a system that works and
sticking with it. Author Al Brooks has done just that. By simplifying
his trading system and trading only 5-minute price charts he's found a
way to capture profits regardless of market direction or economic
climate. His first book, Reading Price Charts Bar by Bar, offered an
informative examination of his system, but it didn't allow him to get
into the real nuts and bolts of the approach. Now, with this new series
of books, Brooks takes you step by step through the entire process.
By breaking down his trading system into its simplest pieces:
institutional piggybacking or trend trading, trading ranges, and
transitions or reversals (the focus of this book), this three book
series offers access to Brooks' successful methodology. Trading Price
Action Reversals reveals the various types of reversals found in today's
markets and then takes the time to discuss the specific characteristics
of these reversals, so that you can use them in your everyday trading
endeavors. While price action analysis works on all time frames, there
are different techniques that you can use in trading intraday, daily,
weekly and monthly charts. This, among many other issues, is also
addressed throughout these pages.
- Offers insights on how to handle volatility and sharp reversals
- Covers the concept of using options when trading certain charts
-
Examines how to deal with the emotions that come along with trading
Other books in the series include Trading Price Action Trends and Trading Price Action Trading Ranges
If you're looking to make the most of your time in today's markets the
trading insights found in Trading Price Action Reversals will help you
achieve this goal.
================
Forum on trading, automated trading systems and testing trading strategies
Something Interesting to Read February 2014
newdigital, 2014.02.10 16:20
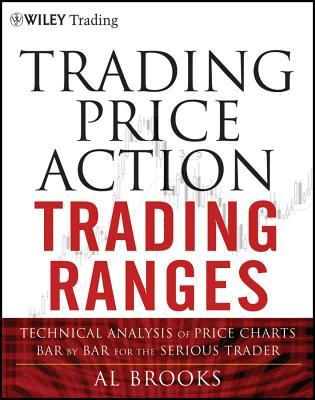
Trading Price Action Trading Ranges : Al Brooks

Divided into five comprehensive parts, Trading Price Action Trading
Ranges skillfully addresses how to spot and profit from trading
ranges—which most markets are in, most of the time—using the technical
analysis of price action. Along the way, it touches on some of the most
essential aspects of this approach, including:
- Trading breakouts, which are transitions from trading ranges to trends, and understanding the gaps they create
- The two types of "Magnets," Support and Resistance, and what they mean once the market breaks out and begins its move
- Pullbacks, which are transitions from trends to trading ranges
- The characteristics commonly found in trading ranges—areas of largely sideways price activity—and examples of how to trade them
-
Honing your order and trade management skills so that you can make more informed entry and exit decisions
And much more
Throughout the book, Brooks focuses primarily on 5 minute candle
charts—all of which are created with TradeStation—to illustrate basic
principles, but also discusses daily and weekly charts. And since he
trades more than just E-mini S&P 500 futures, Brooks also details
how price action can be used as the basis for trading stocks, forex,
Treasury Note futures, and options. For your convenience, a companion
website, which can be found atwiley.com/go/tradingtrends, contains all
of the charts provided in the book.
=============
Check the other book from this series : Trading Price Action Reversals : Al Brooks
Good article -
Reversing: The holy grail or a dangerous delusion?

Forum on trading, automated trading systems and testing trading strategies
Sergey Golubev, 2019.08.24 08:47
Using Price Action As Your First Indicator (based on the article)


- Price action is the study or analysis of price movement in the market. Traders use price action to form opinions and base decisions on trends, key price levels and suitable risk management. Trend identification is frequently utilized as the initial step in price action trading. All other facets to price action indicators require a trend basis to begin price action analysis.
- Technical analysis setups generally begin with price action as the initial form of evaluation. The first thing to remember when using an indicator is that it is a function of price action. The indicator itself is not the ultimate tool when it comes to trading, but rather comes in behind price action. Price action governs the information that the indicator will ultimately provide on the chart. As such, a trader must determine what price action is doing (i.e. the trend) before consulting the indicator for an entry signal. Once the trend is determined, the trader can then consult the indicator for an entry signal in the direction of the trend.Traders trade on the price movement of an instrument therefore, the focus is on the change in price as opposed to the change in indicator value. Some traders base trading decisions and analysis purely on price action whilst other prefer a combination of price action and technical indicators which serve as a support system.
- Technical indicators are derivatives of price action - price action governs the information that indicators provide on the chart. These indicators are calculated using varying periodic price data which provide substantiation for entry, exit, and stop distance criteria. Trend identification is also important in market analysis to ascertain how the market is functioning on a holistic scale (time frame dependent).
- Price action is a broad technical analysis technique that incorporates various trading strategies which traders apply to analyze the markets. Technical indicators work well in conjunction with price action to allow traders to formulate more accurate trade decisions.
============
And the article -
Forum on trading, automated trading systems and testing trading strategies
Resistance and Support Verification
Sergey Golubev, 2018.03.06 07:01
The Articles
----------------
- Automatic construction of support and resistance lines
- Identifying Trade Setups by Support, Resistance and Price Action
- A Method of Drawing the Support/Resistance Levels
- An example of an indicator drawing Support and Resistance lines
- Displaying of Support/Resistance Levels
- Drawing Resistance and Support Levels Using MQL5
- Indicator for Constructing a Three Line Break Chart
XXXUSD 10 points - expert for MetaTrader 5

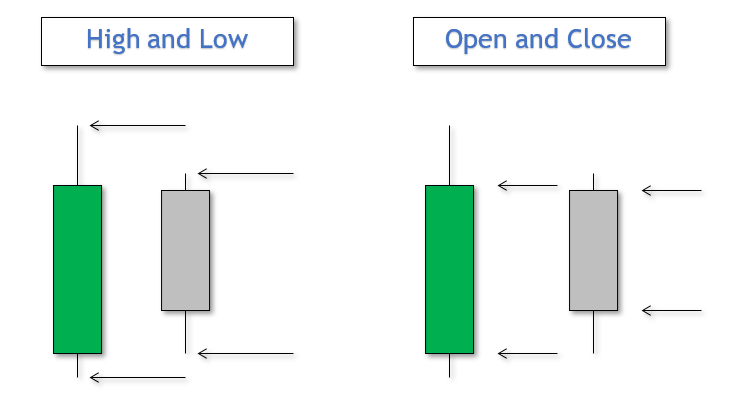
The adviser expects a breakdown of yesterday's price by 10 points. There can only be one 'market entry' transaction on the bar (this is an internal parameter, it is not put out to the input parameters and this is not related to the ' Only one positions ' parameter). When working in the 'inside signals ' mode (' Search signals, in seconds ' is greater than or equal to '10'), the current bar is bar # 0, when operating in the 'only at the time of birth of a new bar' (' Search signals, in seconds ' less than '10') current bar - bar # 1.
I entered the following settings in the settings of the adviser:
- type of yesterday's price - type of yesterday's price, maybe ' High and Low ' and ' Open and Close '
- type of yesterday's bar - type of yesterday's bar, maybe ' Bullish ', ' Bearish ' or ' Disable '
- breaking through - breaking

Up to the present, we have not had any mathematically rigorous price movement theory. Instead, we have had to deal with experience-based assumptions stating that the price moves in a certain way after a certain pattern. Of course, these assumptions have been supported neither by statistics, nor by theory. The article provides the concepts and foundations of the mathematical apparatus of the rigorous theory price movement theory.

- www.mql5.com
- Free trading apps
- Over 8,000 signals for copying
- Economic news for exploring financial markets
You agree to website policy and terms of use
Dear friends/Brothers/Sisters,
I want to start this post regarding Price Action. I want people to help about what I know. Please Respond this post, Share the way you know and learn the way I know. I am not a master but a trader like others and also like to know how others doing. Reply and Keep in touch with this post. :)