
Indicator for Constructing a Three Line Break Chart
Introduction
Previous articles considered Point and Figure, Kagi and Renko charts. Continuing the series of articles about charts of the 20th century, this time we are going to speak about the Three Line Break chart or, to be precise, about its implementation through a program code. There is very little information about the origin of this chart. I suppose it started in Japan. In the USA they learned about it from "Beyond Candlesticks" by Steve Nison published in 1994.
As well as in the charts mentioned above, the time range is not taken into account when constructing the Three Line Break chart. It is based on newly formed closing prices of a certain timeframe, which allows filtering minor fluctuations of a price in relation to the previous movement.
Steve Nison in his book "Beyond Candlesticks" described eleven principles of plotting this chart (p. 185). I have consolidated them into three.
- Principle №1: For construction select an initial price and then, depending on whether the market moves up or down, draw an ascending or descending line. It will mark a new minimum or maximum.
- Principle №2: When a new price falls below the minimum or exceeds the maximum, we can draw a descending or ascending line.
- Principle №3: To draw a line in the direction opposite to the previous movement, the minimum or maximum have to be passed. At the same time, if there is more than one identical line, then the minimum or maximum is calculated based on two (if there are two consecutive identical lines) or three (if there are three or more consecutive identical lines) of them.
Let us take a closer look at the example of a classic chart construction based on historical data (fig. 1).
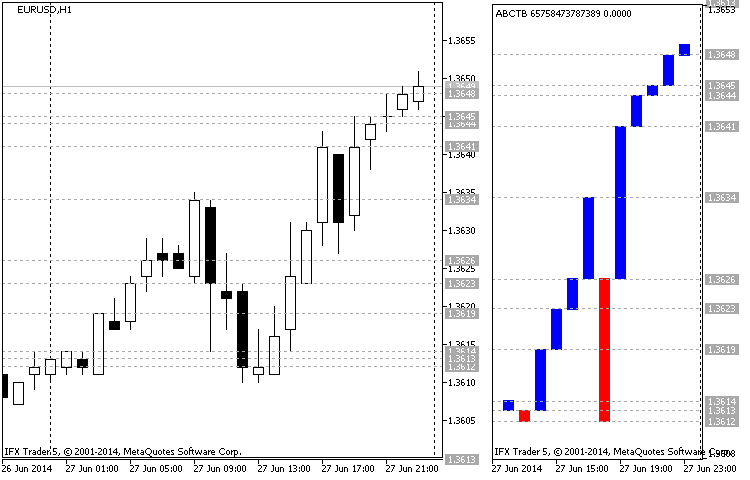
Fig.1 Example of constructing a Three Line Break chart (EURUSD H1 27.06.2014)
Fig. 1 represents a Candlestick chart on the left hand side and a Three Line Break chart on the right hand side. This is a chart of EURUSD, timeframe H1. The start date of the chart is 27.06.2014 at the price 1.3613 (closing time of the candle is 00:00), then the candle (01:00) closes at 1.3614, forming the first ascending line of the Three Line Break chart. The following candle of the bearish direction (02:00) forms an ascending line, closing at 1.3612 (closing price is lower than the previous minimum).
Then bullish candlesticks are moving the price towards the 1.3619 (03:00) mark, forming a new maximum and a line. The candle at 04:00 has not fallen below the minimum and it did not affect the construction. The candle at 05:00 closes at 1.3623, marking a new maximum (new ascending line).
Now to extend the downtrend, we need to pass two minimums (1.3613), but bulls are not going to give up their position and form a new maximum 1.3626 (06:00). Then bulls are trying to reverse the uptrend for two hours, but the same trend continues with a new maximum achieved at 1.3634 (09:00). Bulls are leading. Now to draw an ascending line, three minimums have to be passed (1.3626; 1.3623 and 1.3619).
As we can see, in the following three hours bears are taking over the market, downing it to the point of 1.3612 (12:00). It is reflected in a new ascending line. However, the following five hours show that the bulls are winning their position back and bring the market back to the point of 1.3641, passing the previous maximum in 1.3626 and forming a new ascending line at 17:00. Bears fail to pass the previous minimum at 18:00 and for the following five hours bulls are bringing the market up to the point of 1.3649, forming a new ascending line every hour.
Basics of chart construction
Before we get to the code, we are going to speak about the indicator itself and figure out what makes it different from others and how. It is obvious that the Three Line Break, like other indicators, was designed for facilitation of efficient market analysis and search of new strategies. I am sure you want to know if there are any novelties. Actually there are a few of them. The indicator allows changing price type for calculation. It covers all four standard bar prices. The classic type is designed for constructing charts only for one price type when the modernized one caters for using all four price types (open, high, low и close). It modifies the look of the classic chart construction by adding "shadows" to the lines and making them look like Japanese candlesticks, which adds to the visual perception of the chart.
The modernized version also features settings for synchronizing price data on time with substituting missing prices for the priority ones.
Modernized type of chart construction is presented at fig. 2:
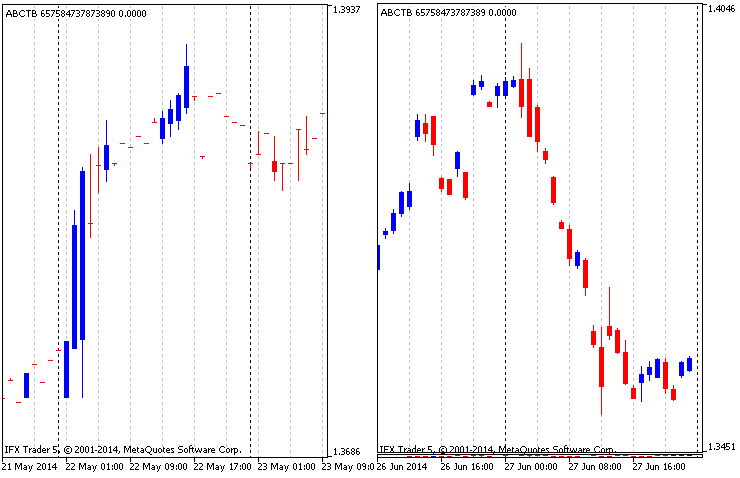
Fig.2 Modified chart based on four price types
As the modernized construction combines four Three Line Break charts of different price types, it is natural to find discrepancies between prices. To avoid it, data synchronization on time is required. Price synchronization was carried out in two variations: complete (fig. 2 on the right) and partial (fig. 2 on the left). Complete synchronization represents a filtered partial one, where all data are drawn on the chart and missing data are substituted by the priority prices specified in the settings. In the mode of complete synchronization missing data simply get omitted and only candlesticks with a complete set of data are drawn.
Another innovation is a period separator, introduced for the convenience of splitting signals. As you well know, period separator can be enabled in the chart settings. In the indicator they change depending on the timeframe, specified in the settings. Unlike the charts in MetaTrader 5, where periods are separated by a vertical dashed line, in this indicator a new period is represented by changing a line color (candles, fig. 3):
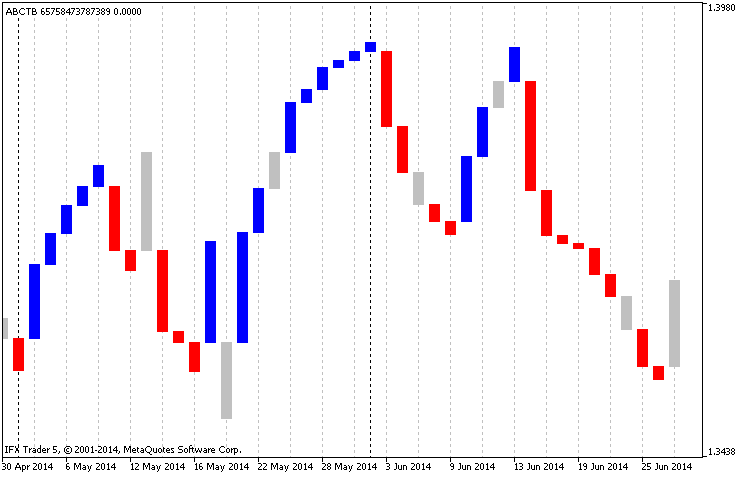
Fig.3 Period separators in the indicator
Another addition is the implementation of a technical indicator iMA, which is built based on the prices from the main chart, but is synchronized with the indicator data on time. Thus data is filtered by the moving average (fig. 4):
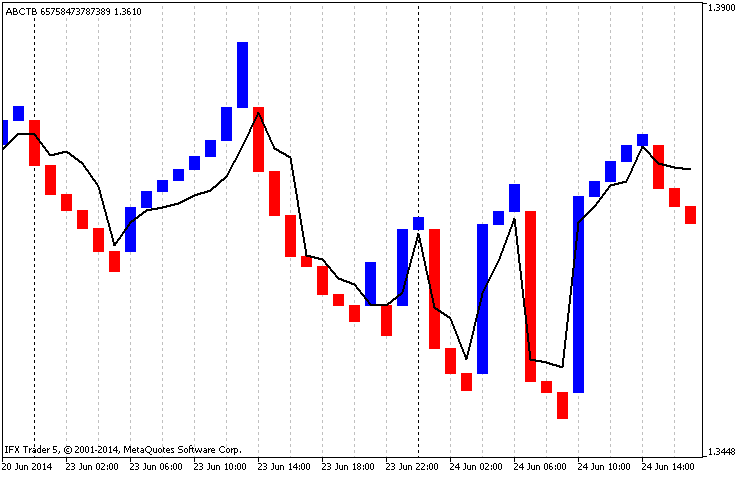
Fig.4 Internal moving average
The indicator also has a feature to set up a minimum movement in points for drawing a line and the number of lines required for a reversal. It also has a role of a filter.
Code of the indicator
The algorithm of the indicator is rather simple and has three stages: copying data, calculation based on the copied data and filling buffers of the indicator (constructing a chart based on the received data). The code is split into functions which are interconnected either between themselves or with the input data. Let us have a close look at the code.
1. Input parameters of the indicator
The preamble of the indicator contains a declaration of graphic constructions. There are two of them in the indicator: chart "ABCTB" (DRAW_COLOR_CANDLES) and additional moving average "LINE_TLB" (DRAW_LINE). Accordingly, there are six buffers. Then follows the data of enum type for improving the interface settings and the settings themselves:
- magic_numb - Magic number has the type long. It is a unique number to denote the indicator. If the necessity arises, can be converted into type string with a few amendments;
- time_frame - Calculation time range, type ENUM_TIMEFRAMES, is the main parameter (the timeframe of the indicator);
- time_redraw - Period of chart updates, type ENUM_TIMEFRAMES. It is the timeframe during which a chart recalculation takes place. For a speedy redrawing of the chart press the key "R" on the keyboard - an integrated control of the indicator;
- first_date_start - Start date, type datetime. It is the main parameter which is the starting point for copying data and charting;
- chart_price - Price type for calculation (0-Close, 1-Open, 2-High, 3-Low). For a classic chart construction one price type has to be selected. As already mentioned, this parameter is ignored when modified construction is enabled;
- step_min_f - Minimum step for a new column (>0, type int) or a jump required for drawing a line;
- line_to_back_f - Number of lines to display a reversal (>0, type int). Classic type suggests three lines to show a reversal;
- chart_type - Type of chart construction (0-classic, 1-modified), type select. It is a switch between construction types;
- chart_color_period - Changing color when starting a new period (boolean type). Used for changing line color at the beginning of a new period;
- chart_synchronization - Constructing a chart only upon complete synchronization (boolean type, if true, then a complete synchronization occurs with dropping all missing values before constructing a chart);
- chart_priority_close - Priority of the closing price (type select, has four variations. It points at the priority of the closing price at partial synchronization and gets ignored at the complete one;
- chart_priority_open - Priority of the opening price. The same applies here;
- chart_priority_high - Priority of the maximum price. The same applies here;
- chart_priority_low - Priority of the minimum price. The same applies here;
- ma_draw - Draw the average (boolean type, if true, then draw moving average);
- ma_price - Price type for constructing the average, can be one of ENUM_APPLIED_PRICE;
- ma_method - Construction type, can be one of ENUM_MA_METHOD;
- ma_period - Averaging period of the moving average;
Then we declare buffer arrays, variables and structures required for calculation.
//+------------------------------------------------------------------+
//|                                                        ABCTB.mq5 |
//|                                 "Azotskiy Aktiniy ICQ:695710750" |
//|                        "" |
//+------------------------------------------------------------------+
// ABCTB - Auto Build Chart Three Line Break
#property copyright "Azotskiy Aktiniy ICQ:695710750"
#property link      ""
#property version   "1.00"
#property indicator_separate_window
#property indicator_buffers 6
#property indicator_plots   2
//--- plot ABCTB
#property indicator_label1  "ABCTB"
#property indicator_type1   DRAW_COLOR_CANDLES
#property indicator_color1  clrBlue,clrRed,clrGreenYellow
#property indicator_style1  STYLE_SOLID
#property indicator_width1  1
//--- plot LINE_TLB
#property indicator_label2  "LINE_TLB"
#property indicator_type2   DRAW_LINE
#property indicator_color2  clrRed
#property indicator_style2  STYLE_SOLID
#property indicator_width2  1
//--- Price type for calculation
enum type_price
  {
   close=0, // Close
   open=1,  // Open
   high=2,  // Hight
   low=3,   // Low
  };
//--- type of chart construction
enum type_build
  {
   classic=0,  // Classic
   modified=1, // Modified
  };
//--- priority
enum priority
  {
   highest_t=4, // Highest
   high_t=3,    // High
   medium_t=2,  // Medium
   low_t=1,     // Low
  };
//--- input parameters
input long               magic_numb=65758473787389;                // Magic number
input ENUM_TIMEFRAMES    time_frame=PERIOD_CURRENT;                // Calculation time range
input ENUM_TIMEFRAMES    time_redraw=PERIOD_M1;                    // Period of chart updates
input datetime           first_date_start=D'2013.03.13 00:00:00';  // Start date
input type_price         chart_price=close;                        // Price type for calculation (0-Close, 1-Open, 2-High, 3-Low)
input int                step_min_f=4;                             // Minimum step for a new column (>0)
input int                line_to_back_f=3;                         // Number of lines to display a reversal(>0)
input type_build         chart_type=classic;                       // Type of chart construction (0-classic, 1-modified)
input bool               chart_color_period=true;                  // Changing color for a new period
input bool               chart_synchronization=true;               // Constructing a chart only upon complete synchronization
input priority           chart_priority_close=highest_t;           // Priority of the closing price
input priority           chart_priority_open=highest_t;            // Priority of the opening price
input priority           chart_priority_high=highest_t;            // Priority of the maximum price
input priority           chart_priority_low=highest_t;             // Priority of the minimum price
input bool               ma_draw=true;                             // Draw the average
input ENUM_APPLIED_PRICE ma_price=PRICE_CLOSE;                     // Price type for constructing the average
input ENUM_MA_METHOD     ma_method=MODE_EMA;                       // Construction type
input int                ma_period=14;                             // Averaging period
//--- indicator buffers
//--- buffer of the chart
double         ABCTBBuffer1[];
double         ABCTBBuffer2[];
double         ABCTBBuffer3[];
double         ABCTBBuffer4[];
double         ABCTBColors[];
//--- buffer of the average
double         LINE_TLBBuffer[];
//--- variables
MqlRates rates_array[];// bar data array for analysis
datetime date_stop;    // current date
datetime date_start;   // start date variable for calculation
//+------------------------------------------------------------------+
//| Struct Line Price                                                |
//+------------------------------------------------------------------+
struct line_price// structure for storing information about the past lines
  {
   double            up;  // value of the high price
   double            down;// value of the low price
  };
//+------------------------------------------------------------------+
//| Struct Line Information                                          |
//+------------------------------------------------------------------+
struct line_info// structure for storing information about the shared lines
  {
   double            up;
   double            down;
   char              type;
   datetime          time;
  };
line_info line_main_open[];  // data on the opening prices chart
line_info line_main_high[];  // data on the maximum prices chart
line_info line_main_low[];   // data on the minimum prices chart
line_info line_main_close[]; // data on the closing prices chart
//+------------------------------------------------------------------+
//| Struct Buffer Info                                               |
//+------------------------------------------------------------------+
struct buffer_info// structure for storing data for filling a buffer
  {
   double            open;
   double            high;
   double            low;
   double            close;
   char              type;
   datetime          time;
  };
buffer_info data_for_buffer[];// data for filling the modified construction buffer
datetime array_datetime[];    // array for storing information of the time for every line
int time_array[3];            // array for the function func_date_color
datetime time_variable;       // variable for the function func_date_color
bool latch=false;             // variable-latch for the function func_date_color
int handle;                   // handle of the indicator iMA
int step_min;                 // variable of the minimum step
int line_to_back;             // variable of the number of lines to display a reversal
2. Function OnInit
All indicator buffers are declared in the function OnInit and array indication is set up like in a timeseries.
Then we set values of the indicator that are not going to be reflected on the chart, set the name, specify accuracy and remove current values as they overload the chart. Here we also set the handle of the indicator iMA and check correctness of the entered data. In case of an error, an appropriate message is printed and the value is changed for the minimum.
//+------------------------------------------------------------------+
//| Custom indicator initialization function                         |
//+------------------------------------------------------------------+
int OnInit()
  {
//--- indicator buffers mapping
//--- buffers for a chart
   SetIndexBuffer(0,ABCTBBuffer1,INDICATOR_DATA);
   ArraySetAsSeries(ABCTBBuffer1,true);
   SetIndexBuffer(1,ABCTBBuffer2,INDICATOR_DATA);
   ArraySetAsSeries(ABCTBBuffer2,true);
   SetIndexBuffer(2,ABCTBBuffer3,INDICATOR_DATA);
   ArraySetAsSeries(ABCTBBuffer3,true);
   SetIndexBuffer(3,ABCTBBuffer4,INDICATOR_DATA);
   ArraySetAsSeries(ABCTBBuffer4,true);
   SetIndexBuffer(4,ABCTBColors,INDICATOR_COLOR_INDEX);
   ArraySetAsSeries(ABCTBColors,true);
//--- buffer for constructing the average
   SetIndexBuffer(5,LINE_TLBBuffer,INDICATOR_DATA);
   ArraySetAsSeries(LINE_TLBBuffer,true);
//--- set the values that are not going to be reflected on the chart
   PlotIndexSetDouble(0,PLOT_EMPTY_VALUE,0); // for the chart
   PlotIndexSetDouble(1,PLOT_EMPTY_VALUE,0); // for the average
//--- set the indicator appearance
   IndicatorSetString(INDICATOR_SHORTNAME,"ABCTB "+IntegerToString(magic_numb)); // name of the indicator
//--- accuracy of display
   IndicatorSetInteger(INDICATOR_DIGITS,_Digits);
//--- prohibit displaying the results of the indicator current value
   PlotIndexSetInteger(0,PLOT_SHOW_DATA,false);
   PlotIndexSetInteger(1,PLOT_SHOW_DATA,false);
//---
   handle=iMA(_Symbol,time_frame,ma_period,0,ma_method,ma_price);
   if(step_min_f<1)
     {
      step_min=1;
      Alert("Minimum step for a new column must be greater than zero");
     }
   else step_min=step_min_f;
//---
   if(line_to_back_f<1)
     {
      line_to_back=1;
      Alert("The number of lines to display a reversal must be greater than zero");
     }
   else line_to_back=line_to_back_f;
//---
   return(INIT_SUCCEEDED);
  }
3. Function of copying data
As the indicator is designed to work with all four types of prices, it is essential to copy all data, including time. In MQL5 there is a structure named MqlRates. It is used for storing information about the time of the beginning of a trading session, prices, volumes and the spread.
The input parameters of the function are the start and the end date, timeframe and the target array of the MqlRates type. The function returns true if copying is successful. Data is copied into an intermediate array. Calculated missing data plus one session are copied there and data is permanently being renewed. If copying to the intermediate array was successful, then data is copied into the array, passed to ensure correct work of the function.
//+------------------------------------------------------------------+
//| Func All Copy                                                    |
//+------------------------------------------------------------------+
bool func_all_copy(MqlRates &result_array[],// response array
                   ENUM_TIMEFRAMES period,  // timeframe
                   datetime data_start,     // start date
                   datetime data_stop)      // end date
  {
//--- declaration of auxiliary variables
   bool x=false;       // variable for the function response
   int result_copy=-1; // copied data count
//--- adding variables and arrays for calculation
   static MqlRates interim_array[]; // temporary dynamic array for storing copied data
   static int bars_to_copy;         // number of bars for copying
   static int bars_copied;          // number of copied bars since the start date
//--- find out the current number of bars in the time range
   bars_to_copy=Bars(_Symbol,period,data_start,data_stop);
//--- count the number of bars to be copied
   bars_to_copy-=bars_copied;
//--- if it is not the first time when data is being copied
   if(bars_copied>0)
     {
      bars_copied--;
      bars_to_copy++;
     }
//--- change the size of the receiving array
   ArrayResize(interim_array,bars_to_copy);
//--- copy data to a temporary array
   result_copy=CopyRates(_Symbol,period,0,bars_to_copy,interim_array);
//--- check the result of copying data
   if(result_copy!=-1) // if copying to the temporary array was successful
     {
      ArrayCopy(result_array,interim_array,bars_copied,0,WHOLE_ARRAY); // copy the data from the temporary array to the main one
      x=true;                   // assign the positive response to the function
      bars_copied+=result_copy; // increase the value of the copied data
     }
//---
   return(x);
  }
4. Function of calculating data
This function is a prototype of data calculation for a classic construction of the Three Line Break chart. As already mentioned, the function only calculates data and forms it into a special array of the structure type line_info, declared in the beginning of the code.
This function contains two other functions: func_regrouping (regrouping function) and func_insert (inserting function). We are going to have a look at them for a start:
4.1. Regrouping function
This function is regrouping information about consecutive lines of the same direction. It is limited by the size of the array passed into it or, to be precise, by the parameter line_to_back_f (number of lines to display a reversal) from the indicator settings. So every time when control is passed over to the function, all received data about identical lines move one point down towards the end and index 0 is filled by a new value.
This is how information about lines required for a break is stored (in case of classic construction the break has three lines).
//+------------------------------------------------------------------+
// Func Regrouping                                                   |
//+------------------------------------------------------------------+
void func_regrouping(line_price &input_array[],// array for regrouping
                     double new_price,         // new price value
                     char type)                // type of movement
  {
   int x=ArraySize(input_array);// find out the size of the array for regrouping
   for(x--; x>0; x--)           // regrouping loop
     {
      input_array[x].up=input_array[x-1].up;
      input_array[x].down=input_array[x-1].down;
     }
   if(type==1)
     {
      input_array[0].up=new_price;
      input_array[0].down=input_array[1].up;
     }
   if(type==-1)
     {
      input_array[0].down=new_price;
      input_array[0].up=input_array[1].down;
     }
  }
4.2. Inserting function
The function carries out insertion of the values to the response array. The code is simple and does not require detailed explanation.
//+------------------------------------------------------------------+
// Func Insert                                                       |
//+------------------------------------------------------------------+
void func_insert(line_info &line_m[],  // target array
                 line_price &line_i[], // source array
                 int index,            // array element being inserted
                 char type,            // type of the target column
                 datetime time)        // date
  {
   line_m[index].up=line_i[0].up;
   line_m[index].down=line_i[0].down;
   line_m[index].type=type;
   line_m[index].time=time;
  }
The function for calculating data was conventionally divided into three parts. The first part copies data under analysis to an intermediate array with the help of the operator switch. Only concerned price is copied. The second part does a test run to calculate required space in the data array. Then the data array line_main_array[], initially passed to the function for response, undergoes a change. The third part, in its turn, fills the adjusted data array.
//+------------------------------------------------------------------+
//| Func Build Three Line Break                                      |
//+------------------------------------------------------------------+
void func_build_three_line_break(MqlRates &input_array[],      // array for analysis
                                 char price_type,              // type of the price under analysis (0-Close, 1-Open, 2-High, 3-Low)
                                 int min_step,                 // minimum step for drawing a line
                                 int line_back,                // number of lines for a reversal
                                 line_info &line_main_array[]) // array for return (response) of the function
  {
//--- calculate the size of the array for analysis
   int array_size=ArraySize(input_array);
//--- extract data required for calculation to an intermediate array
   double interim_array[];// intermediate array
   ArrayResize(interim_array,array_size);// adjust the intermediate array to the size of the data
   switch(price_type)
     {
      case 0: // Close
        {
         for(int x=0; x<array_size; x++)
           {
            interim_array[x]=input_array[x].close;
           }
        }
      break;
      case 1: // Open
        {
         for(int x=0; x<array_size; x++)
           {
            interim_array[x]=input_array[x].open;
           }
        }
      break;
      case 2: // High
        {
         for(int x=0; x<array_size; x++)
           {
            interim_array[x]=input_array[x].high;
           }
        }
      break;
      case 3: // Low
        {
         for(int x=0; x<array_size; x++)
           {
            interim_array[x]=input_array[x].low;
           }
        }
      break;
     }
//--- enter the variables for storing information about current situation
   line_price passed_line[];// array for storing information about the latest prices of the lines (type structure line_price)
   ArrayResize(passed_line,line_back+1);
   int line_calc=0;// number of lines
   int line_up=0;// number of the last ascending lines
   int line_down=0;// number of the last descending lines
   double limit_up=0;// upper limit necessary to pass
   double limit_down=0;// lower limit necessary to pass
/* Fill variables informing of the current situation with the first values */
   passed_line[0].up=interim_array[0];
   passed_line[0].down=interim_array[0];
//--- start the first loop to calculate received data for filling a buffer for drawing
   for(int x=0; x<array_size; x++)
     {
      if(line_calc==0)// no lines have been drawn
        {
         limit_up=passed_line[0].up;
         limit_down=passed_line[0].down;
         if(interim_array[x]>=limit_up+min_step*_Point)// the upper limit has been passed
           {
            func_regrouping(passed_line,interim_array[x],1);// regroup
            line_calc++;// update the line counter
            line_up++;
           }
         if(interim_array[x]<=limit_down-min_step*_Point)// the lower limit has been passed
           {
            func_regrouping(passed_line,interim_array[x],-1);// regroup
            line_calc++;// update the line counter
            line_down++;
           }
        }
      if(line_up>line_down)// last ascending line (lines)
        {
         limit_up=passed_line[0].up;
         limit_down=passed_line[(int)MathMin(line_up,line_back-1)].down;
         if(interim_array[x]>=limit_up+min_step*_Point)// the upper limit has been passed
           {
            func_regrouping(passed_line,interim_array[x],1);// regroup
            line_calc++;// update the line counter
            line_up++;
           }
         if(interim_array[x]<limit_down)// the lower limit has been passed
           {
            func_regrouping(passed_line,interim_array[x],-1);// regroup
            line_calc++;// update the line counter
            line_up=0;
            line_down++;
           }
        }
      if(line_down>line_up)// last descending line (lines)
        {
         limit_up=passed_line[(int)MathMin(line_down,line_back-1)].up;
         limit_down=passed_line[0].down;
         if(interim_array[x]>limit_up)// the upper limit has been passed
           {
            func_regrouping(passed_line,interim_array[x],1);// regroup
            line_calc++;// update the line counter
            line_down=0;
            line_up++;
           }
         if(interim_array[x]<=limit_down-min_step*_Point)// the lower limit has been passed
           {
            func_regrouping(passed_line,interim_array[x],-1);// regroup
            line_calc++;// update the line counter
            line_down++;
           }
        }
     }
   ArrayResize(line_main_array,line_calc);// change the size of the target array
//--- zeroise variables and fill with the the initial data
   line_calc=0;
   line_up=0;
   line_down=0;
   passed_line[0].up=interim_array[0];
   passed_line[0].down=interim_array[0];
//--- start the second loop to fill a buffer for drawing
   for(int x=0; x<array_size; x++)
     {
      if(line_calc==0)// no lines have been drawn
        {
         limit_up=passed_line[0].up;
         limit_down=passed_line[0].down;
         if(interim_array[x]>=limit_up+min_step*_Point)// the upper limit has been passed
           {
            func_regrouping(passed_line,interim_array[x],1);// regroup
            func_insert(line_main_array,passed_line,line_calc,1,input_array[x].time);
            line_calc++;// update the line counter
            line_up++;
           }
         if(interim_array[x]<=limit_down-min_step*_Point)// the lower limit has been passed
           {
            func_regrouping(passed_line,interim_array[x],-1);// regroup
            func_insert(line_main_array,passed_line,line_calc,-1,input_array[x].time);
            line_calc++;// update the line counter
            line_down++;
           }
        }
      if(line_up>line_down)// last ascending line (lines)
        {
         limit_up=passed_line[0].up;
         limit_down=passed_line[(int)MathMin(line_up,line_back-1)].down;
         if(interim_array[x]>=limit_up+min_step*_Point)// the upper limit has been passed
           {
            func_regrouping(passed_line,interim_array[x],1);// regroup
            func_insert(line_main_array,passed_line,line_calc,1,input_array[x].time);
            line_calc++;// update the line counter
            line_up++;
           }
         if(interim_array[x]<limit_down)// the lower limit has been passed
           {
            func_regrouping(passed_line,interim_array[x],-1);// regroup
            func_insert(line_main_array,passed_line,line_calc,-1,input_array[x].time);
            line_calc++;// update the line counter
            line_up=0;
            line_down++;
           }
        }
      if(line_down>line_up)// last descending line (lines)
        {
         limit_up=passed_line[(int)MathMin(line_down,line_back-1)].up;
         limit_down=passed_line[0].down;
         if(interim_array[x]>limit_up)// the upper limit has been passed
           {
            func_regrouping(passed_line,interim_array[x],1);// regroup
            func_insert(line_main_array,passed_line,line_calc,1,input_array[x].time);
            line_calc++;// update the line counter
            line_down=0;
            line_up++;
           }
         if(interim_array[x]<=limit_down-min_step*_Point)// the lower limit has been passed
           {
            func_regrouping(passed_line,interim_array[x],-1);// regroup
            func_insert(line_main_array,passed_line,line_calc,-1,input_array[x].time);
            line_calc++;// update the line counter
            line_down++;
           }
        }
     }
  }
5. Function of chart construction
The purpose of this function is to calculate the data for a chart based on the selected construction parameter (classic or modified) and to fill the indicator buffer with data for display. As well as the previous function, the function of chart construction has three additional functions. They are the function of color, function of synchronization and the function of moving average. Let us discuss them in more detail.
5.1. Color function
This function has only one input parameter - time. The response of the function is a boolean variable. If the passed data is the border of the period, then the function will return true. As periods depend on the selected timeframe, the function has a built-in period separation by the conditional operator if. After the period has been selected, it undergoes a check if a new period has started yet. It is done through converting a date into structure MqlDateTime and comparison. For the timeframe up to and including H2, changes in the value of date indicate the start of a new period. Timeframes from H12 to D1 inclusive indicate changes in months and between W1 and MN we check the change in the year.
Unfortunately, the structure MqlDateTime does not have information about the current week. This issue was solved by creating an initial point represented by the variable time_variable. Further along the line, a number of seconds in a week gets deducted from this date.
//+------------------------------------------------------------------+
// Func Date Color                                                   |
//+------------------------------------------------------------------+
bool func_date_color(datetime date_time) // input date
  {
   bool x=false;// response variable
   int seconds=PeriodSeconds(time_frame);// find out the calculation time range
   MqlDateTime date;
   TimeToStruct(date_time,date);// convert data
   if(latch==false) // check the state of the latch
     {
      MqlDateTime date_0;
      date_0=date;
      date_0.hour=0;
      date_0.min=0;
      date_0.sec=0;
      int difference=date_0.day_of_week-1;
      datetime date_d=StructToTime(date_0);
      date_d=date_d-86400*difference;
      time_variable=date_d;
      latch=true;// lock the latch
     }
   if(seconds<=7200)// period is less than or equal to H2
     {
      if(time_array[0]!=date.day)
        {
         x=true;
         time_array[0]=date.day;
        }
     }
   if(seconds>7200 && seconds<=43200)// period is greater than H2 but less than or equal to H12
     {
      if(time_variable>=date_time)
        {
         x=true;
         time_variable=time_variable-604800;
        }
     }
   if(seconds>43200 && seconds<=86400)// period is greater than H12 but less than or equal to D1
     {
      if(time_array[1]!=date.mon)
        {
         x=true;
         time_array[1]=date.mon;
        }
     }
   if(seconds>86400)// period W1 or MN
     {
      if(time_array[2]!=date.year)
        {
         x=true;
         time_array[2]=date.year;
        }
     }
   return(x);
  }
5.2. Function of synchronization
The function of synchronization has six input parameters: four of them are the priority of the prices, boolean parameter of complete or partial synchronization and the array under analysis itself. The function is divided into two parts: a case of complete and partial synchronization.
Complete synchronization is carried out in three stages:
- Calculation of the array elements, satisfying the condition of containing data on all four price types.
- Copying elements into an intermediate array under the same condition.
- Copying from the intermediate array to the one passed by parameters.
Partial synchronization is more complex.
Passed one-dimensional structure array is getting converted into two-dimensional one, where the first index denotes the order and the second one - the price type. Then introduced is a one-dimensional array with four elements. Price priority levels are copied into this array and then the array is sorted to identify the priority order. After that we carry out distribution according to priorities using the loop for and the conditional operator if. At the same time, if priorities are equal, then price sequence is as follows: close, open, high, low. As soon as the operator if finds the first prioritized value, then the loop for substitutes all zero data in the previously created two-dimensional array for the priority ones etc.
//+------------------------------------------------------------------+
// Func Synchronization                                              |
//+------------------------------------------------------------------+
void func_synchronization(buffer_info &info[],
                          bool synchronization,
                          char close,
                          char open,
                          char high,
                          char low)
  {
   if(synchronization==true)// carry out a complete synchronization
     {
      int calc=0;// count variable
      for(int x=0; x<ArraySize(info); x++)// count complete data
        {
         if(info[x].close!=0 && info[x].high!=0 && info[x].low!=0 && info[x].open!=0)calc++;
        }
      buffer_info i_info[];    // enter a temporary array for copying
      ArrayResize(i_info,calc);// change the size of the temporary array
      calc=0;
      for(int x=0; x<ArraySize(info); x++)// copy data into the temporary array
        {
         if(info[x].close!=0 && info[x].high!=0 && info[x].low!=0 && info[x].open!=0)
           {
            i_info[calc]=info[x];
            calc++;
           }
        }
      ZeroMemory(info);        // clear the target array
      ArrayResize(info,calc);  // change the size of the main array
      for(int x=0; x<calc; x++)// copy data from the temporary array to the main one
        {
         info[x]=i_info[x];
        }
     }
   if(synchronization==false)  // change zero values to priority ones
     {
      int size=ArraySize(info); // measure the size of the array
      double buffer[][4];       // create a temporary array for calculation
      ArrayResize(buffer,size); // change the size of the temporary array
      for(int x=0; x<size; x++) // copy data into the temporary array
        {
         buffer[x][0]=info[x].close;
         buffer[x][1]=info[x].open;
         buffer[x][2]=info[x].high;
         buffer[x][3]=info[x].low;
        }
      char p[4];// enter an array for sorting by the order
      p[0]=close; p[1]=open; p[2]=high; p[3]=low;// assign variables for further sorting
      ArraySort(p); // sort
      int z=0,v=0;  // initialize frequently used variables
      for(int x=0; x<4; x++)// taking into account the results of the sorting, look through all variables and substitute them according to the priority
        {
         if(p[x]==close)// priority is for the closing prices
           {
            for(z=0; z<size; z++)
              {
               for(v=1; v<4; v++)
                 {
                  if(buffer[z][v]==0)buffer[z][v]=buffer[z][0];
                 }
              }
           }
         if(p[x]==open)// priority is for the opening prices
           {
            for(z=0; z<size; z++)
              {
               for(v=0; v<4; v++)
                 {
                  if(v!=1 && buffer[z][v]==0)buffer[z][v]=buffer[z][1];
                 }
              }
           }
         if(p[x]==high)// priority is for the maximum prices
           {
            for(z=0; z<size; z++)
              {
               for(v=0; v<4; v++)
                 {
                  if(v!=2 && buffer[z][v]==0)buffer[z][v]=buffer[z][2];
                 }
              }
           }
         if(p[x]==low)// priority is for the minimum prices
           {
            for(z=0; z<size; z++)
              {
               for(v=0; v<3; v++)
                 {
                  if(buffer[z][v]==0)buffer[z][v]=buffer[z][3];
                 }
              }
           }
        }
      for(int x=0; x<size; x++)// copy data from the temporary array back
        {
         info[x].close=buffer[x][0];
         info[x].open=buffer[x][1];
         info[x].high=buffer[x][2];
         info[x].low=buffer[x][3];
        }
     }
  }
5.3. Function of moving average
It is the simplest function. Using the indicator handle, received in the OnInit function, we copy the value, corresponding to the date passed in the parameters of the function. Then this value is returned as a response to this function.
//+------------------------------------------------------------------+
// Func MA                                                           |
//+------------------------------------------------------------------+
double func_ma(datetime date)
  {
   double x[1];
   CopyBuffer(handle,0,date,1,x);
   return(x[0]);
  }
The function of plotting a chart is conventionally divided into two parts: classic plotting and modified one. The function has two input parameters: price type for construction (ignored during modified construction) and type of construction (classic and modified).
In the very beginning the indicator buffers get cleared and then, depending on the type of construction, divided into two parts. The first part (we are talking about the modified construction) starts with calling the function for calculating all four price types. Then we create a common data array to where we copy the data in use, received when calling the function of data calculation. Then received data array gets sorted and cleared from replicated data. After that the array data_for_buffer[], declared at the global level, is filled based on consecutive dates with the following data synchronization. Filling indicator buffers is the final stage of the modified construction.
The second part (classic construction) is a lot simpler. At first the function of data calculation is called and then the indicator buffers are filled.
//+------------------------------------------------------------------+
//| Func Chart Build                                                 |
//+------------------------------------------------------------------+
void func_chart_build(char price, // price type for chart construction
                      char type)  // type of chart construction
  {
//--- Zeroise the buffers
   ZeroMemory(ABCTBBuffer1);
   ZeroMemory(ABCTBBuffer2);
   ZeroMemory(ABCTBBuffer3);
   ZeroMemory(ABCTBBuffer4);
   ZeroMemory(ABCTBColors);
   ZeroMemory(LINE_TLBBuffer);
   if(type==1)// construct a modified chart (based on all price types)
     {
      func_build_three_line_break(rates_array,0,step_min,line_to_back,line_main_close);// data on closing prices
      func_build_three_line_break(rates_array,1,step_min,line_to_back,line_main_open);// data on opening prices
      func_build_three_line_break(rates_array,2,step_min,line_to_back,line_main_high);// data on maximum prices
      func_build_three_line_break(rates_array,3,step_min,line_to_back,line_main_low);// data on minimum prices
      //--- calculate data arrays
      int line_main_calc[4];
      line_main_calc[0]=ArraySize(line_main_close);
      line_main_calc[1]=ArraySize(line_main_open);
      line_main_calc[2]=ArraySize(line_main_high);
      line_main_calc[3]=ArraySize(line_main_low);
      //--- gather the date array
      int all_elements=line_main_calc[0]+line_main_calc[1]+line_main_calc[2]+line_main_calc[3];// find out the number of all elements
      datetime datetime_array[];// enter the array for copying
      ArrayResize(datetime_array,all_elements);
      int y[4];
      ZeroMemory(y);
      for(int x=0;x<ArraySize(datetime_array);x++)// copy data into the array
        {
         if(x<line_main_calc[0])
           {
            datetime_array[x]=line_main_close[y[0]].time;
            y[0]++;
           }
         if(x<line_main_calc[0]+line_main_calc[1] && x>=line_main_calc[0])
           {
            datetime_array[x]=line_main_open[y[1]].time;
            y[1]++;
           }
         if(x<line_main_calc[0]+line_main_calc[1]+line_main_calc[2] && x>=line_main_calc[0]+line_main_calc[1])
           {
            datetime_array[x]=line_main_high[y[2]].time;
            y[2]++;
           }
         if(x>=line_main_calc[0]+line_main_calc[1]+line_main_calc[2])
           {
            datetime_array[x]=line_main_low[y[3]].time;
            y[3]++;
           }
        }
      ArraySort(datetime_array);// sort the array
      //--- delete replicated data from the array
      int good_info=1;
      for(int x=1;x<ArraySize(datetime_array);x++)// count useful information
        {
         if(datetime_array[x-1]!=datetime_array[x])good_info++;
        }
      ArrayResize(array_datetime,good_info);
      array_datetime[0]=datetime_array[0];// copy the first element as it is the pattern in the beginning of comparison
      good_info=1;
      for(int x=1;x<ArraySize(datetime_array);x++)// fill the new array with useful data
        {
         if(datetime_array[x-1]!=datetime_array[x])
           {
            array_datetime[good_info]=datetime_array[x];
            good_info++;
           }
        }
      //--- fill the buffer for drawing (colored candles)
      int end_of_calc[4];// variables of storing information about the last comparison
      ZeroMemory(end_of_calc);
      ZeroMemory(data_for_buffer);
      ArrayResize(data_for_buffer,ArraySize(array_datetime));// change the size of the declared global array for storing data before passing it to a buffer
      for(int x=0; x<ArraySize(array_datetime); x++)
        {
         data_for_buffer[x].time=array_datetime[x];
         for(int s=end_of_calc[0]; s<line_main_calc[0]; s++)
           {
            if(array_datetime[x]==line_main_close[s].time)
              {
               end_of_calc[0]=s;
               if(line_main_close[s].type==1)data_for_buffer[x].close=line_main_close[s].up;
               else data_for_buffer[x].close=line_main_close[s].down;
               break;
              }
           }
         for(int s=end_of_calc[1]; s<line_main_calc[1]; s++)
           {
            if(array_datetime[x]==line_main_open[s].time)
              {
               end_of_calc[1]=s;
               if(line_main_open[s].type==1)data_for_buffer[x].open=line_main_open[s].down;
               else data_for_buffer[x].open=line_main_open[s].up;
               break;
              }
           }
         for(int s=end_of_calc[2]; s<line_main_calc[2]; s++)
           {
            if(array_datetime[x]==line_main_high[s].time)
              {
               end_of_calc[2]=s;
               data_for_buffer[x].high=line_main_high[s].up;
               break;
              }
           }
         for(int s=end_of_calc[3]; s<line_main_calc[3]; s++)
           {
            if(array_datetime[x]==line_main_low[s].time)
              {
               end_of_calc[3]=s;
               data_for_buffer[x].low=line_main_low[s].down;
               break;
              }
           }
        }
      //--- start the function of synchronizing data
      func_synchronization(data_for_buffer,chart_synchronization,chart_priority_close,chart_priority_open,chart_priority_high,chart_priority_low);
      //--- preparatory actions before starting the function func_date_color
      ZeroMemory(time_array);
      time_variable=0;
      latch=false;
      //--- fill the buffer for drawing candles
      for(int x=ArraySize(data_for_buffer)-1,z=0; x>=0; x--)
        {
         ABCTBBuffer1[z]=data_for_buffer[x].open;
         ABCTBBuffer2[z]=data_for_buffer[x].high;
         ABCTBBuffer3[z]=data_for_buffer[x].low;
         ABCTBBuffer4[z]=data_for_buffer[x].close;
         if(ABCTBBuffer1[z]<=ABCTBBuffer4[z])ABCTBColors[z]=0;
         if(ABCTBBuffer1[z]>=ABCTBBuffer4[z])ABCTBColors[z]=1;
         if(func_date_color(data_for_buffer[x].time)==true && chart_color_period==true)ABCTBColors[z]=2;
         if(ma_draw==true)LINE_TLBBuffer[z]=func_ma(data_for_buffer[x].time);
         z++;
        }
     }
   else// construct a classic chart (based on one price type)
     {
      func_build_three_line_break(rates_array,price,step_min,line_to_back,line_main_close);// find data on selected prices
      ArrayResize(array_datetime,ArraySize(line_main_close));
      //--- preparatory actions before starting the function func_date_color
      ZeroMemory(time_array);
      time_variable=0;
      latch=false;
      //--- the buffer for drawing candles
      for(int x=ArraySize(line_main_close)-1,z=0; x>=0; x--)
        {
         ABCTBBuffer1[z]=line_main_close[x].up;
         ABCTBBuffer2[z]=line_main_close[x].up;
         ABCTBBuffer3[z]=line_main_close[x].down;
         ABCTBBuffer4[z]=line_main_close[x].down;
         if(line_main_close[x].type==1)ABCTBColors[z]=0;
         else ABCTBColors[z]=1;
         if(func_date_color(line_main_close[x].time)==true && chart_color_period==true)ABCTBColors[z]=2;
         if(ma_draw==true)LINE_TLBBuffer[z]=func_ma(line_main_close[x].time);
         z++;
        }
     }
  }
6. Function of consolidation
This function unites all controlling indicator elements. At first the current date is defined, then the function of copying data and the function of chart construction are called.
//+------------------------------------------------------------------+
//| Func Consolidation                                               |
//+------------------------------------------------------------------+
void func_consolidation()
  {
//--- defining the current date
   date_stop=TimeCurrent();
//--- copying data for analysis
   func_all_copy(rates_array,time_frame,first_date_start,date_stop);
//--- basic construction of the chart
   func_chart_build(chart_price,chart_type);
   ChartRedraw();
  }
7. Function of key-controlled and automatically controlled construction
These functions are designed for redrawing the indicator by pressing the "R" key (OnChartEvent) on the keyboard or doing it automatically in accordance with the selected time range (OnCalculate). The latter is analyzed by the new bar function (func_new_bar) which is a simplified version of the function described in IsNewBar.
//+------------------------------------------------------------------+
//| Custom indicator iteration function                              |
//+------------------------------------------------------------------+
int OnCalculate(const int rates_total,
                const int prev_calculated,
                const int begin,
                const double &price[])
  {
//---
   if(func_new_bar(time_redraw)==true)
     {
      func_consolidation();
     };
//--- return value of prev_calculated for next call
   return(rates_total);
  }
//+------------------------------------------------------------------+
//| ChartEvent function                                              |
//+------------------------------------------------------------------+
void OnChartEvent(const int id,
                  const long &lparam,
                  const double &dparam,
                  const string &sparam)
  {
//--- event of a keystroke
   if(id==CHARTEVENT_KEYDOWN)
     {
      if(lparam==82) //--- the key "R" has been pressed
        {
         func_consolidation();
        }
     }
  }
//+------------------------------------------------------------------+
//| Func New Bar                                                     |
//+------------------------------------------------------------------+
bool func_new_bar(ENUM_TIMEFRAMES period_time)
  {
//---
   static datetime old_times; // variable of storing old values
   bool res=false;            // variable of the analysis result
   datetime new_time[1];      // time of a new bar
//---
   int copied=CopyTime(_Symbol,period_time,0,1,new_time); // copy the time of the last bar to the cell new_time
//---
   if(copied>0) // everything is ок. data copied
     {
      if(old_times!=new_time[0]) // if the old time of the bar is not equal to the new one
        {
         if(old_times!=0) res=true; // if it is not the first start, then new bar = true
         old_times=new_time[0];     // remember the time of the bar
        }
     }
//---
   return(res);
  }
At this point we shall finish describing the code of the indicator and speak about the ways to use it.
Examples of using the indicator and a trading strategy
Let us start with the main analysis strategies based on the classic chart construction.
1. White and black lines as signals to buy and sell
Roughly we can speak about two rules:
- Rule №1: Buy, when there are three consecutive ascending lines and sell, when there are three consecutive descending lines. Three consecutive lines indicate an appearing tendency.
- Rule №2: Sell, when the reversal line drops below three consecutive ascending lines, buy, when the reversal line is higher than three consecutive descending lines.
Let us look at fig.6, representing a classic construction for EURUSD H1 from the beginning of 2013 (the analyzed time range is pictured at fig.5).
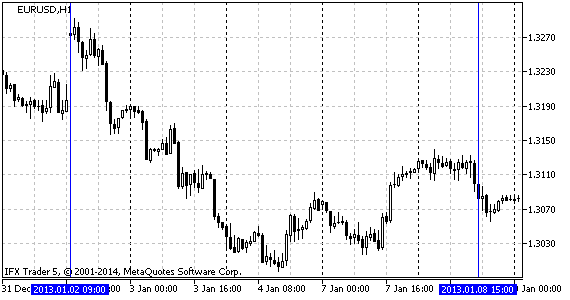
Fig.5 Analyzed time range EURUSD H1
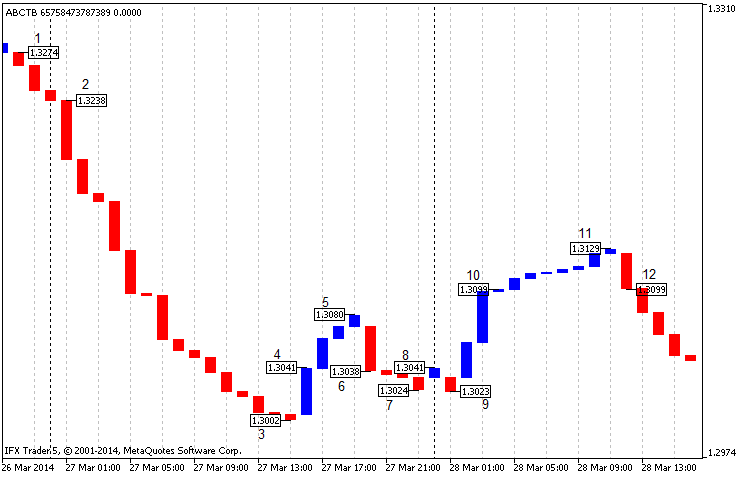
Fig.6 Classic construction of the Three Line Break chart for EURUSD H1, beginning of 2013, closing prices
On the chart (fig. 6) we can clearly see the signal (rule №1) between points 1 and 2, which is a start point for selling. In this case the earning is over 200 points for four decimal digits. The following point 4 indicates a favorable situation for buying (as in rule №2). At closing in point 5 the profit was 40 points and we are at breakeven at closing in point 6.
In point 6 we can see a signal to sell (rule №2). We get 10 points worth profit when closing at point 7 and breakeven at closing in point 8. Points 8 and 9 cannot be considered as signals as they satisfy neither rule №1, no rule №2. We can buy in point 10 (rule №1); we can also get profit of 20 points at closing in point 11 or breakeven in point 12. All numbers were rounded.
In the best case scenario, using this strategy we could generate profit of 270 point, which is impressive. At the same time, in the specified time range there is an intense movement which affects profit. In the worst case scenario, trading can result in breakeven which is not bad either.
It is worth mentioning that when a situation meets either rule №1 or rule №2, we need to wait for a tendency reversal confirmation represented by one line in the same direction as the tendency.
2. Equidistant channel, support and resistant lines
Another trading strategy is applying technical analysis to the Three Line Break chart. Let us take a look at fig. 7:
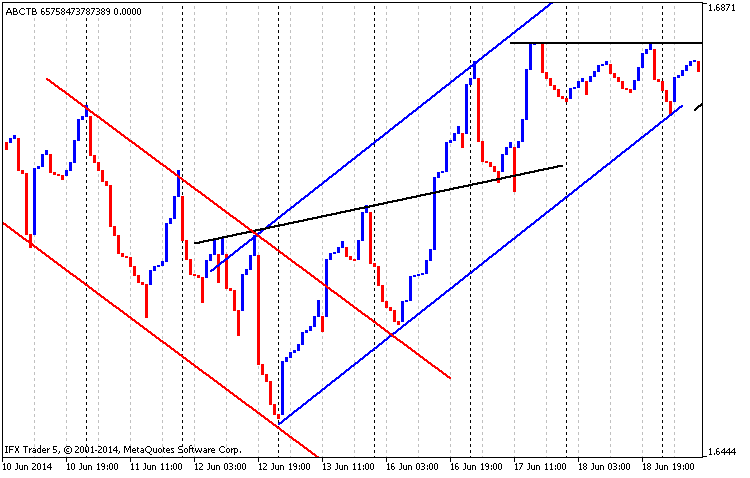
Fig. 7 Equidistant channel, support and resistant lines, GBPUSD H1, time range from 01.03.2014 to 01.05.2014
In Fig. 7 you can see that the descending equidistant channel is drawn in red lines, the ascending channel is drawn in blue ones and lines of support and resistance are drawn black. It is clear that the first resistance line is turning into the support line.
3. Candlestick Patterns
A modified chart (two line break) on the timeframe M30 for the pair USDCAD at the beginning of 2013 looks rather interesting.
We can distinguish Japanese candlestick patterns that justified their signals (fig. 8).

Fig. 8 Modified Three Line Break chart, USDCAD M30, beginning of 2013, two lines break
In the beginning of the chart we can see a reversal pattern of "Engulfing" under №1. It consists of two candles: red and the preceding blue one. After the upward trend line the market goes down to number 2 which is a one-candle reversal pattern "Hammer". At this point the market changes direction. The same happens in pattern №3 ("Spinning Top"). The following reversal pattern "Kharami" (№4) is shown by the candlestick 4 and the large ascending one next to it. Pattern №6 also consists of two candlesticks (pattern "Engulfing") but unlike the first similar model it turns the market in the opposite direction.
Thus, it can be concluded that using the indicator in this kind of analysis is acceptable but it has such disadvantages as seldom occurrence of signals and possibility of a significant drawdown. This strategy certainly needs further development.
4. Moving average
Partial modification like adding a moving average only to drawn lines gives new opportunities for analysis.
Let us look at fig. 9:
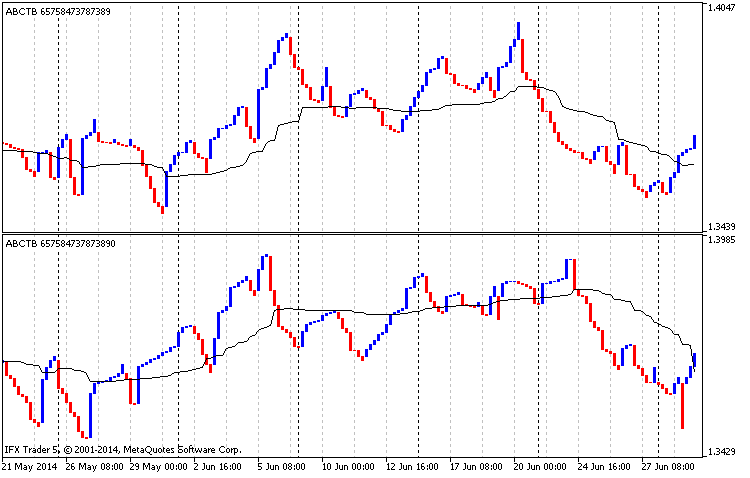
Fig.9 Analysis of moving average, EURUSD H4, the Three Line Break chart, classic construction, from 01.01.2014 to 01.07.2014
The upper part of fig. 9 illustrates a classic construction based on the high prices with a moving average (averaging period is 90, low price, smoothed averaging). The lower part shows a classic construction based on low prices with a moving average (averaging period is 90, high price, smoothed averaging).
So, in the upper part of fig. 9 the moving average can be considered a support line and in the lower part, on the contrary, a resistance line. If the price on both charts falls below the average then there is downward trend on the market and it is better to sell. When the price rises above the average it is time to buy. A disadvantage of this strategy is that it is meant for a long term trading.
Conclusion
In conclusion I can say that the Three Line Break gives consistently good signals or, in the worse case, leads to breakeven. Practice shows that it is best applied in a long term trend and, therefore, I do not recommend using this chart for a short term trading. If anyone has new ideas of how to use it in trading, I would be glad to discuss it.
As usually, I tried to explore the code in detail. Again, if there are ideas of how to extend, rework or optimize it, please write in the comments to the article.
Translated from Russian by MetaQuotes Ltd.
Original article: https://www.mql5.com/ru/articles/902
 Regression Analysis of the Influence of Macroeconomic Data on Currency Prices Fluctuation
 How we developed the MetaTrader Signals service and Social Trading
 How to Prepare a Trading Account for Migration to Virtual Hosting
- Free trading apps
- Over 8,000 signals for copying
- Economic news for exploring financial markets
You agree to website policy and terms of use
Thanks for the author for the great article.
While I was exploring the MQL5 Markets I found a Three Line Break for MT4 and it is Free.
Here is the link:
https://www.mql5.com/en/market/product/3123
Regards
Hi, thank you for your article. Is it possible please for you to convert it in C# language? Many thanks in advance.
Can you refresh your code, does not work with 2085 build?I downloaded from the article, compiled, and everything works ...