
Applying fuzzy logic in trading by means of MQL4

Introduction
The modern-day trading cannot be imagined without automated trading systems usually called Expert Advisors or robots. Most, if not all, of them feature a clear, hard-coded trading strategy and money management system. Their main advantage is a rigid algorithm excluding the human factor. However, this advantage is also their main drawback since trading robots lack flexibility. Regardless of the market conditions, an Expert Advisor always applies the same trading strategy with the same strictly categorized parameters. In other words, the system always acts rigidly: average trend > enter the market with one lot, strong trend > enter the market with two lots. No deviations!
Unlike an automated system, human traders think in fuzzy categories and may have different opinions on similar market entry signals. They are often doubtful and keep asking themselves if the trend is moderate or strong. And even if the trend is significant, is it strong enough to enter in two lots? Such fuzzy categories can be handled by the fuzzy logic. The fuzzy logic does not set rigid boundaries between the categories. Instead, it "blurs" them making a trading system more flexible and combining the rigidness of a trading robot with the flexibility of a human mind. The article provides examples of applying the fuzzy logic system in trading by means of MQL4.
Membership functions
Read the article "An Introduction to Fuzzy Logic" to grasp the general concepts of the fuzzy logic theory. Also, learn the basics of FuzzyNet library for MQL4, since it is used for the implementation of the examples.
Let's describe the membership functions used in the article.
Triangular membership function
As its name suggests, this is a triangle-shaped membership function. This is a simple and most frequently used function defined by the following analytic formula:

It is generally used to specify the following types of uncertainties: "approximately equal", "average value", "located within the range", "similar to the object", "looks like the object", etc. The triangular membership function parameters are usually interpreted as follows:
- [a, c] — variable range;
- b — most probable variable value.
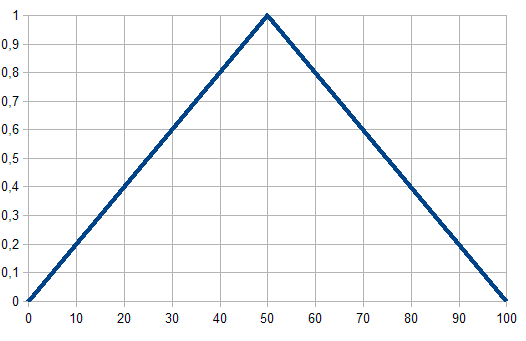
Fig. 1. Triangular membership function
Trapezoidal membership function
The trapezium-shaped membership function defined by the following formula:

The trapezoidal membership function parameters are interpreted as follows:
- [a, d] – fuzzy set carrier, pessimistic assessment of the variable;
- [b, c] – core of a fuzzy set, optimistic assessment of the variable;
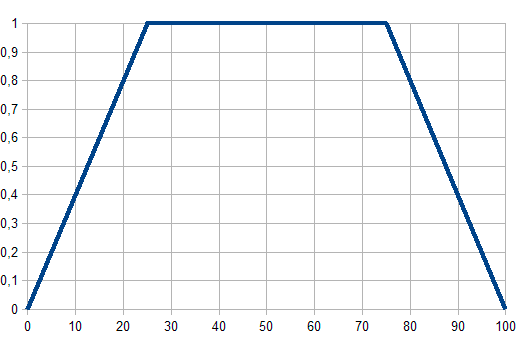
Fig. 2. Trapezoidal membership function
Bell-shaped membership function
The membership function in the form of symmetrical bell-shaped curve defined by the formula:

The parameter values are interpreted as follows:
- a – membership function concentration ratio;
- b – membership function slope ratio;
- c – membership function highest point coordinate.
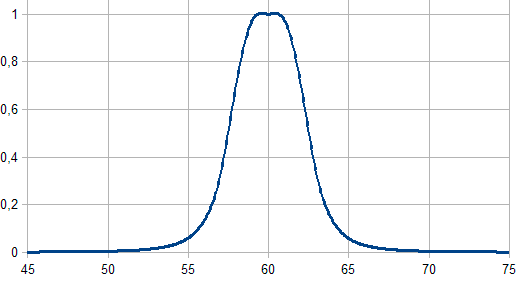
Fig. 3. Bell-shaped membership function
Sigmoid membership function
The function is calculated using the following formula and applied when setting monotonous membership functions:
![]()
Its parameters should be interpreted as follows:
- a – membership function slope ratio;
- с – membership function inflection coordinate.
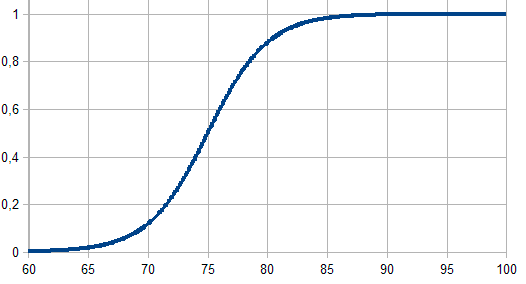
Fig. 4. Sigmoid membership function
Sample implementation of an indicator by means of FuzzyNet library for MQL4
We will use Average Directional Movement Index (ADX) as an example. This is a trending indicator that determines the power of the current trend (thick green line). First, let's define the precise trend power criteria (Fig. 5):- Weak Trend – the main green line lies within the range 30-50. The values within this rigidly defined range are considered to be a weak trend.
- Average Trend – the main green line lies within the range 50-70 (average trend).
- Strong Trend – the main green line lies above 70 up to 100 (strong trend).
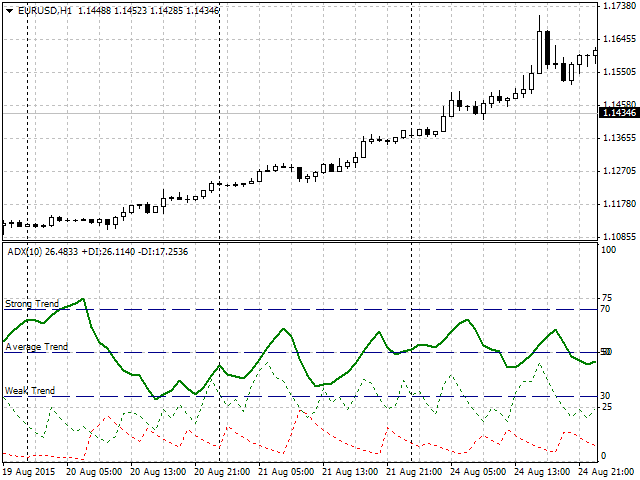
Fig. 5. ADX operation and implemented division by a trend power
These three rigidly defined categories have some drawbacks caused by their clear and strict classification logic:
- The first drawback is the subjective nature of the classification. Indeed, why did we choose 30, 50, and 70 as border values? Why did not we choose 25, 50, and 75, or some others? These various opinions may greatly affect ADX operation and even lead to diametrically opposite trading results.
- The second issue is the border areas of the selected categories. For example, 50 is the border between weak and average trend. If we apply strict logic, we have to admit that 48 and 49 still belong to the weak trend area, while 50 and 51 are in the average trend area already. But what about the transition from 49 to 50? In both cases (48-49 and 49-50), the difference between the values is equal to one. However, for some reason, the latter case is considered to be a transition from one category into another.
So, how can the fuzzy logic solve these issues?
As already mentioned, the fuzzy logic "blurs" (fuzzifies) the specified borders. The border values of rigidly set categories are assigned to both categories at once but with varying degrees of membership. A sample description in that case may look as follows: the current trend may be described as weak (30%), but most probably it can be described as average (70%). A human trader would describe this as follows: the trend is average rather than weak. I believe, this is the main advantage of the fuzzy logic. It is flexible and variable when dealing with rigidly specified parameters. I have selected the following membership functions for our example with ADX indicator:
- The trapezoidal membership function for the weak trend concept description.
- The bell-shaped membership function for the average trend concept description.
- The sigmoid function for the strong trend concept description.
More complex systems containing numerous categories can be described using other functions available in the FuzzyNet library. Currently, the library contains over a dozen of functions. The graphical representation of our example is shown below:
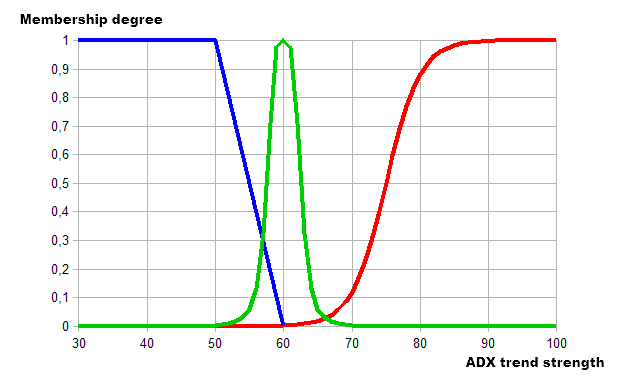
Fig. 6. Describing a trend using the fuzzy logic
As we can see, the graph now has the areas featuring two trend categories simultaneously. The trend in the area 50-60 is weak and average, while in 60-70 it is average and strong. Thus, we have defined a term set with the predetermined membership functions for the three categories. Now that we have the ADX inputs described by the membership functions, we should define what we consider an output value and defuzzification result, as well as select a fuzzy logical output algorithm.
For our example, I have selected the deposit risk percentage relative to the initially specified fuzzy trend strength variable. In other words, the stronger the trend, the higher the risk and deposit percentage applied in trading. I have chosen Mamdani as the logical output algorithm.
Like with the trend strength, let's introduce three distinct categories according to the degree of risk:
- Low risk – 2-4% of the deposit.
- Normal risk (Normal) – 4-5%.
- High risk (High) – from 5 to the maximum value of 10% of the deposit.
Now, let's define risk categories using the membership functions:
- Trapezoidal – for low risk.
- Triangular – for normal risk.
- Sigmoid – for high risk.
As a result, we obtain the following graphical description by means of fuzzy logic:
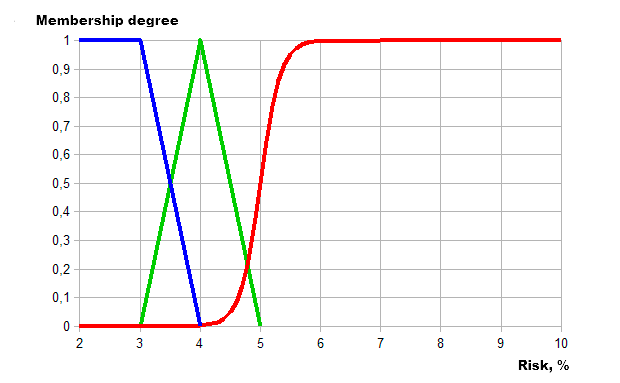
Fig. 7. Describing a degree of risk by means of the fuzzy logic
Let's implement described data using the FuzzyNet library for MQL4:
//+------------------------------------------------------------------+
//|                                                    ADX_Fuzzy.mq4 |
//|                                                Alexander Fedosov |
//|                           https://www.mql5.com/en/users/alex2356 |
//+------------------------------------------------------------------+
#property copyright "Alexander Fedosov"
#property link      "https://www.mql5.com/en/users/alex2356"
#property version   "1.00"
#property strict
#property indicator_separate_window
#property indicator_buffers 2
#property indicator_color1 Green
#property indicator_color2 Red
#property indicator_minimum 0
#property indicator_maximum 10
//+------------------------------------------------------------------+
//| Connecting libraries                                             |
//+------------------------------------------------------------------+
#include <Math\FuzzyNet\MamdaniFuzzySystem.mqh>
//--- input parameters
input string  p1="==== Parameters ====";
input int    visual=100;             // Visual Period
input int    adx_period=10;          // ADX Period
//---
double Buffer1[],Buffer2[],adx,adx_di_minus,adx_di_plus;
int limit;
//+------------------------------------------------------------------+
//| Custom indicator initialization function                         |
//+------------------------------------------------------------------+
int OnInit()
  {
//--- indicator buffers mapping
   SetIndexStyle(0,DRAW_HISTOGRAM,0,2);
   SetIndexBuffer(0,Buffer1);
   SetIndexEmptyValue(0,0.0);
//---
   SetIndexStyle(1,DRAW_HISTOGRAM,0,2);
   SetIndexBuffer(1,Buffer2);
   SetIndexEmptyValue(1,0.0);
//---
   ArrayResize(Buffer1,visual);
   ArrayResize(Buffer2,visual);
   ArrayInitialize(Buffer1,0.0);
   ArrayInitialize(Buffer2,0.0);
//---
   return(INIT_SUCCEEDED);
  }
//+------------------------------------------------------------------+
//| Custom indicator iteration function                              |
//+------------------------------------------------------------------+
int OnCalculate(const int rates_total,
                const int prev_calculated,
                const datetime &time[],
                const double &open[],
                const double &high[],
                const double &low[],
                const double &close[],
                const long &tick_volume[],
                const long &volume[],
                const int &spread[])
  {
   int count_bars=IndicatorCounted();
//---
   if(count_bars<0)
      return(-1);
//---
   if(Bars-1<adx_period)
      return(0);
//---
   for(int i=0; i<visual;i++)
     {
      adx=NormalizeDouble(iADX(_Symbol,PERIOD_CURRENT,adx_period,PRICE_CLOSE,MODE_MAIN,i),_Digits);
      adx_di_plus=NormalizeDouble(iADX(_Symbol,PERIOD_CURRENT,adx_period,PRICE_CLOSE,MODE_PLUSDI,i),_Digits);
      adx_di_minus=NormalizeDouble(iADX(_Symbol,PERIOD_CURRENT,adx_period,PRICE_CLOSE,MODE_MINUSDI,i),_Digits);
      //---
      double r=(adx_di_plus-adx_di_minus);
      if(MathAbs(r)>10 && adx>=30.0)
         if(r>0)
            Buffer1[i]=mamdani(adx);
      else if(r<0)
         Buffer2[i]=mamdani(adx);
     }
   return(rates_total);
  }
//+------------------------------------------------------------------+
//|                                                                  |
//+------------------------------------------------------------------+
double mamdani(double v)
  {
   double res=0;
//--- Mamdani Fuzzy System
   MamdaniFuzzySystem *fsRisk=new MamdaniFuzzySystem();
//--- Create input variables for the system
   FuzzyVariable *fsTrend=new FuzzyVariable("trend",30.0,100.0);
//---
   fsTrend.Terms().Add(new FuzzyTerm("weak", new TrapezoidMembershipFunction(20.0, 30.0, 50.0, 60.0)));
   fsTrend.Terms().Add(new FuzzyTerm("average", new GeneralizedBellShapedMembershipFunction(2.5,2.0,60.0)));
   fsTrend.Terms().Add(new FuzzyTerm("strong",new SigmoidalMembershipFunction(0.4,75.0)));
   fsRisk.Input().Add(fsTrend);
//--- Create Output
   FuzzyVariable *fvRisk=new FuzzyVariable("risk",2.0,10.0);
   fvRisk.Terms().Add(new FuzzyTerm("low", new TrapezoidMembershipFunction(1.0, 2.0, 3.0, 4.0)));
   fvRisk.Terms().Add(new FuzzyTerm("normal", new TriangularMembershipFunction(3.0, 4.0, 5.0)));
   fvRisk.Terms().Add(new FuzzyTerm("high", new SigmoidalMembershipFunction(6.0,5.0)));
   fsRisk.Output().Add(fvRisk);
//--- Create three Mamdani fuzzy rules
   MamdaniFuzzyRule *rule1 = fsRisk.ParseRule("if (trend is weak) then risk is low");
   MamdaniFuzzyRule *rule2 = fsRisk.ParseRule("if (trend is average) then risk is normal");
   MamdaniFuzzyRule *rule3 = fsRisk.ParseRule("if (trend is strong) then risk is high");
//--- Add three Mamdani fuzzy rules in the system
   fsRisk.Rules().Add(rule1);
   fsRisk.Rules().Add(rule2);
   fsRisk.Rules().Add(rule3);
//--- Set input value
   CList *in=new CList;
   Dictionary_Obj_Double *p_od_in=new Dictionary_Obj_Double;
   p_od_in.SetAll(fsTrend,v);
   in.Add(p_od_in);
//--- Get result
   CList *result;
   Dictionary_Obj_Double *p_od_out;
   result=fsRisk.Calculate(in);
   p_od_out=result.GetNodeAtIndex(0);
   res=NormalizeDouble(p_od_out.Value(),_Digits);
//---
   delete in;
   delete result;
   delete fsRisk;
   return res;
  }
//+------------------------------------------------------------------+
I have developed a simple histogram indicator visualizing the risk degree/trend strength ratio (green – bullish trend, red – bearish trend). The histogram bars' height displays a numerical value of a risk degree at various trend strength within the limits described above. Let's examine the code in details.
First, let's define the two buffers for applied histograms, as well as their color and range at the vertical axis from zero to the highest specified risk of 10%.
#property indicator_separate_window
#property indicator_buffers 2
#property indicator_color1 Green
#property indicator_color2 Red
#property indicator_minimum 0
#property indicator_maximum 10
Next, connect the library for creating systems according to the Mamdani algorithm and add variables for visualizing the amount of bars beginning from the zero one and adjusted ADX period.
//+------------------------------------------------------------------+
//| Connecting libraries FuzzyNet                                    |
//+------------------------------------------------------------------+
#include <Math\FuzzyNet\MamdaniFuzzySystem.mqh>
//--- input parameters
input string  p1="==== Parameters ====";
input int    visual=100;             // Visual Period
input int    adx_period=10;          // ADX Period
When initializing, we should set the indicator to be in the form of a histogram.
//+------------------------------------------------------------------+
//| Custom indicator initialization function                         |
//+------------------------------------------------------------------+
int OnInit()
  {
//--- indicator buffers mapping
   SetIndexStyle(0,DRAW_HISTOGRAM,0,2);
   SetIndexBuffer(0,Buffer1);
   SetIndexEmptyValue(0,0.0);
//---
   SetIndexStyle(1,DRAW_HISTOGRAM,0,2);
   SetIndexBuffer(1,Buffer2);
   SetIndexEmptyValue(1,0.0);
//---
   ArrayResize(Buffer1,visual);
   ArrayResize(Buffer2,visual);
   ArrayInitialize(Buffer1,0.0);
   ArrayInitialize(Buffer2,0.0);
//---
   return(INIT_SUCCEEDED);
  }
In the main code, we define the basic readings of ADX indicator. r variable is used to find the difference between the two trend direction indicators +DI and -DI. Further on, we introduce the trend presence filter as a difference between the absolute +DI and -DI values above 10 and the main trend strength above 30 (the lower limit of a weak trend). Next, let's define a trend direction based on the r variable sign and place mamdani() function into a predetermined value.
int count_bars=IndicatorCounted();
//---
   if(count_bars<0)
      return(-1);
//---
   if(Bars-1<adx_period)
      return(0);
//---
   for(int i=0; i<visual;i++)
     {
      adx=NormalizeDouble(iADX(_Symbol,PERIOD_CURRENT,adx_period,PRICE_CLOSE,MODE_MAIN,i),_Digits);
      adx_di_plus=NormalizeDouble(iADX(_Symbol,PERIOD_CURRENT,adx_period,PRICE_CLOSE,MODE_PLUSDI,i),_Digits);
      adx_di_minus=NormalizeDouble(iADX(_Symbol,PERIOD_CURRENT,adx_period,PRICE_CLOSE,MODE_MINUSDI,i),_Digits);
      //---
      double r=(adx_di_plus-adx_di_minus);
      if(MathAbs(r)>10 && adx>=30.0)
         if(r>0)
            Buffer1[i]=mamdani(adx);
      else if(r<0)
         Buffer2[i]=mamdani(adx);
     }
Mamdani function description:
1. Let's create the new system of the Mamdani-type fuzzy logic system *fsRisk.
2. Add the *fsTrend variable to it with a specified trend name and the minimum and maximum values of 30 and 100.
//--- Mamdani Fuzzy System
   MamdaniFuzzySystem *fsRisk=new MamdaniFuzzySystem();
//--- Create input variables for the system
   FuzzyVariable *fsTrend=new FuzzyVariable("trend",30.0,100.0);
3. Next, we should add the fuzzy terms described above (Fig. 6) with the membership functions selected for each category.
fsTrend.Terms().Add(new FuzzyTerm("weak", new TrapezoidMembershipFunction(30.0, 40.0, 50.0, 60.0)));
   fsTrend.Terms().Add(new FuzzyTerm("average", new GeneralizedBellShapedMembershipFunction(2.5,2.0,60.0)));
   fsTrend.Terms().Add(new FuzzyTerm("strong",new SigmoidalMembershipFunction(0.4,75.0)));
   fsRisk.Input().Add(fsTrend);
4. Pass the steps 2-3 for the output value: create *fvRisk variable named risk and the minimum and maximum risk values of 2% and 10%.
//--- Create Output
   FuzzyVariable *fvRisk=new FuzzyVariable("risk",2.0,10.0);
   fvRisk.Terms().Add(new FuzzyTerm("low", new TriangularMembershipFunction(2.0, 3.0, 4.0)));
   fvRisk.Terms().Add(new FuzzyTerm("normal", new TriangularMembershipFunction(3.0, 4.0, 5.0)));
   fvRisk.Terms().Add(new FuzzyTerm("high", new SigmoidalMembershipFunction(6.0,5.0)));
   fsRisk.Output().Add(fvRisk);
5. Now, let's create a set of three fuzzy rules representing our system:
- If a trend is weak, the risk is low.
- If a trend is average, the risk is normal.
- If a trend is strong, the risk is high.
//--- Create three Mamdani fuzzy rules
   MamdaniFuzzyRule *rule1 = fsRisk.ParseRule("if (trend is weak) then risk is low");
   MamdaniFuzzyRule *rule2 = fsRisk.ParseRule("if (trend is average) then risk is normal");
   MamdaniFuzzyRule *rule3 = fsRisk.ParseRule("if (trend is strong) then risk is high");
6. Let's add our rules into the system:
//--- Add three Mamdani fuzzy rules in the system
   fsRisk.Rules().Add(rule1);
   fsRisk.Rules().Add(rule2);
   fsRisk.Rules().Add(rule3);
7. Create the lists for input and output variables and add v input to be the mamdani function argument. Thus, the entire fuzzy logic system with specified input and output fuzzy variables is set for the entire mamdani function, while ADX indicator value is used as an input.
//--- Set input value
   CList *in=new CList;
   Dictionary_Obj_Double *p_od_in=new Dictionary_Obj_Double;
   p_od_in.SetAll(fsTrend,v);
   in.Add(p_od_in);
//--- Get result
   CList *result=new CList;
   Dictionary_Obj_Double *p_od_out=new Dictionary_Obj_Double;
   result=fsRisk.Calculate(in);
   p_od_out=result.GetNodeAtIndex(0);
   res=NormalizeDouble(p_od_out.Value(),_Digits);
8. The resulting function value is res variable the histogram is based upon.
adx=NormalizeDouble(iADX(_Symbol,PERIOD_CURRENT,adx_period,PRICE_CLOSE,MODE_MAIN,i),_Digits);
      adx_di_plus=NormalizeDouble(iADX(_Symbol,PERIOD_CURRENT,adx_period,PRICE_CLOSE,MODE_PLUSDI,i),_Digits);
      adx_di_minus=NormalizeDouble(iADX(_Symbol,PERIOD_CURRENT,adx_period,PRICE_CLOSE,MODE_MINUSDI,i),_Digits);
      //---
      double r=(adx_di_plus-adx_di_minus);
      if(MathAbs(r)>10 && adx>=30.0)
         if(r>0)
            Buffer1[i]=mamdani(adx);
      else if(r<0)
         Buffer2[i]=mamdani(adx);
The visual indicator operation results are presented below:
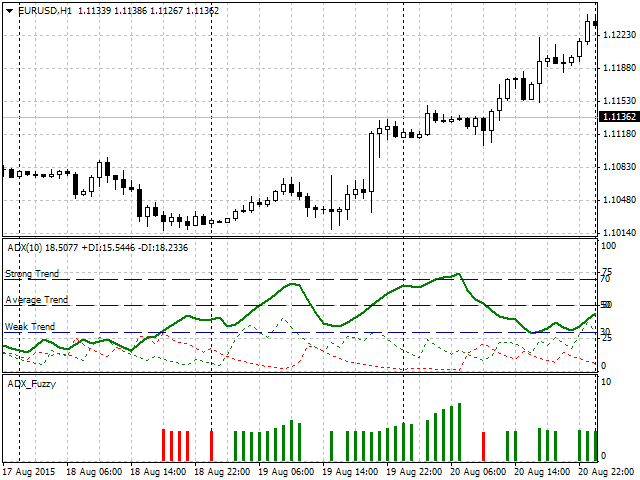
Fig. 8. Indicator operation
As we can see, the indicator shows the presence of a trend using a histogram color, while a bar height shows a recommended risk percentage of the deposit. The obvious question arises – what would be the difference if the indicator was implemented with clear intervals? To answer it, let's consider the following section in more details (Fig. 9). The green arrow shows the histogram bar, while its numerical value and ADX trend strength are displayed to the left. As defined earlier, ADX exceeding 70 is a strong trend meaning that the risk value should exceed 5%. As we can clearly see in Fig. 9, ADX = 69.7923. Thus, if we apply strict rules, this is still an average trend and the risk should not exceed 5%. However, it is equal to 5.6406, i.e. it is higher.
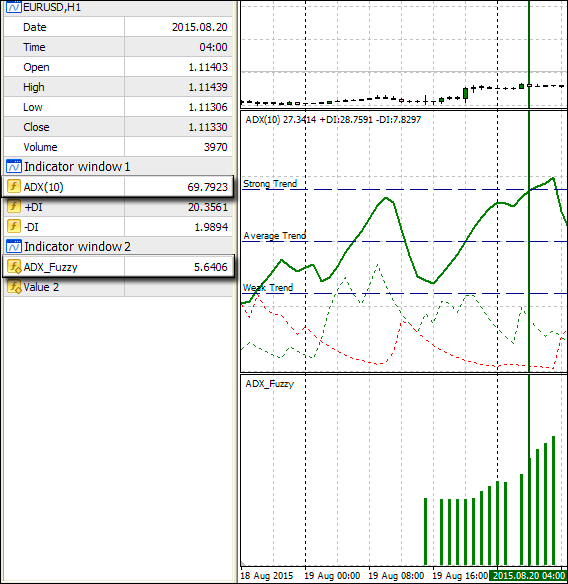
Fig. 9. Showing the differences between fuzzy and standard logic
Here we can see the fuzzy logic in action. It has defined that even though the value is less than 70, the trend in the area is rather strong than average. We can see this ourselves by examining the Fig. 6. When the X axis value shows 69.7923, the membership function of a strong trend is higher than the average trend function. Therefore, our system has offered the risk value exceeding 5% approaching the border area between strong and average trend in more flexible manner as compared to the strict logic system.
Sample implementation of an Expert Advisor by means of FuzzyNet library for MQL4
Here I want to show the difference in the Expert Advisor operation in case of clearly defined conditions and fuzzy logic elements. To make the comparison as well-grounded as possible, I decided to use the Expert Advisor from my other article "Trading ideas based on prices' direction and movement speed", which describes in details the idea of the trading robot. In order to avoid excessive repetitions, I will use this EA as a basis with the following changes:
- The logic of the EA is based on the idea of the price movement persistence. Movement parameters are described by the following indicators: RSI (speed indicator) and AC (acceleration indicator). Speed and acceleration are estimated by indexing the value ranges of these indicators. Now, let's apply the fuzzy set theory to the RSI index values. As a result, RSI values are used as inputs, while the output is a fuzzy speed index that may have not only integer values, like 1-4, but also 1.3 or 3.85.
- In turn, the fuzzy index value is used as an input for another system, in which the output is a profit value. Thus, take profit remains intact in the initial EA.
The idea behind the connection is simple. If RSI and AC are movement parameters, then the higher the speed, the higher the movement persistence, and therefore it is reasonable to place a greater take profit. If the movement speed is low, a target profit should be set more tightly in order not to run into a roll-back or a trend reversal. Fig. 10 shows a block-diagram for a clearer understanding of the fuzzy logic application in the EA.
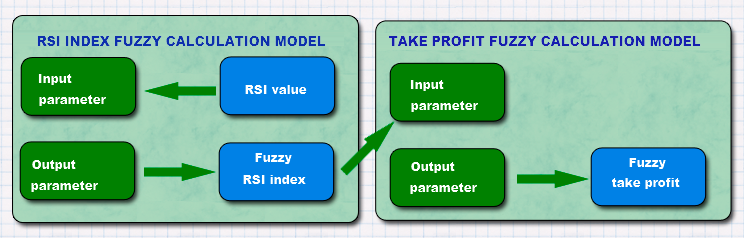
Fig. 10. Applying the fuzzy logic in the EA
As is the case with the indicator, let's describe the membership functions for both fuzzy models. The first one is a fuzzy model of calculating RSI index where the input is the indicator value. Let's divide the necessary values into three categories:
- Weak. The first category defines the weak trend. RSI: 60-70.
- Average. The second category defines the average trend. RSI: 70-80.
- Strong. The third category is related to a strong trend. RSI: 80-85.
Let's select the membership function to describe the specified categories:
- Weak. The sigmoid function with the slope ratio of -0.75 and inflection point 67.5.
- Average. The Gaussian function with the maximum coordinate of 72.5 and the concentration ratio of 2.2.
- Strong. The Gaussian function with the maximum coordinate of 80 and the concentration ratio of 1.4.
The visual presentation is as follows:
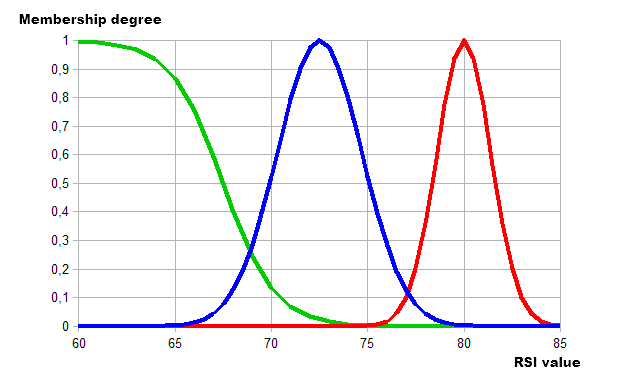
Fig. 11. Using the membership functions to describe the categories of RSI values
The output of this fuzzy model is RSI index. The following categories and membership functions are used to describe it:
- Low. Low index, range 1-2. The membership function is the sigmoid one with the slope of -11 and inflection point of 1.5.
- Normal. Average index, range 2-3. The membership function is the Gaussian one with the maximum point of 2 and the concentration ratio of 0.3.
- High. High index, range 3-4. The membership function is the sigmoid one with the slope of 6 and inflection point 3.
As a result, we obtain the following visualization:
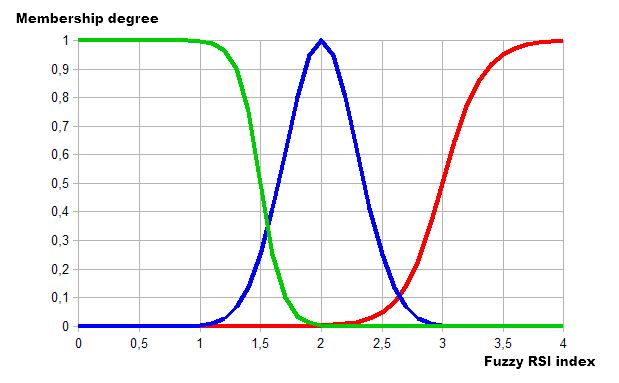
Fig. 12. Using the membership functions to describe the categories of RSI index values
Next, let's describe the second fuzzy model from Fig. 10 – fuzzy take profit calculation model. The model's inputs have already been described as the outputs of the first model (RSI fuzzy index). A take profit value is used as an output here. Let's define concise categories for it:
- Minimal. Minimum take profit category within the range of 30-40.
- Average. Average take profit category within the range of 40-60.
- Maximal. High take profit category within the range of 60-70.
Now, let's make descriptions using the membership functions:
- Minimal. The membership function is the sigmoid one with the slope of -0.8 and inflection point of 37.5.
- Average. The membership function is the Gaussian function with the maximum coordinate of 50 and the concentration ratio of 3.
- Maximal. The membership function is the sigmoid one with the slope of 0.8 and inflection point of 62.5.
The graphical implementation looks as follows:
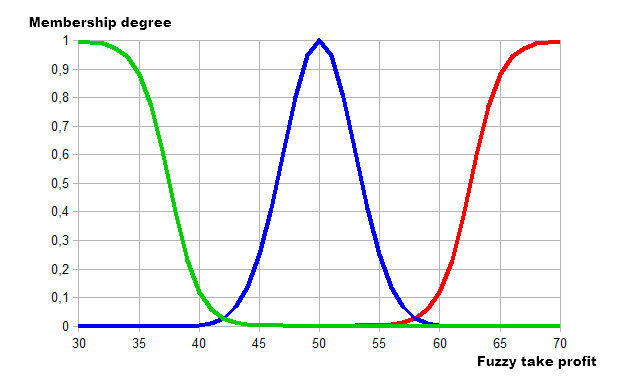
Fig. 13. Using the membership functions to describe the categories of take profit values
Now that all parameters are defined, it is time to implement the idea into the trading robot. We will add two fuzzy models for successive calculation of stop loss and take profit based on RSI readings.
//+------------------------------------------------------------------+
//|                                                       tester.mq4 |
//|                                                Alexander Fedosov |
//|                                                                  |
//+------------------------------------------------------------------+
#property copyright "Alexander Fedosov"
#property strict
#include "trading.mqh" //Support library for trade operations
//+------------------------------------------------------------------+
//| Connecting libraries                                             |
//+------------------------------------------------------------------+
#include <Math\FuzzyNet\MamdaniFuzzySystem.mqh>
//+------------------------------------------------------------------+
//| Parameters                                                       |
//+------------------------------------------------------------------+
input bool           Lot_perm=false;               // Lot of balance?
input double         Risk = 2;                     // Risk of deposit, %
input double         lt=0.01;                      // Lot
input int            magic=2356;                   // Magic number
input int            period=14;                    // RSI indicator period
input ENUM_TIMEFRAMES tf=PERIOD_CURRENT;           // Working timeframe
//---
int index_rsi,index_ac;
double tkp,stl;
double rs,mdm;
CTrading tr;
//+------------------------------------------------------------------+
//| Expert initialization function                                   |
//+------------------------------------------------------------------+
int OnInit()
  {
   tr.Trading(magic,5,lt,Lot_perm,Risk);
   tr.exp_name="Tester Fuzzy Logic";
   return(INIT_SUCCEEDED);
  }
//+------------------------------------------------------------------+
//| Main calculation function                                        |
//+------------------------------------------------------------------+
void OnTick()
  {
//--- check for presence of open orders
   if(!tr.isOpened(magic))
     {
      depth_trend();
      speed_ac();
      rs=tr.ND(iRSI(_Symbol,tf,period,PRICE_CLOSE,0),2);
      //--- check of buy conditions
      if(Buy() && rs<=85.0)
        {
         mdm = mamdani_rsi(rs);
         tkp = MathCeil(mamdani_tp(mdm));
         stl = MathCeil(tkp*0.43);
         if(tr.OpnOrd(OP_BUY,lt,(int)tkp,(int)stl))
            Print("RSI is equal to ",rs," TP is equal to ",tkp," SL is equal to ",stl);
        }
      //--- check of sell conditions
      if(Sell() && rs>=15.0)
        {
         mdm = mamdani_rsi(100-rs);
         tkp = MathCeil(mamdani_tp(mdm));
         stl = MathCeil(tkp*0.43);
         if(tr.OpnOrd(OP_SELL,lt,(int)tkp,(int)stl))
            Print("RSI is equal to ",rs," TP is equal to ",tkp," SL is equal to ",stl);
        }
     }
//--- are there open orders?
   if(tr.isOpened(magic))
     {
      //--- check and close sell orders which meet closing conditions
      if(Sell_close())
         tr.ClosePosAll(OP_SELL);
      //--- check and close buy orders which meet closing conditions
      if(Buy_close())
         tr.ClosePosAll(OP_BUY);
     }
  }
//+---------------------------------------------------------------+
//| Function for determining the trend depth                      |
//+---------------------------------------------------------------+
void depth_trend()
  {
//--- define the market entry index
   double rsi=iRSI(_Symbol,tf,period,PRICE_CLOSE,0);
//---
   index_rsi=0;
   if(rsi>90.0)
      index_rsi=4;
   else if(rsi>80.0)
      index_rsi=3;
   else if(rsi>70.0)
      index_rsi=2;
   else if(rsi>60.0)
      index_rsi=1;
   else if(rsi<10.0)
      index_rsi=-4;
   else if(rsi<20.0)
      index_rsi=-3;
   else if(rsi<30.0)
      index_rsi=-2;
   else if(rsi<40.0)
      index_rsi=-1;
  }
//+----------------------------------------------------------------+
//| Function for determining the trend speed                       |
//+----------------------------------------------------------------+
void speed_ac()
  {
   double ac[];
   ArrayResize(ac,5);
   ArrayInitialize(ac,0.0);
   for(int i=0; i<5; i++)
      ac[i]=iAC(_Symbol,tf,i);
//---
   index_ac=0;
//--- buy indices
   if(ac[0]>ac[1])
      index_ac=1;
   else if(ac[0]>ac[1] && ac[1]>ac[2])
      index_ac=2;
   else if(ac[0]>ac[1] && ac[1]>ac[2] && ac[2]>ac[3])
      index_ac=3;
   else if(ac[0]>ac[1] && ac[1]>ac[2] && ac[2]>ac[3] && ac[3]>ac[4])
      index_ac=4;
//--- sell indices
   else if(ac[0]<ac[1])
      index_ac=-1;
   else if(ac[0]<ac[1] && ac[1]<ac[2])
      index_ac=-2;
   else if(ac[0]<ac[1] && ac[1]<ac[2] && ac[2]<ac[3])
      index_ac=-3;
   else if(ac[0]<ac[1] && ac[1]<ac[2] && ac[2]<ac[3] && ac[3]<ac[4])
      index_ac=-4;
  }
//+----------------------------------------------------------------+
//| Function for checking buy conditions                           |
//+----------------------------------------------------------------+
bool Buy()
  {
   return (((index_rsi==2 && index_ac>=1) || (index_rsi==3 && index_ac==1))?true:false);
  }
//+----------------------------------------------------------------+
//| Function for checking sell conditions                          |
//+----------------------------------------------------------------+
bool Sell()
  {
   return (((index_rsi==-2 && index_ac<=-1) || (index_rsi==-3 && index_ac==-1))?true:false);
  }
//+----------------------------------------------------------------+
//| Function for checking buy position closing conditions          |
//+----------------------------------------------------------------+
bool Buy_close()
  {
   return ((index_rsi>2 && index_ac<0)?true:false);
  }
//+----------------------------------------------------------------+
//| Function for checking sell position closing conditions         |
//+----------------------------------------------------------------+
bool Sell_close()
  {
   return ((index_rsi<-2 && index_ac>0)?true:false);
  }
//+----------------------------------------------------------------+
//| RSI index fuzzy calculation model                              |
//+----------------------------------------------------------------+
double mamdani_rsi(double rsi)
  {
   double res=0;
//--- Mamdani Fuzzy System
   MamdaniFuzzySystem *fsRSI=new MamdaniFuzzySystem();
//--- create the inputs for the system and define the terms
   FuzzyVariable *fsTrend=new FuzzyVariable("rsi",60.0,85.0);
//---
   fsTrend.Terms().Add(new FuzzyTerm("weak", new SigmoidalMembershipFunction(-0.75,67.5)));
   fsTrend.Terms().Add(new FuzzyTerm("average", new NormalMembershipFunction(72.5,2.2)));
   fsTrend.Terms().Add(new FuzzyTerm("strong", new NormalMembershipFunction(80.0,1.4)));
   fsRSI.Input().Add(fsTrend);
//--- create the outputs for the system and define the terms
   FuzzyVariable *fsIndex=new FuzzyVariable("index",1.0,4.0);
   fsIndex.Terms().Add(new FuzzyTerm("low", new SigmoidalMembershipFunction(-11.0,1.5)));
   fsIndex.Terms().Add(new FuzzyTerm("normal", new NormalMembershipFunction(2.0,0.3)));
   fsIndex.Terms().Add(new FuzzyTerm("high", new SigmoidalMembershipFunction(6.0,3.0)));
   fsRSI.Output().Add(fsIndex);
//--- create fuzzy rules and add them to the system
   MamdaniFuzzyRule *rule1 = fsRSI.ParseRule("if (rsi is weak) then (index is low)");
   MamdaniFuzzyRule *rule2 = fsRSI.ParseRule("if (rsi is average) then (index is normal)");
   MamdaniFuzzyRule *rule3 = fsRSI.ParseRule("if (rsi is strong) then (index is high)");
   fsRSI.Rules().Add(rule1);
   fsRSI.Rules().Add(rule2);
   fsRSI.Rules().Add(rule3);
//--- set input values
   CList *in=new CList;
   Dictionary_Obj_Double *p_od_in=new Dictionary_Obj_Double;
   p_od_in.SetAll(fsTrend,rsi);
   in.Add(p_od_in);
//--- result output
   CList *result=new CList;
   Dictionary_Obj_Double *p_od_out=new Dictionary_Obj_Double;
   result=fsRSI.Calculate(in);
   p_od_out=result.GetNodeAtIndex(0);
   res=NormalizeDouble(p_od_out.Value(),_Digits);
//---
   delete in;
   delete result;
   delete fsRSI;
   return res;
  }
//+----------------------------------------------------------------+
//| Fuzzy model of take profit index calculation                   |
//+----------------------------------------------------------------+
double mamdani_tp(double ind_rsi)
  {
   double res=0;
//--- Mamdani Fuzzy System
   MamdaniFuzzySystem *fsTP=new MamdaniFuzzySystem();
//--- create the inputs for the system and define the terms
   FuzzyVariable *fsIndex=new FuzzyVariable("index",1.0,4.0);
   fsIndex.Terms().Add(new FuzzyTerm("low", new SigmoidalMembershipFunction(-11.0,1.5)));
   fsIndex.Terms().Add(new FuzzyTerm("normal", new NormalMembershipFunction(2.0,0.3)));
   fsIndex.Terms().Add(new FuzzyTerm("high", new SigmoidalMembershipFunction(6.0,3.0)));
   fsTP.Input().Add(fsIndex);
//--- create the inputs for the system and define the terms
   FuzzyVariable *fsProfit=new FuzzyVariable("TP",30.0,70.0);
   fsProfit.Terms().Add(new FuzzyTerm("minimal", new SigmoidalMembershipFunction(-0.8,37.5)));
   fsProfit.Terms().Add(new FuzzyTerm("average", new NormalMembershipFunction(50.0,3.0)));
   fsProfit.Terms().Add(new FuzzyTerm("maximal", new SigmoidalMembershipFunction(0.8,62.5)));
   fsTP.Output().Add(fsProfit);
//--- create fuzzy rules and add them to the system
   MamdaniFuzzyRule *rule1 = fsTP.ParseRule("if (index is low) then (TP is minimal)");
   MamdaniFuzzyRule *rule2 = fsTP.ParseRule("if (index is normal) then (TP is average)");
   MamdaniFuzzyRule *rule3 = fsTP.ParseRule("if (index is high) then (TP is maximal)");
   fsTP.Rules().Add(rule1);
   fsTP.Rules().Add(rule2);
   fsTP.Rules().Add(rule3);
//--- set input values
   CList *in=new CList;
   Dictionary_Obj_Double *p_od_in=new Dictionary_Obj_Double;
   p_od_in.SetAll(fsIndex,ind_rsi);
   in.Add(p_od_in);
//--- result output
   CList *result=new CList;
   Dictionary_Obj_Double *p_od_out=new Dictionary_Obj_Double;
   result=fsTP.Calculate(in);
   p_od_out=result.GetNodeAtIndex(0);
   res=NormalizeDouble(p_od_out.Value(),_Digits);
//---
   delete in;
   delete result;
   delete fsTP;
   return res;
  }
//+------------------------------------------------------------------+
Now, let's examine the major changes that have been made to the EA:
- The most important change is implementation of the two fuzzy models as mamdani_rsi and mamdani_tp functions.
- Stop loss and take profit parameters have thus been removed. They are now calculated using the fuzzy logic.
- Here is how this calculation is implemented:
if(OrdersTotal()<1)
     {
      depth_trend();
      speed_ac();
      rs=tr.ND(iRSI(_Symbol,tf,period,PRICE_CLOSE,0),2);
      //--- check buy conditions
      if(Buy() && rs<=85.0)
        {
         mdm = mamdani_rsi(rs);
         tkp = MathCeil(mamdani_tp(mdm));
         stl = MathCeil(tkp*0.43);
         if(tr.OpnOrd(OP_BUY,lt,tkp,stl))
            Print("RSI is equal to ",rs," TP is equal to ",tkp," SL is equal to ",stl);
        }
      //--- check sell conditions
      if(Sell() && rs>=15.0)
        {
         mdm = mamdani_rsi(100-rs);
         tkp = MathCeil(mamdani_tp(mdm));
         stl = MathCeil(tkp*0.43);
         if(tr.OpnOrd(OP_SELL,lt,tkp,stl))
            Print("RSI is equal to ",rs," TP is equal to ",tkp," SL is equal to ",stl);
        }
     }
If there are no open orders with the EA magic, the system uses the depth_trend() and speed_ac() functions to track market movement parameters. An entry is performed if they match Buy() or Sell(). Next, if the conditions are met, the fuzzy model operation result is assigned to mdm parameter which uses the current RSI value as an input and a fuzzy index as an output. In turn, the fuzzy index value is used as an input for another system, in which the output is a take profit value in points. Take profit value is assigned to tkp variable.
The ratio of 0.43 is taken based on the maximum profit value of 70 points, while the appropriate stop loss is 30. In case of a successful order opening, our EA also shows the RSI value, at which the order was opened, as well as calculated stop loss and take profit parameters based on it. This is done purely for testing convenience.
Also, it is necessary to clarify the following:
- In case of a sell condition, mamdani_rsi(100-rs) is assigned to mdm. This is done because their ranges and borders relative to RSI extreme values (0 and 100) are mirrored.
- Two additional conditions: when buying rs<=85 and similarly when selling rs>=15. This is done because when creating the RSI index calculation fuzzy model inputs, the borders are set to 60-85. Thus, the value of 15 turns out to be the extreme one for selling.
The EA operation example is shown in Fig. 14. As we can see, stop loss and take profit values are re-calculated in case of different RSI values.
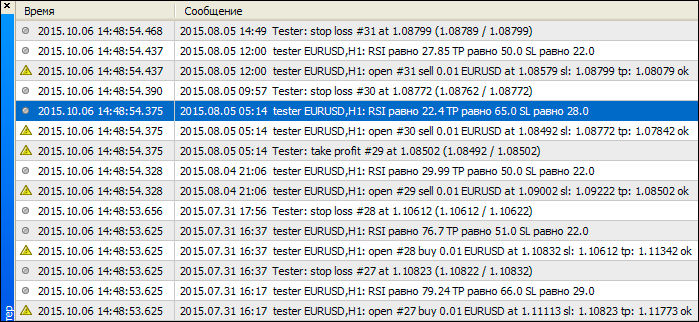
Fig. 14. Expert Advisor operation results
Conclusion
In this article, we have examined sample implementations of the fuzzy set theory using the FuzzyNet library by means of MQL4. We have shown that systems based on the fuzzy logic are more flexible when dealing with the strict category issues, like trend classification or risk differentiation. The Expert Advisor demonstrated how a fuzzy logic-based system analyzes a trading signal strength while applying its own trading strategy and defining appropriate stop loss and take profit values. I believe that trading systems based on the fuzzy logic are capable of combining the best qualities necessary for successful trading – discipline of a trading robot and flexibility of a human mind.
Translated from Russian by MetaQuotes Ltd.
Original article: https://www.mql5.com/ru/articles/2032
 Calculator of signals
 Deep neural network with Stacked RBM. Self-training, self-control
- Free trading apps
- Over 8,000 signals for copying
- Economic news for exploring financial markets
You agree to website policy and terms of use
Hi there i been work on fuzzy logic it work good apart from this undeleted ojects.
i code the old way OOP is new to me do i need to call a Destructor to fix this.
7882896 objects of type S_ShapedMembershipFunction left
7882896 undeleted objects left
thank you.