
How to create an indicator of non-standard charts for MetaTrader Market
Table of Contents
- Introduction
- 1. "IndCreateOffline" indicator that will create an offline chart
- 1.1. Editing the indicator header line
- 1.2. Checking the chart type
- 1.3. Function of creating history file header
- 1.4. First record of quotes to the *.hst file
- 1.5. Writing online quotes
- 1.6. Editing the OnCalculate() function
- 2. Starting indicator on offline chart
- 2.1. Updating offline chart with ChartSetSymbolPeriod()
- 2.2. Maintenance mode
- 2.3. Copying the indicator to the offline chart
- 2.4. Integration in MACD.mq4
- 2.5. Economical indicator recalculation on the offline chart
- 2.6. Loading data. Offline chart
- 3. Indicator displaying Renko bars
- 3.1. Rules of plotting Range bars
- 3.2. Forming bricks on historical data
- 3.3. Indicator operating online
- 4. Indicator that creates a non-standard symbol - USDx dollar index
From Japanese candlesticks to Renko charts
The most popular type of charts among traders to date are Japanese candlesticks that help to evaluate the current market situation with ease. Candlestick charts give a good visual presentation of price development within a period of time covered by a single candlestick. But some traders believe that it is a disadvantage that charts hold a time component, so they prefer to deal only with a price change. This is how charts "Point & Figure", "Renko", "Kagi", "Range bars", equivolume chart, etc. first appeared.
All these charts can be obtained in MetaTrader 4 through offline charts, programming in MQl4 and reasonable willingness. There is an opportunity to create charts with custom synthetic products (that brokers don't have or that don't exist) and non-standard timeframes that are not available in the platform. Most developer tend to use DLL calls and complicated schemes for such purpose. In this article we will describe how to create different complexity indicators of "two for one" type that don't only require knowledge of DLL, but can be also easily published in the Market as a product, since they are completely independent and complete applications.
Examples from the article can be downloaded from the Market for free:
- USDx Chart MT4 - the "USDx Chart MT4" indicator creates an offline chart where dollar index is drawn instead of commonly used bars and candlesticks.
- Renko Chart MT4 - the Renko Chart MT4 indicator creates an offline Renko chart where all bars are shown as Renko bricks. Bricks don't have shadows, and the size of a brick is specified in settings.
There is no need for an indicator that creates an offline chart with non-standard symbols and/or period to call DLL, things get solved with MQL4. Therefore, the following operation scheme has to be implemented: the same indicator can operate on both online and offline charts. However, it will have to adjust its functionality depending on the mode of charts used.
For online charts, the indicator works in the maintenance mode: it collects and assembles quotes, creates an offline chart (with both standard and non-standard periods), and updates it. For offline charts, the indicator operates the same as any other indicator — it analyzes quotes and builds various objects and figures. Please note that all examples from the article are based on our new standard script PeriodConverter.mq4.
1. "IndCreateOffline" indicator for creating offline chart
We are going to call the indicator IndCreateOffline. It will have only one input parameter in charge of the offline chart period. We will speak about it further below. The IndCreateOffline indicator will perform a single task — create the *.hst file and open the offline chart.
Two basic functions will be used in the indicator. The first function is used just once — for creating the *.hst file and its header. The second function is required for writing quotes in the *.hst file.
1.1. Editing the indicator header line
Even if you feel lazy doing it right away, it is still obligatory to add the file description first. After some time it will help us to remember the purpose of the indicator.
#property version   "1.00"
#property description "The indicator creates an offline chart"
#property strict
#property indicator_chart_window
Theoretically, the offline chart can be created with any period. However, to be on the safe side, we will restrict the wild imagination of a trader that could be interested in a period of 10000000, for example. Let's enter the enumeration where all four options can be selected — two, three, four or six minutes:
#property indicator_chart_window
//+------------------------------------------------------------------+
//| Enumerations of periods offline chart                            |
//+------------------------------------------------------------------+
enum ENUM_OFF_TIMEFRAMES
  {
   M2=2,                      // period M2
   M3=3,                      // period M3
   M4=4,                      // period M4
   M6=6,                      // period M6
  };
//+------------------------------------------------------------------+
//| Custom indicator initialization function                         |
The next step involves adding global variables to the header (not to be confused with global variables in the terminal):
   M6=6,                      // period M6
  };
//--- input parameter
input ENUM_OFF_TIMEFRAMES  ExtOffPeriod=M6;
//---
bool     crash=false;         // false -> error in the code
int      HandleHistory=-1;    // handle for the opened "*.hst" file
datetime time0;               //
ulong    last_fpos=0;         //
long     last_volume=0;       //
int      periodseconds;       //
int      i_period;            //
MqlRates rate;                //
long     ChartOffID=-1;       // ID of the offline chart
//+------------------------------------------------------------------+
//| Custom indicator initialization function                         |
Our indicator IndCreateOffline needs to be started on the online chart, because this is the only way to ensure correct data. In order to identify the type of the chart that the indicator is set on, the property CHART_IS_OFFLINE is utilized. Following OnCalculate(), the IsOffline function that will return the chart type will be added:
//--- return value of prev_calculated for next call
   return(rates_total);
  }
//+------------------------------------------------------------------+
//| The function checks offline mode of the chart                    |
//+------------------------------------------------------------------+
bool IsOffline(const long chart_ID=0)
  {
   bool offline=ChartGetInteger(chart_ID,CHART_IS_OFFLINE);
   return(offline);
  }
//+------------------------------------------------------------------+
Calling the IsOffline function will be performed in OnInit():
int OnInit()
  {
   if(!IsOffline(ChartID()) && Period()!=PERIOD_M1)
     {
      Print("The period on the online chart must be \"M1\"!");
      crash=true;
     }
//---
   return(INIT_SUCCEEDED);
  }
Please bear in mind that if the indicator is on the online chart (IsOffline(ChartID())==false) with a period that doesn't equal PERIOD_M1, then in such case true value is assigned to the crash variable. The outcome: when crash==true, the indicator will simply remain on the online chart and have no other activity there. In that case, the following message will be obtained in the "Experts" tab:
IndCreateOffline EURUSD,H1: The period on the online chart must be "M1"!
The indicator will remain on the online chart and wait until a user changes the period to PERIOD_M1.
Why is PERIOD_M1 so important to us? There are two important points involved.
Point 1: Forming a total period of the offline chart. Let's consider the example of the PeriodConverter.mq4 script, where the total period of the offline chart is calculated:
#property show_inputs
input int InpPeriodMultiplier=3; // Period multiplier factor
int       ExtHandle=-1;
//+------------------------------------------------------------------+
//| script program start function                                    |
//+------------------------------------------------------------------+
void OnStart()
  {
   datetime time0;
   ulong    last_fpos=0;
   long     last_volume=0;
   int      i,start_pos,periodseconds;
   int      cnt=0;
//---- History header
   int      file_version=401;
   string   c_copyright;
   string   c_symbol=Symbol();
   int      i_period=Period()*InpPeriodMultiplier;
   int      i_digits=Digits;
   int      i_unused[13];
   MqlRates rate;
//---
With these input parameters, the online chart period that the script is attached to equals "PERIOD_M3". With value InpPeriodMultiplier=3 we expect the offline chart with period 3. However, in reality we receive period 9:
i_period=Period()*InpPeriodMultiplier=3*3=9
Therefore, in order to obtain period 3, the online chart with PERIOD_M1 must be used.
Point 2: writing the history of deals to the file. Data from array time series Open[], Low[], High[], Volume[], Time[] are used when generating the history file. They all use current chart data for the current period. And what can be more precise than forming any artificial period based on data from the chart with "PERIOD_M1"? Your answer is correct: only the chart with the PERIOD_M1 period.
The indicator changes described above can be found in the IndCreateOfflineStep1.mq4 file.
1.3. Function of creating history file header
We will call the function responsible for creating history filer header as CreateHeader():
bool CreateHeader(
   const ENUM_OFF_TIMEFRAMES offline_period // period of offline chart
   );
Parameters
offline_period
[in] Period of the offline chart.
Returned value
true, if history file was successfully created, and false — in case of errors present.
Complete function listing:
//+------------------------------------------------------------------+
//| The function checks offline mode of the chart                    |
//+------------------------------------------------------------------+
bool IsOffline(const long chart_ID=0)
  {
   bool offline=ChartGetInteger(chart_ID,CHART_IS_OFFLINE);
   return(offline);
  }
//+------------------------------------------------------------------+
//| Create history header                                            |
//+------------------------------------------------------------------+
bool CreateHeader(const ENUM_OFF_TIMEFRAMES offline_period)
  {
//---- History header
   int      file_version=401;
   string   c_copyright;
   string   c_symbol=Symbol();
   i_period=Period()*offline_period;
   int      i_digits=Digits;
   int      i_unused[13];
//---
   ResetLastError();
   HandleHistory=FileOpenHistory(c_symbol+(string)i_period+".hst",FILE_BIN|FILE_WRITE|FILE_SHARE_WRITE|FILE_SHARE_READ|FILE_ANSI);
   if(HandleHistory<0)
     {
      Print("Error open ",c_symbol+(string)i_period,".hst file ",GetLastError());
      return(false);
     }
   c_copyright="(C)opyright 2003, MetaQuotes Software Corp.";
   ArrayInitialize(i_unused,0);
//--- write history file header
   FileWriteInteger(HandleHistory,file_version,LONG_VALUE);
   FileWriteString(HandleHistory,c_copyright,64);
   FileWriteString(HandleHistory,c_symbol,12);
   FileWriteInteger(HandleHistory,i_period,LONG_VALUE);
   FileWriteInteger(HandleHistory,i_digits,LONG_VALUE);
   FileWriteInteger(HandleHistory,0,LONG_VALUE);
   FileWriteInteger(HandleHistory,0,LONG_VALUE);
   FileWriteArray(HandleHistory,i_unused,0,13);
   return(true);
  }
//+------------------------------------------------------------------+
Apart from creating the "*.hst" history file and the file header (first few service strings), the handle of the created file is remembered to the HandleHistory variable in the CreateHeader() function.
1.4. First record of quotes to the *.hst file
After creating the *.hst file and filling its header, we must write the first record to the file — i.e. the file must be filled with current quotes. The FirstWriteHistory() function (you can see it in the indicator) is in charge of the first record to the file.
When does the situation with the "first record" occur in our indicator? It would be logical to assume that it happens during the first loading of the indicator.
The first loading could (and should) be controlled in the indicator based on the prev_calculated variable. The prev_calculated==0 value indicates the first loading. But at the same time prev_calculated==0 can also imply that this is not the first start of our indicator, and previous or missed quotes were added to history. We will discuss what needs to be done when history is updated during the coding of OnCalculate().
After creating and filling the header of *.hst and first logging, we can proceed to writing online quotes. The CollectTicks() function shall be responsible for this (you can see it in the indicator).
Changes of the indicator described above can be found in the IndCreateOfflineStep2.mq4 file.
1.6. Editing the OnCalculate() function
Let's introduce the first_start variable. It will store true value after the first start. In other words, with first_start==true we will know that our indicator hasn't created the *.hst file yet.
//--- input parameter
input ENUM_OFF_TIMEFRAMES  ExtOffPeriod=M6;
//---
bool     first_start=true;    // true -> it's first start
bool     crash=false;         // false -> error in the code
The algorithm of the OnCalculate() function of our indicator:
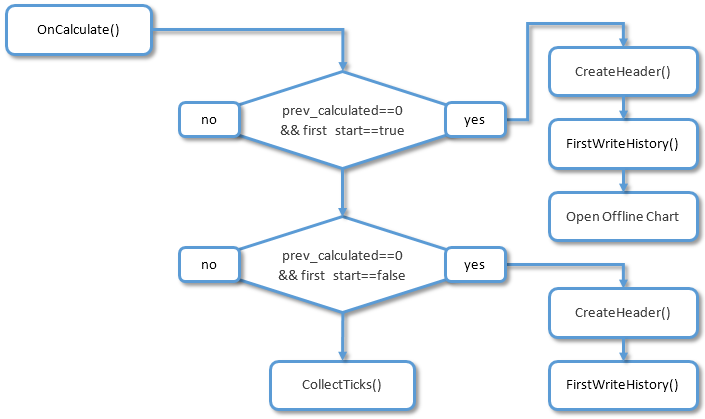
Fig. 1. The algorithm of the OnCalculate() function
The final version of the indicator can be found in the IndCreateOffline.mq4 file.
2. Starting the indicator on the offline chart
2.1. Updating the offline chart with ChartSetSymbolPeriod()
Important: for updating the offline chart instead of ChartRedraw(), ChartSetSymbolPeriod() with current parameters should be called. Calling ChartSetSymbolPeriod() is performed in the CollectTicks() function with an interval of no more than once every three seconds.
One more nuance should be considered: the indicator attached to the offline chart will receive prev_calculated==0 in its OnCalculate() function upon each update. This will have to be remembered. A method that considers such specifics is explained below.
What we want to obtain: the same indicator must operate on both online and offline charts. The indicator's behavior changes according to what chart is used. When the indicator is on the online chart, then its functionality resembles the IndCreateOffline.mq4 indicator that we have considered above. However, on the offline chart it starts operating as a standard indicator.
So, we shall call our indicator IndMACDDoubleDuty — it will be created based on the above mentioned IndCreateOffline.mq4 and the standard indicator MACD.mq4. Please prepare a draft of a future indicator: open the IndCreateOffline.mq4 file in MetaEditor, select "File" -> "Save as..." and enter the indicator's name — IndMACDDoubleDuty.mq4.
The indicator description shall be added at once — our indicator now creates offline charts and has a double value:
//+------------------------------------------------------------------+
//|                                            IndMACDDoubleDuty.mq4 |
//|                        Copyright 2016, MetaQuotes Software Corp. |
//|                                             https://www.mql5.com |
//+------------------------------------------------------------------+
#property copyright "Copyright 2016, MetaQuotes Software Corp."
#property link      "https://www.mql5.com"
#property version   "1.00"
#property description "The indicator creates an offline chart."
#property description "May work on an online chart and off-line graph."
#property strict
#property indicator_chart_window
The indicator will operate in the maintenance mode if it was started on the online chart with the PERIOD_M1 period. In this mode, it performs the following functions:
- creates and fills the *.hst file;
- opens the offline chart based on the *.hst file;
- adds history to the *.hst file and updates the offline chart upon the arrival of quotes.
//--- input parameter
input ENUM_OFF_TIMEFRAMES  ExtOffPeriod=M6;
//---
bool     first_start=true;    // true -> it's first start
bool     crash=false;         // false -> error in the code
bool     mode_offline=true;   // true -> on the offline chart
int      HandleHistory=-1;    // handle for the opened "*.hst" file
datetime time0;               //
Accordingly, OnInit() will slightly change:
int OnInit()
  {
   mode_offline=IsOffline(ChartID());
   if(!mode_offline && Period()!=PERIOD_M1)
     {
      Print("The period on the online chart must be \"M1\"!");
      crash=true;
     }
//---
   return(INIT_SUCCEEDED);
  }
Making changes to OnCalculate():
//+------------------------------------------------------------------+
//| Custom indicator iteration function                              |
//+------------------------------------------------------------------+
int OnCalculate(const int rates_total,
                const int prev_calculated,
                const datetime &time[],
                const double &open[],
                const double &high[],
                const double &low[],
                const double &close[],
                const long &tick_volume[],
                const long &volume[],
                const int &spread[])
  {
//---
   if(crash)
      return(rates_total);

   if(!mode_offline) // work in the online chart
     {
      if(prev_calculated==0 && first_start) // first start
        {
         .
         .
         .
         first_start=false;
        }
      //---
      CollectTicks();
     }
//--- return value of prev_calculated for next call
   return(rates_total);
  }
At this stage, when the indicator is attached to the online chart with the PERIOD_M1 period, it switches to the maintenance mode and creates an offline chart.
Changes of the indicator described above can be found in the IndMACDDoubleDutyStep1.mq4 file.
2.3. Copying the indicator to the offline chart
We will add new functionality to the IndMACDDoubleDuty indicator. Now, while operating in the maintenance mode, the indicator must transfer its copy to the created offline chart. The following functions ChartSaveTemplate and ChartApplyTemplate will be used to assist with this. The OnCalcalculate() algorithm will look as follows:
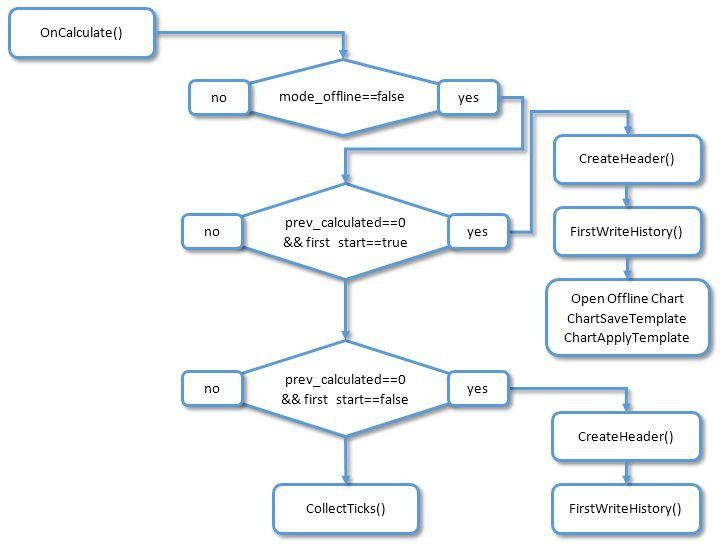
Fig. 2. Algorithm of the OnCalculate() function
Let's add additional functionality to the OnCalculate() code:
         else
            Print(__FUNCTION__,"Opening offline chart id=",ChartOffID);
         ResetLastError();
         if(!ChartSaveTemplate(0,"IndMACDDoubleDuty"))
           {
            Print("Error save template: ",GetLastError());
            first_start=false;
            crash=true;
            return(rates_total);
           }
         ResetLastError();
         if(!ChartApplyTemplate(ChartOffID,"IndMACDDoubleDuty"))
           {
            Print("Error apply template: ",GetLastError());
            first_start=false;
            crash=true;
            return(rates_total);
           }
        }
      //---
      if(prev_calculated==0 && !first_start) // a deeper history downloaded or history blanks filled
After being placed on the online chart with the PERIOD_M1 period, our indicator switches to the maintenance mode, creates an offline chart and copies itself there.
Changes of the indicator described above can be found in the IndMACDDoubleDutyStep2.mq4 file.
Our indicator already places itself on the offline chart, but doesn't display or count anything yet. We will change this: let's integrate our indicator to the standard MACD.mq4.
First, we will place input parameters of the MACD.mq4 indicator to our code:
#property strict

#include <MovingAverages.mqh>

//--- MACD indicator settings
#property  indicator_separate_window
#property  indicator_buffers 2
#property  indicator_color1  Silver
#property  indicator_color2  Red
#property  indicator_width1  2
//--- indicator parameters
input int InpFastEMA=12;   // Fast EMA Period
input int InpSlowEMA=26;   // Slow EMA Period
input int InpSignalSMA=9;  // Signal SMA Period
//--- indicator buffers
double    ExtMacdBuffer[];
double    ExtSignalBuffer[];
//--- right input parameters flag
bool      ExtParameters=false;
//+------------------------------------------------------------------+
//| Enumerations of periods offline chart                            |
//+------------------------------------------------------------------+
Then we add the code to OnInit(). It should be noted here, that parameter initialization of the MACD indicator must be performed in any conditions — both offline and online charts, even when the online chart is different from the PERIOD_M1 period:
int OnInit()
  {
   mode_offline=IsOffline(ChartID());
   if(!mode_offline && Period()!=PERIOD_M1)
     {
      Print("The period on the online chart must be \"M1\"!");
      crash=true;
     }
//--- init MACD indicator
   IndicatorDigits(Digits+1);
//--- drawing settings
   SetIndexStyle(0,DRAW_HISTOGRAM);
   SetIndexStyle(1,DRAW_LINE);
   SetIndexDrawBegin(1,InpSignalSMA);
//--- indicator buffers mapping
   SetIndexBuffer(0,ExtMacdBuffer);
   SetIndexBuffer(1,ExtSignalBuffer);
//--- name for DataWindow and indicator subwindow label
   IndicatorShortName("MACD("+IntegerToString(InpFastEMA)+","+IntegerToString(InpSlowEMA)+","+IntegerToString(InpSignalSMA)+")");
   SetIndexLabel(0,"MACD");
   SetIndexLabel(1,"Signal");
//--- check for input parameters
   if(InpFastEMA<=1 || InpSlowEMA<=1 || InpSignalSMA<=1 || InpFastEMA>=InpSlowEMA)
     {
      Print("Wrong input parameters");
      ExtParameters=false;
      return(INIT_FAILED);
     }
   else
      ExtParameters=true;
//---
   return(INIT_SUCCEEDED);
  }
The next step involves slightly changing the code in the beginning of OnCalculate(). If we are on the online chart and its period doesn't equal PERIOD_M1, we should allow an opportunity for calculating MACD parameters. What it was:
const long &volume[],
                const int &spread[])
  {
//---
   if(crash)
      return(rates_total);

   if(!mode_offline) // work in the online chart
     {
      if(prev_calculated==0 && first_start) // first start
        {
and what it will be:
const long &volume[],
                const int &spread[])
  {
//---
   if(!mode_offline && !crash) // work in the online chart
     {
      if(prev_calculated==0 && first_start) // first start
        {
Then we will add the code for calculating parameters of the MACD indicator towards the end of OnCalculate():
         FirstWriteHistory(ExtOffPeriod);
         first_start=false;
        }
      //---
      CollectTicks();
     }
//---
   int i,limit;
//---
   if(rates_total<=InpSignalSMA || !ExtParameters)
      return(0);
//--- last counted bar will be recounted
   limit=rates_total-prev_calculated;
   if(prev_calculated>0)
      limit++;
//--- macd counted in the 1-st buffer
   for(i=0; i<limit; i++)
      ExtMacdBuffer[i]=iMA(NULL,0,InpFastEMA,0,MODE_EMA,PRICE_CLOSE,i)-
                       iMA(NULL,0,InpSlowEMA,0,MODE_EMA,PRICE_CLOSE,i);
//--- signal line counted in the 2-nd buffer
   SimpleMAOnBuffer(rates_total,prev_calculated,0,InpSignalSMA,ExtMacdBuffer,ExtSignalBuffer);
//--- return value of prev_calculated for next call
   return(rates_total);
  }
2.5. Economical indicator recalculation on the offline chart
Let me remind you a point described earlier in section 2:
One more nuance should be considered: the indicator attached to the offline chart will receive prev_calculated==0 in its OnCalculate() function upon each update. This will have to be remembered. A method that considers such specifics is explained below.
And one more reminder: the prev_calculated==0 value in OnCalculate() can indicate two situations:
- either this is a first start of the indicator;
- or history was downloaded.
In both cases the indicator must recalculate all bars on the chart. When this should be done only once (when loading) — it is normal. But on the offline chart we will be getting prev_calculated==0 upon every update (approximately once in 2-3 seconds), and the indicator will recalculate all bars. This requires high consumption of resources. Therefore, we will use one trick: when the indicator is on the offline chart, it will store and compare the total of bars (rates_total variable) and the time of the rightmost bar on the chart.
Step 1: At the start of OnCalculate() we will declare two static variables and one pseudo variable:
                const long &volume[],
                const int &spread[])
  {
//---
   static int static_rates_total=0;
   static datetime static_time_close=0;
   int pseudo_prev_calculated=prev_calculated;
//---
   if(!mode_offline && !crash) // work in the online chart
     {
Step 2: We will change prev_calculated variable to pseudo_prev_calculated in the code block of calculating indicator values:
      CollectTicks();
     }
//---
   int i,limit;
//---
   if(rates_total<=InpSignalSMA || !ExtParameters)
      return(0);
//--- last counted bar will be recounted
   limit=rates_total-pseudo_prev_calculated;
   if(pseudo_prev_calculated>0)
      limit++;
//--- macd counted in the 1-st buffer
   for(i=0; i<limit; i++)
      ExtMacdBuffer[i]=iMA(NULL,0,InpFastEMA,0,MODE_EMA,PRICE_CLOSE,i)-
                       iMA(NULL,0,InpSlowEMA,0,MODE_EMA,PRICE_CLOSE,i);
//--- signal line counted in the 2-nd buffer
   SimpleMAOnBuffer(rates_total,pseudo_prev_calculated,0,InpSignalSMA,ExtMacdBuffer,ExtSignalBuffer);
//---
   if(mode_offline) // work in the offline chart
Step 3: We will calculate value for the pseudo variable, if the indicator operates on the offline chart.
      CollectTicks();
     }
//---
   if(mode_offline) // work in the offline chart
     {
      if(time[0]>static_time_close) // new bar
        {
         if(static_time_close==0)
            pseudo_prev_calculated=0;
         else // search bar at which time[0]==static_time_close
           {
            for(int i=0;i<rates_total;i++)
              {
               if(time[i]==static_time_close)
                 {
                  pseudo_prev_calculated=rates_total-i;
                  break;
                 }
              }
           }
        }
      else
        {
         pseudo_prev_calculated=rates_total;
        }
      //---
      static_rates_total=rates_total;
      static_time_close=time[0];
     }
//---
   int i,limit;
Our indicator on the offline chart calculates its values economically now. Furthermore, it correctly handles disconnection in this mode: only newly added bars are calculated after disconnection.
2.6. Loading data. Offline chart
Now we just have to figure out what to do, if the history was downloaded on the online chart with our indicator (where prev_calculated==0). I propose to resolve the situation through global variables of the terminal. The operation algorithm is the following: if we receive prev_calculated==0 on the online chart (it doesn't matter if it was the first launch or downloading history), we just create a global variable. The indicator on the offline chart checks for a global variable upon every update: if there is one (it means that the online chart had prev_calculated==0), then the indicator will be fully recalculated and it will delete the global variable.
We will add the variable to the indicator header, where the name of the future global variable of the terminal will be stored, and generate this name in OnInit():
MqlRates rate;                //
long     ChartOffID=-1;       // ID of the offline chart
string   NameGlVariable="";   // name global variable
//+------------------------------------------------------------------+
//| Custom indicator initialization function                         |
//+------------------------------------------------------------------+
int OnInit()
  {
   mode_offline=IsOffline(ChartID());
   if(!mode_offline && Period()!=PERIOD_M1)
     {
      Print("The period on the online chart must be \"M1\"!");
      crash=true;
     }
   NameGlVariable=Symbol()+(string)ExtOffPeriod;
//--- init MACD indicator
   IndicatorDigits(Digits+1);
//--- drawing settings
We will add the code of creating a global variable of the terminal, if the prev_calculated==0 condition is met, and the indicator is on the online chart:
         if(!ChartApplyTemplate(ChartOffID,"IndMACDDoubleDuty"))
           {
            Print("Error apply template: ",GetLastError());
            first_start=false;
            crash=true;
            return(rates_total);
           }
         //---
         ResetLastError();
         if(GlobalVariableSet(NameGlVariable,0.0)==0) // creates a new global variable
           {
            Print("Failed to creates a new global variable ",GetLastError());
           }
        }
      //---
      if(prev_calculated==0 && !first_start) // a deeper history downloaded or history blanks filled
        {
         Print("a deeper history downloaded or history blanks filled. first_start=",first_start);
         if(CreateHeader(ExtOffPeriod))
            first_start=false;
         else
           {
            crash=true;
            return(rates_total);
           }
         //---
         FirstWriteHistory(ExtOffPeriod);
         first_start=false;
         //---
         ResetLastError();
         if(GlobalVariableSet(NameGlVariable,0.0)==0) // creates a new global variable
           {
            Print("Failed to creates a new global variable ",GetLastError());
           }
        }
      //---
      CollectTicks();
And the last change: checking for a global variable from the indicator on the offline chart:
      else
        {
         pseudo_prev_calculated=rates_total;
        }
      //---
      if(GlobalVariableCheck(NameGlVariable))
        {
         pseudo_prev_calculated=0;
         GlobalVariableDel(NameGlVariable);
        }
      //---
      Print("rates_total=",rates_total,"; prev_calculated=",
            prev_calculated,"; pseudo_prev_calculated=",pseudo_prev_calculated);
      static_rates_total=rates_total;
      static_time_close=time[0];
     }
//---
   int i,limit;
Final indicator version with last changes: IndMACDDoubleDuty.mq4.
3. Indicator displaying Renko bars
Renko bars will be placed using the same technology used in points 1. "IndCreateOffline" indicator that will create an offline chart and 2. Starting indicator on the offline chart. Eventually, we obtain an offline chart, but only in this case, the *.hst history file will contain the same size bars, also called bricks. The size of bricks is set in indicator settings and is measured in points.

Fig. 3. Renko bars
Before we start, few rules of forming the *.hst history file for plotting Renko bars should be considered.
3.1. Rules of plotting Range bars
Rule 1: writing OHLC in the *.hst history file must be correct, especially when it refers to High and Low values. Otherwise, the terminal will not display the incorrect log. Example of correct and incorrect writing of the bullish bar to the *.hst history file:
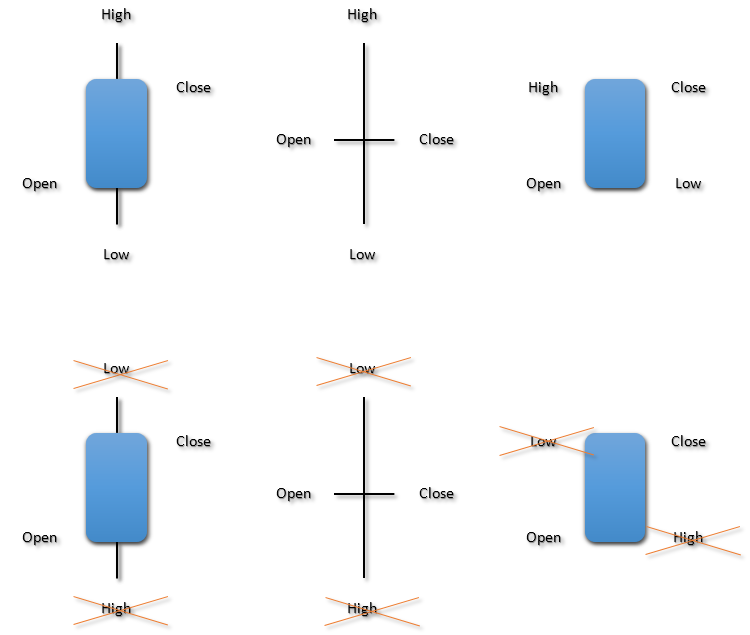
Fig. 4. Examples of correct and incorrect log
Rule 2: even though we create Range bars that don't have a time anchor, the format of *.hst history file requires the time parameter — the time of period start. Therefore it is compulsory to write the time parameter.
Rule 3: the time parameter should be different for all bars. If you write the same parameter for all time bars, then this log will not be correct and the terminal will not display the chart. There is one appealing feature here: the time parameter can be written within one second. For example, we will write one bar with parameters time=2016.02.10 09:08:00, and the following bar with parameters time=2016.02.10 09:08:01.
3.2. Forming bricks on historical data
This method is not supposed to be a flawless algorithm. I have used a simplified approach because the main purpose of this article is to show how to form the *.hst history file. In the "IndRange.mq4" indicator High[i] and Low[i] values of the current period are analyzed when drawing bricks based on history. So if the "IndRange.mq4" indicator is attached to the chart with M5 period, then the "IndRange.mq4" indicator will analyze history within the current period M5 at the first launch.
Certainly, if you wish you can modernize the drawing algorithm based on history, and consider price movement at the lowest time frame — М1. The general scheme of operation is:
- if High[i] is higher than high of the previous brick by the brick size, then one or more bricks are drawn above the previous brick;
- if Low[i] is lower than low of the previous brick by the brick size, then one or more bricks are drawn above the previous brick.
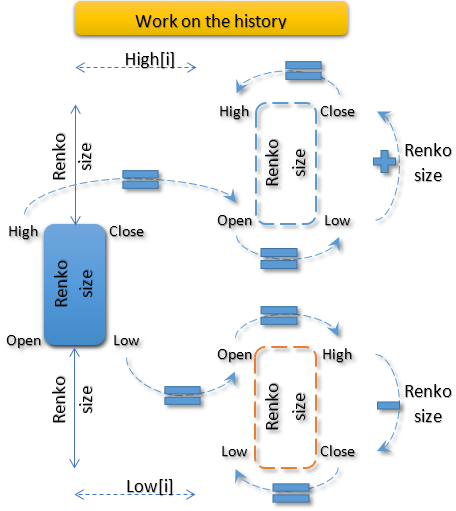
Fig. 5. The previous brick is bullish
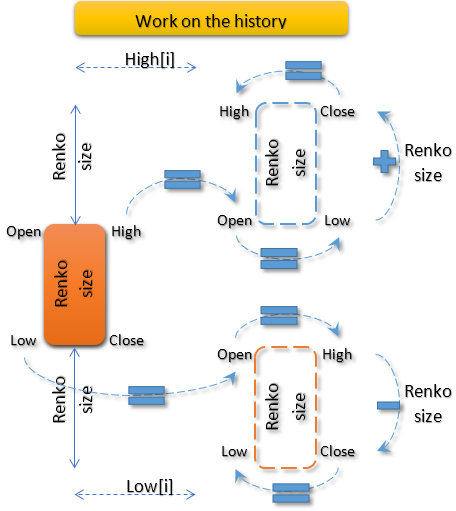
Fig. 6. The previous brick is bearish
Interesting: coordinates of bars (Open, High, Low, Close, Time and volumes) are stored in the rate structure that is declared in the indicator header
MqlRates rate; //
and this structure doesn't get zeroed, but is simply rewritten in the *.hst history file at every logging. Due to this, it is easy to implement algorithms shown in fig. 5 and fig. 6., and the general formula can be given:
- when High[i] is higher than high of the previous brick (it makes no difference if it was bullish or bearish) by the brick size, coordinates of a new bar are calculated accordingly:
Open = High; Low = Open; Close = Low + Renko size; High = Close
- when Low[i] is lower than low of the previous brick (and it makes no difference if it was bullish or bearish) by the brick size, coordinates of a new bar are calculated accordingly:
Low = Open; High = Open; Close = High - Renko size; Low = Close
And this is how these formulas appear in the "IndRange.mq4" indicator, in the FirstWriteHistory() function:
//+------------------------------------------------------------------+
//| First Write History                                              |
//+------------------------------------------------------------------+
bool FirstWriteHistory(const int offline_period)
  {
   int      i,start_pos;
   int      cnt=0;
//--- write history file
   periodseconds=offline_period*60;
   start_pos=Bars-1;
   rate.open=Open[start_pos];
   rate.close=Close[start_pos];
   rate.low=Low[start_pos];
   rate.high=High[start_pos];
   rate.tick_volume=(long)Volume[start_pos];
   rate.spread=0;
   rate.real_volume=0;
//--- normalize open time
   rate.time=D'1980.07.19 12:30:27';
   for(i=start_pos-1; i>=0; i--)
     {
      if(IsStopped())
         break;
      while((High[i]-rate.high)>SizeRenko*Point())
        {
         rate.time+=1;
         rate.open=rate.high;
         rate.low=rate.open;
         rate.close=NormalizeDouble(rate.low+SizeRenko*Point(),Digits);
         rate.high=rate.close;
         last_fpos=FileTell(HandleHistory);
         uint byteswritten=FileWriteStruct(HandleHistory,rate);
         //--- check the number of bytes written
         if(byteswritten==0)
            PrintFormat("Error read data. Error code=%d",GetLastError());
         else
            cnt++;
        }
      while((Low[i]-rate.low)<-SizeRenko*Point())
        {
         rate.time+=1;
         rate.open=rate.low;
         rate.high=rate.open;
         rate.close=NormalizeDouble(rate.high-SizeRenko*Point(),Digits);
         rate.low=rate.close;
         last_fpos=FileTell(HandleHistory);
         uint byteswritten=FileWriteStruct(HandleHistory,rate);
         //--- check the number of bytes written
         if(byteswritten==0)
            PrintFormat("Error read data. Error code=%d",GetLastError());
         else
            cnt++;
        }
     }
   FileFlush(HandleHistory);
   PrintFormat("%d record(s) written",cnt);
   return(true);
  }
The "IndRange.mq4" indicator always forms the name of the *.hst history file according to the following rule: "Current symbol name"+"7"+".hst". For example, for "EURUSD", history file will have a name "EURUSD7.hst".
3.3. Indicator operating online
When the indicator operates online, the Close[0] price for closing on the zero (rightmost) bar should be analyzed instead of the High[i] price:
//+------------------------------------------------------------------+
//| Collect Ticks                                                    |
//+------------------------------------------------------------------+
bool CollectTicks()
  {
   static datetime last_time;//=TimeLocal()-5;
   long     chart_id=0;
   datetime cur_time=TimeLocal();
//---
   while((Close[0]-rate.high)>SizeRenko*Point())
     {
      rate.time+=1;
      rate.open=rate.high;
      rate.low=rate.open;
      rate.close=NormalizeDouble(rate.low+SizeRenko*Point(),Digits);
      rate.high=rate.close;
      last_fpos=FileTell(HandleHistory);
      uint byteswritten=FileWriteStruct(HandleHistory,rate);
      //--- check the number of bytes written
      if(byteswritten==0)
         PrintFormat("Error read data. Error code=%d",GetLastError());
     }
   while((Close[0]-rate.low)<-SizeRenko*Point())
     {
      rate.time+=1;
      rate.open=rate.low;
      rate.high=rate.open;
      rate.close=NormalizeDouble(rate.high-SizeRenko*Point(),Digits);
      rate.low=rate.close;
      last_fpos=FileTell(HandleHistory);
      uint byteswritten=FileWriteStruct(HandleHistory,rate);
      //--- check the number of bytes written
      if(byteswritten==0)
         PrintFormat("Error read data. Error code=%d",GetLastError());
     }
//--- refresh window not frequently than 1 time in 2 seconds
   if(cur_time-last_time>=3)
     {
      FileFlush(HandleHistory);
      ChartSetSymbolPeriod(ChartOffID,Symbol(),i_period);
      last_time=cur_time;
     }
   return(true);
  }
4. Indicator that creates a non-standard symbol — USDx dollar index
Important remarks regarding the algorithm of the "IndUSDx.mq4" indicator: the dollar index indicator doesn't imply the absolute correctness of the index calculation formula. It is more important for us to show how to form the *.hst history file using a non-standard symbol. As a result, we will get an offline chart, and its bars will display the calculated dollar index. The "IndUSDx.mq4" indicator also creates an offline chart just once: either when first connecting indicator to a chart, or after changing the chart period.
The formula for calculating the dollar index and the symbol set is taken based on the code: Simple dollar index indicator.
Time, Open and Close data for "EURUSD", "GBPUSD", "USDCHF", "USDJPY", "AUDUSD", "USDCAD" and "NZDUSD" must be obtained for the formula of calculating the dollar index. For the ease of saving and referring to data, the OHLS structure was introduced (it is declared in the indicator header):
//--- structuts
struct   OHLS
  {
   datetime          ohls_time[];
   double            ohls_open[];
   double            ohls_close[];
  };
In the OHLS structure, the arrays for storing Time, Open and Clos are used as elements. Under description of structure, few objects are instantly declared — OHLS structure that will be used for storing data of calculated symbols:
//--- structuts
struct   OHLS
  {
   datetime          ohls_time[];
   double            ohls_open[];
   double            ohls_close[];
  };
OHLS     OHLS_EURUSD,OHLS_GBPUSD,OHLS_USDCHF,OHLS_USDJPY,OHLS_AUDUSD,OHLS_USDCAD,OHLS_NZDUSD;
//+------------------------------------------------------------------+
//| Custom indicator initialization function                         |
//+------------------------------------------------------------------+
int OnInit()
The SelectSymbols() function is called in OnInit():
//+------------------------------------------------------------------+
//| Select Symbols                                                   |
//+------------------------------------------------------------------+
bool SelectSymbols()
  {
   bool rezult=true;
   string arr_symbols[7]={"EURUSD","GBPUSD","USDCHF","USDJPY","AUDUSD","USDCAD","NZDUSD"};
   for(int i=0;i<ArraySize(arr_symbols);i++)
      rezult+=SymbolSelect(arr_symbols[i],true);
//---
   return(rezult);
  }
The SelectSymbols() function with the help of SymbolSelect selects symbols that participate in the dollar index formula in the MarketWatch window.
In OnCalculate(), the CopyCloseSymbols() function is called at the first launch. Data on calculated symbols are requested and symbol structures are filled here:
//+------------------------------------------------------------------+
//| CopyClose Symbols                                                |
//+------------------------------------------------------------------+
bool CopyCloseSymbols(const int rates)
  {
   int copied=0;
   int copy_time=0,copy_open=0,copy_close=0;
   copy_time=CopyTime("EURUSD",Period(),0,rates,OHLS_EURUSD.ohls_time);
   copy_open=CopyOpen("EURUSD",Period(),0,rates,OHLS_EURUSD.ohls_open);
   copy_close=CopyClose("EURUSD",Period(),0,rates,OHLS_EURUSD.ohls_close);
   if(copy_open!=rates || copy_close!=rates || copy_time!=rates)
     {
      Print("Symbol \"EURUSD\". Get time ",copy_time,", get open ",copy_open,", get close ",copy_close," of ",rates);
      return(false);
     }

   copy_time=CopyTime("GBPUSD",Period(),0,rates,OHLS_EURUSD.ohls_time);
   copy_open=CopyOpen("GBPUSD",Period(),0,rates,OHLS_GBPUSD.ohls_open);
   copy_close=CopyClose("GBPUSD",Period(),0,rates,OHLS_GBPUSD.ohls_close);
   if(copy_open!=rates || copy_close!=rates || copy_time!=rates)
     {
      Print("Symbol \"GBPUSD\". Get time ",copy_time,", get open ",copy_open,", get close ",copy_close," of ",rates);
      return(false);
     }

   copy_time=CopyTime("USDCHF",Period(),0,rates,OHLS_EURUSD.ohls_time);
   copy_open=CopyOpen("USDCHF",Period(),0,rates,OHLS_USDCHF.ohls_open);
   copy_close=CopyClose("USDCHF",Period(),0,rates,OHLS_USDCHF.ohls_close);
   if(copy_open!=rates || copy_close!=rates || copy_time!=rates)
     {
      Print("Symbol \"USDCHF\". Get time ",copy_time,", get open ",copy_open,", get close ",copy_close," of ",rates);
      return(false);
     }

   copy_time=CopyTime("USDJPY",Period(),0,rates,OHLS_EURUSD.ohls_time);
   copy_open=CopyOpen("USDJPY",Period(),0,rates,OHLS_USDJPY.ohls_open);
   copy_close=CopyClose("USDJPY",Period(),0,rates,OHLS_USDJPY.ohls_close);
   if(copy_open!=rates || copy_close!=rates || copy_time!=rates)
     {
      Print("Symbol \"USDJPY\". Get time ",copy_time,", get open ",copy_open,", get close ",copy_close," of ",rates);
      return(false);
     }

   copy_time=CopyTime("AUDUSD",Period(),0,rates,OHLS_EURUSD.ohls_time);
   copy_open=CopyOpen("AUDUSD",Period(),0,rates,OHLS_AUDUSD.ohls_open);
   copy_close=CopyClose("AUDUSD",Period(),0,rates,OHLS_AUDUSD.ohls_close);
   if(copy_open!=rates || copy_close!=rates || copy_time!=rates)
     {
      Print("Symbol \"AUDUSD\". Get time ",copy_time,", get open ",copy_open,", get close ",copy_close," of ",rates);
      return(false);
     }

   copy_time=CopyTime("USDCAD",Period(),0,rates,OHLS_EURUSD.ohls_time);
   copy_open=CopyOpen("USDCAD",Period(),0,rates,OHLS_USDCAD.ohls_open);
   copy_close=CopyClose("USDCAD",Period(),0,rates,OHLS_USDCAD.ohls_close);
   if(copy_open!=rates || copy_close!=rates || copy_time!=rates)
     {
      Print("Symbol \"USDCAD\". Get time ",copy_time,", get open ",copy_open,", get close ",copy_close," of ",rates);
      return(false);
     }

   copy_time=CopyTime("NZDUSD",Period(),0,rates,OHLS_EURUSD.ohls_time);
   copy_open=CopyOpen("NZDUSD",Period(),0,rates,OHLS_NZDUSD.ohls_open);
   copy_close=CopyClose("NZDUSD",Period(),0,rates,OHLS_NZDUSD.ohls_close);
   if(copy_open!=rates || copy_close!=rates || copy_time!=rates)
     {
      Print("Symbol \"NZDUSD\". Get time ",copy_time,", get open ",copy_open,", get close ",copy_close," of ",rates);
      return(false);
     }
//---
   return(true);
  }
If the symbol history is downloaded less than the given value in the CopyCloseSymbols() function, then a message with the symbol name and actual value of the downloaded symbol history is displayed.
In case of successful filling of structures, the main functionality — FirstWriteHistory() function that fills the *.hst file with history is called:
//+------------------------------------------------------------------+
//| First Write History                                              |
//+------------------------------------------------------------------+
bool FirstWriteHistory(const int rates)
  {
   int      i;
   int      cnt=0;
   rate.tick_volume=0;
   rate.spread=0;
   rate.real_volume=0;
   for(i=0;i<rates;i++)
     {
      rate.time=OHLS_EURUSD.ohls_time[i];
      rate.open=(100*MathPow(OHLS_EURUSD.ohls_open[i],0.125)+100*MathPow(OHLS_GBPUSD.ohls_open[i],0.125)+
                 100*MathPow(OHLS_USDCHF.ohls_open[i],0.125)+100*MathPow(OHLS_USDJPY.ohls_open[i],0.125)+
                 100*MathPow(OHLS_AUDUSD.ohls_open[i],0.125)+100*MathPow(OHLS_USDCAD.ohls_open[i],0.125)+
                 100*MathPow(OHLS_NZDUSD.ohls_open[i],0.125))/8.0;

      rate.close=(100*MathPow(OHLS_EURUSD.ohls_close[i],0.125)+100*MathPow(OHLS_GBPUSD.ohls_close[i],0.125)+
                  100*MathPow(OHLS_USDCHF.ohls_close[i],0.125)+100*MathPow(OHLS_USDJPY.ohls_close[i],0.125)+
                  100*MathPow(OHLS_AUDUSD.ohls_close[i],0.125)+100*MathPow(OHLS_USDCAD.ohls_close[i],0.125)+
                  100*MathPow(OHLS_NZDUSD.ohls_close[i],0.125))/8.0;

      if(rate.open>rate.close)
        {
         rate.high=rate.open;
         rate.low=rate.close;
        }
      else
        {
         rate.high=rate.close;
         rate.low=rate.open;
        }
      last_fpos=FileTell(HandleHistory);
      uint byteswritten=FileWriteStruct(HandleHistory,rate);
      //--- check the number of bytes written
      if(byteswritten==0)
         PrintFormat("Error read data. Error code=%d",GetLastError());
      else
         cnt++;
     }
   FileFlush(HandleHistory);
   PrintFormat("%d record(s) written",cnt);
   return(true);
  }
Operation result of the "IndUSDx.mq4" indicator:
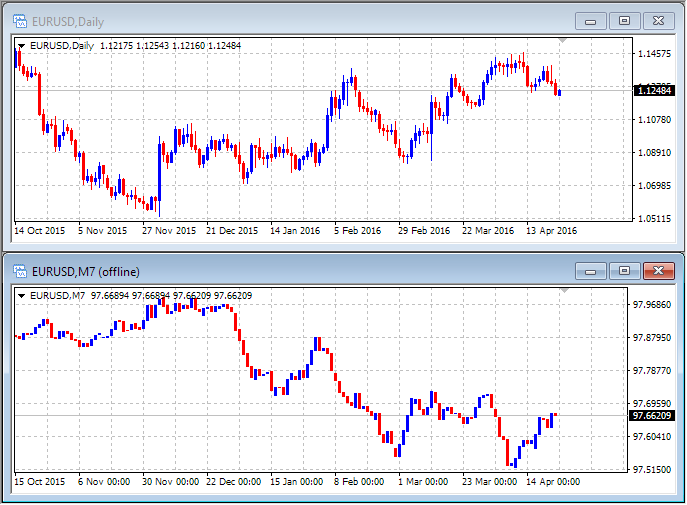
Fig. 7. "IndUSDx.mq4 indicator
Conclusion
It turns out that both offline and online charts can be used for economical recalculation of indicators. However, for this purpose changes to the indicator code must be entered with consideration of specifics in updating the offline chart, i.e. it should be considered that all indicators receive prev_calculate==0 value in OnCalculate() upon the update of offline charts.
The article also shows how to form the *.hst history file and use it to completely change parameters of the bars displayed on charts.
Translated from Russian by MetaQuotes Ltd.
Original article: https://www.mql5.com/ru/articles/2297
 Universal Expert Advisor: Pending Orders and Hedging Support (Part 5)
 Graphical Interfaces VI: the Checkbox Control, the Edit Control and their Mixed Types (Chapter 1)
 Self-organizing feature maps (Kohonen maps) - revisiting the subject
- Free trading apps
- Over 8,000 signals for copying
- Economic news for exploring financial markets
You agree to website policy and terms of use