
Trading Ideas Based on Prices Direction and Movement Speed

Introduction
It has long been known that when a price moves all liquid markets reveal some sort of wave cyclical nature first going up and then going down. It is clearly seen on charts of higher timeframes. Sinusoidal nature is a reflection of the fact that the price has certain persistence. Otherwise it would look like a zigzag: abrupt upward and downward movements within short periods of time. Let us try to find out reasons of this phenomenon and ways of employment it in trading.
Movement Beginning and Persistence
Any movement in our world can be characterized by its direction, acceleration and speed. It works in liquid markets as well. This implies one important rule which says that never a one strong directed movement of the price can harshly end. It can be compared with a train: when a whole train set brakes at its full speed, its brake way can be up to one kilometer.
So when does a trend begin? When majority of market participants change their opinion to the contrary for some reasons whether it pertains to global change in direction or change in some important factors influencing on the market or news. With that a considered collective opinion is formed and the trend begins. Market participants have increasing belief that movement is becoming stronger and will go on further. It has a direction, acceleration and a certain speed because big players enter the market with large positions. This is where those, who entered at the beginning of the movement and gave it an impulse and speed, start gaining profit. Other traders enter the market later and with less attractive price. But unlike the first traders, they try to use the price movement direction.
The trend ends when changes occur. But why is the price still moving in the same way? Why doesn't it change abruptly? The reason of such behavior is that those, who were accelerating and pushing the price in the desired direction, start closing their positions and thereby suppress the trend. And those, who were just "riding the wave", still believe that nothing has changed and even try to move the price. But this "train" does not just stop. It starts moving in the opposite direction and here the story ends.
Trading Idea and How not to Get Run Over by the "Train"
The idea of using the movement and gaining profit is based on the analysis of the current trend depth, i.e. its size and duration.
To provide a vivid example we use standard indicators: RSI (Relative Strength Index) and AC (Acceleration/Deceleration).
1. Conditions for entering the market
We will use the first indicator to demonstrate how far and deep the price has currently moved.
We will place levels to determine a distance and a depth:
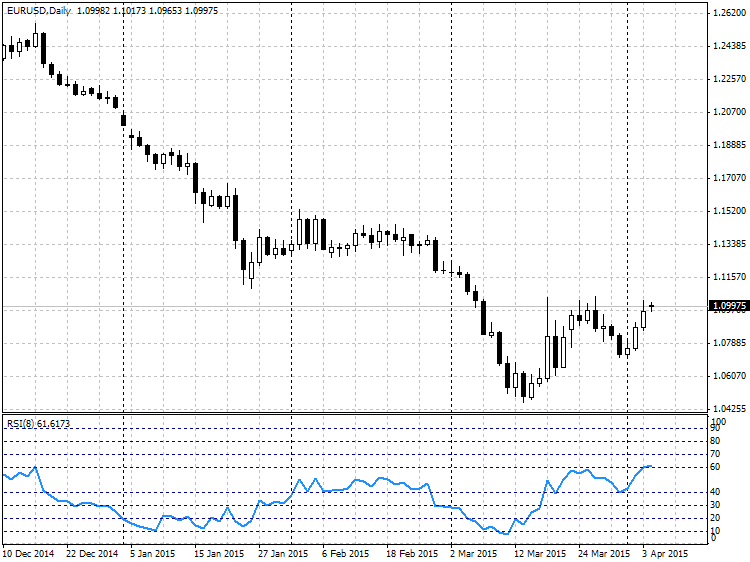
Fig. 1. RSI oscillator levels
The price movement depth evaluation criteria:
- An area between levels 40 - 60 is considered to be a flat zone (sideway zone). There isn't any trend when the price is in this zone. Let us assign index 0 to the absence of a directed movement.
Buy price movement zones:
- Zone 60-70 - this is a possible beginning of the upward movement. Let us assign index 1 to this movement.
- Zone 70-80 - the upward movement is more distinct. The movement gathers speed. Assign index 2.
- Zone 80-90 - the movement has stable direction. Speed is gathered. Assign index 3.
- Zone 90-100. As a rule this is a strong one-way movement which does not have pullbacks. Very rare. Its movement index will be 4.
Let us similarly index sell prices:
- Zone 30-40. The movement starts going down. Index -1.
- Zone 20-30. The movement gathers speed. Index -2.
- Zone 10-20. Stable downward direction. Index -3.
- Zone 0-10. Strong one-way movement zone. Index -4.
We can describe this condition in the MQL4 language as follows:
//--- determining buy index
   double rsi=iRSI(Symbol(),tf,period,PRICE_CLOSE,0);
   index_rsi = 0;
   if(rsi>90.0) index_rsi=4;
   else if( rsi > 80.0 )
   index_rsi = 3;
   else if( rsi > 70.0 )
   index_rsi = 2;
   else if( rsi > 60.0 )
   index_rsi = 1;
   else if( rsi < 10.0 )
   index_rsi = -4;
   else if( rsi < 20.0 )
   index_rsi = -3;
   else if( rsi < 30.0 )
   index_rsi = -2;
   else if( rsi < 40.0 )
   index_rsi = -1;
We will use Bill Williams' AC indicator for its intended purpose, namely we will measure speed and acceleration of the current movement.
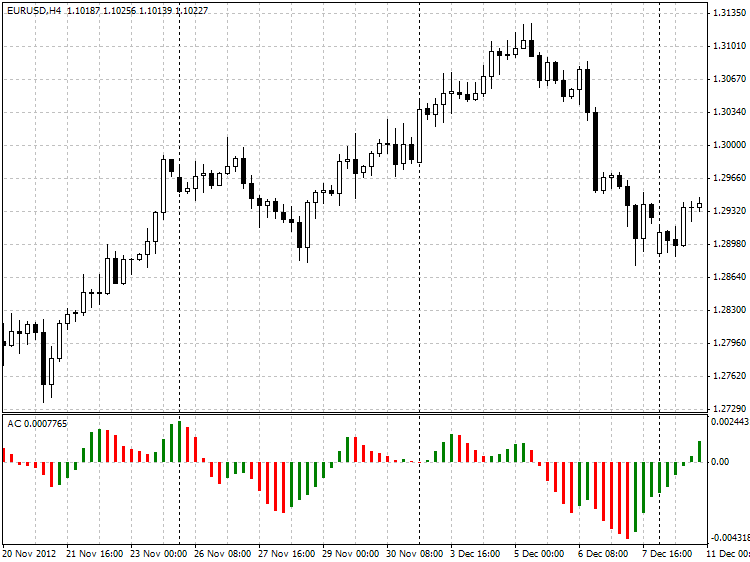
Fig. 2. AC indicator
Speed evaluation criteria:
Growth.
- The first criterion is comparison of the current and the previous histograms. If the current histogram exceeds the previous one, there is a probable acceleration of price growing. Let's define it as speed index equal to 1.
- The second criterion is comparison of 3 neighboring bars (from the zero bar to the second bar). We can speak about increasing acceleration if value of each subsequent bar exceeds value of the previous bar. Speed index will be equal to 2.
- There is a similar comparison of 4 bars to check if each previous bar is smaller then the subsequent one. Speed index is 3.
- Comparison of last 5 bars with due regard to the current one to check the same condition. Speed index is 4.
Fall.
- Likewise. Comparison of the current bar and the previous one. If the current bar is smaller than the previous one, the speed index is equal to -1.
- Comparison of 3 bars reduction from the previous to the current one. Index is -2.
- Comparison of 4 bars. Index is -3.
- Comparison of 5 bars. Index is -4.
In MQL4 that will look as follows:
double ac[];
   ArrayResize(ac,5);
   for(int i=0; i<5; i++)
      ac[i]=iAC(Symbol(),tf,i);

   index_ac=0;
//--- buy signal
   if(ac[0]>ac[1])
      index_ac=1;
   else if(ac[0]>ac[1] && ac[1]>ac[2])
      index_ac=2;
   else if(ac[0]>ac[1] && ac[1]>ac[2] && ac[2]>ac[3])
      index_ac=3;
   else if(ac[0]>ac[1] && ac[1]>ac[2] && ac[2]>ac[3] && ac[3]>ac[4])
      index_ac=4;
//--- sell signal
   else if(ac[0]<ac[1])
      index_ac=-1;
   else if(ac[0]<ac[1] && ac[1]<ac[2])
      index_ac=-2;
   else if(ac[0]<ac[1] && ac[1]<ac[2] && ac[2]<ac[3])
      index_ac=-3;
   else if(ac[0]<ac[1] && ac[1]<ac[2] && ac[2]<ac[3] && ac[3]<ac[4])
      index_ac=-4;
If we have movement depth indexes and know the movement speed, we can lay down and classify some entry conditions.
There are options of market entry:
//--- buy signal
if(index_rsi==1 && index_ac>=1) //possible buy movement
if(index_rsi==2 && index_ac>=1) //weak buy movement
if(index_rsi==3 && index_ac==1) //weak buy movement
if(index_rsi==3 && index_ac>=2) //moderate buy movement
if(index_rsi==4 && index_ac>=1) //strong buy movement

//--- sell signal
if(index_rsi==-1 && index_ac<=-1) //possible sell movement
if(index_rsi==-2 && index_ac<=-1) //weak sell movement
if(index_rsi==-3 && index_ac==-1) //weak sell movement
if(index_rsi==-3 && index_ac<=-2) //moderate sell movement
if(index_rsi==-4 && index_ac<=-1) //strong sell movement

//--- flat
if(index_rsi==0)
2. Conditions for exiting the market
We have defined and classified entry parameters. We will make the following analogy to explain how market exit conditions have been formed.
Think, for instance, of a children's rubber ball. And now let's think what will happen if someone throws this ball in water from a very high spot. First it will be falling and gathering speed due to gravitational acceleration. Then it bumps up against water. But it has enough speed to submerge at a certain depth loosing its speed and having a negative value. The ball is affected by the Archimedes' principle, so it is pushed to the surface.
Now we will drill down this example:
- As you have already understood, our ball is the price.
- A person throwing the ball represents market participants who started the trend.
- Gravity force which causes gravitational acceleration represents traders who have joined the price direction after the trend started.
- Water represents important factors influencing on change in direction.
- The Archimedes' principle represents closed positions of those who started the trend.
Two main goals to gain profit are as follows:
- Timely determine a moment when the ball has already been thrown and buy or sell.
- Close a position when the ball plunges into water and slows down.
It can be difficult to determine duration and the ball's exact distance of fall as we do not see a person throwing the ball nor water in financial markets. We can only see the ball's speed and direction.
We have reviewed the price movement depth and speed evaluation criteria above.
Now we will define exit conditions:
//--- possible downward reversal
if(index_rsi>2 && index_ac<0)
If the price was moving up long enough, its acceleration becomes negative (to the downside). This points to the fact that change in trend is quite possible.
//--- possible upward reversal
if(index_rsi<-2 && index_ac>0)
Similarly with the given example: the ball was falling for long enough, but it fell into water, and the water pushes the ball out in the opposite direction. It indicates the moment for closing positions.
3. Enhancement of entry and exit efficiency
It is known that some trading indicators get up their speed of response to the trend change when we use a larger period. But more false signals appear as well.
The alternative way is not to change the calculation period to the lower side but to track it on several timeframes.

Fig. 3. Trend on different timeframes based on RSI and AC signals
The price movement trend can be clearly seen in the figure due to our criteria and RSI and AC indicators. Let's take a detailed look into it.
Movement and speed on M1: strong movement, AC index is 4, RSI index depth is 2. M5 has the same depth but the speed equals to 1. The same movement is determined on M15 but it is less visible than on lower charts. Speaking about 30 minutes and one hour chart, it is impressive to see that M30 already has a signal, and H1 has deceleration and even a signal of possible reversal.
This example gives us a weighty conclusion:
4. Implementation of the trading strategy in the form of an expert advisor
Expert advisor code:
//+------------------------------------------------------------------+
//|                                                       tester.mq4 |
//|                                                Alexander Fedosov |
//+------------------------------------------------------------------+
#property copyright "Alexander Fedosov"
#property strict
#include <trading.mqh>      //Support library for trade operations
//+------------------------------------------------------------------+
//| Parameters                                                       |
//+------------------------------------------------------------------+
input int             SL = 40;               // Stop loss
input int             TP = 70;               // Take profit
input bool            Lot_perm=true;         // Lot of balance?
input double          lt=0.01;               // Lot
input double          risk = 2;              // Risk of deposit, %
input int             slippage= 5;           // Slippage
input int             magic=2356;            // Magic number
input int             period=8;              // RSI indicator period
input ENUM_TIMEFRAMES tf=PERIOD_CURRENT;     // Working timeframe
int dg,index_rsi,index_ac;
trading tr;
//+------------------------------------------------------------------+
//| Expert Advisor initialization function                           |
//+------------------------------------------------------------------+
int OnInit()
  {
//--- determining variables for auxiliary class of trading functions
//--- language for displaying errors, Russian of by default.
   tr.ruErr=true;
   tr.Magic=magic;
   tr.slipag=slippage;
   tr.Lot_const=Lot_perm;
   tr.Lot=lt;
   tr.Risk=risk;
//--- number of attempts.
   tr.NumTry=5;
//--- determining decimal places on the current chart
   dg=tr.Dig();
   return(INIT_SUCCEEDED);
  }
//+------------------------------------------------------------------+
//| Main calculation function                                        |
//+------------------------------------------------------------------+
void OnTick()
  {
   depth_trend();
   speed_ac();
//--- check for presence of open orders
   if(OrdersTotal()<1)
     {
      //--- check of buy conditions
      if(Buy())
         tr.OpnOrd(OP_BUY,tr.Lots(),Ask,SL*dg,TP*dg);
      //--- check of sell conditions
      if(Sell())
         tr.OpnOrd(OP_SELL,tr.Lots(),Bid,SL*dg,TP*dg);
     }
//--- are there open orders?
   if(OrdersTotal()>0)
     {
      //--- check and close sell orders which meet closing conditions.
      if(Sell_close())
         tr.ClosePosAll(OP_SELL);
      //--- check and close buy orders which meet closing conditions.
      if(Buy_close())
         tr.ClosePosAll(OP_BUY);
     }

  }
//+------------------------------------------------------------------+
//| Function for determining the trend depth                         |
//+------------------------------------------------------------------+
void depth_trend()
  {
//--- determining buy index
   double rsi=iRSI(Symbol(),tf,period,PRICE_CLOSE,0);
   index_rsi = 0;
   if(rsi>90.0) index_rsi=4;
   else if(rsi>80.0)
      index_rsi=3;
   else if(rsi>70.0)
      index_rsi=2;
   else if(rsi>60.0)
      index_rsi=1;
   else if(rsi<10.0)
      index_rsi=-4;
   else if(rsi<20.0)
      index_rsi=-3;
   else if(rsi<30.0)
      index_rsi=-2;
   else if(rsi<40.0)
      index_rsi=-1;
  }
//+------------------------------------------------------------------+
//| Function for determining the trend speed                         |
//+------------------------------------------------------------------+
void speed_ac()
  {
   double ac[];
   ArrayResize(ac,5);
   for(int i=0; i<5; i++)
      ac[i]=iAC(Symbol(),tf,i);

   index_ac=0;
//--- buy signal
   if(ac[0]>ac[1])
      index_ac=1;
   else if(ac[0]>ac[1] && ac[1]>ac[2])
      index_ac=2;
   else if(ac[0]>ac[1] && ac[1]>ac[2] && ac[2]>ac[3])
      index_ac=3;
   else if(ac[0]>ac[1] && ac[1]>ac[2] && ac[2]>ac[3] && ac[3]>ac[4])
      index_ac=4;
//--- sell signal
   else if(ac[0]<ac[1])
      index_ac=-1;
   else if(ac[0]<ac[1] && ac[1]<ac[2])
      index_ac=-2;
   else if(ac[0]<ac[1] && ac[1]<ac[2] && ac[2]<ac[3])
      index_ac=-3;
   else if(ac[0]<ac[1] && ac[1]<ac[2] && ac[2]<ac[3] && ac[3]<ac[4])
      index_ac=-4;
  }
//+------------------------------------------------------------------+
//| Function for checking buy conditions                             |
//+------------------------------------------------------------------+
bool Buy()
  {
   bool res=false;
   if((index_rsi==2 && index_ac>=1) || (index_rsi==3 && index_ac==1))
      res=true;
   return (res);
  }
//+------------------------------------------------------------------+
//| Function for checking sell conditions                            |
//+------------------------------------------------------------------+
bool Sell()
  {
   bool res=false;
   if((index_rsi==-2 && index_ac<=-1) || (index_rsi==-3 && index_ac==-1))
      res=true;
   return (res);
  }
//+------------------------------------------------------------------+
//| Function for checking buy position closing conditions            |
//+------------------------------------------------------------------+
bool Buy_close()
  {
   bool res=false;
   if(index_rsi>2 && index_ac<0)
      res=true;
   return (res);
  }
//+------------------------------------------------------------------+
//| Function for checking sell position closing conditions           |
//+------------------------------------------------------------------+
bool Sell_close()
  {
   bool res=false;
   if(index_rsi<-2 && index_ac>0)
      res=true;
   return (res);
  }
We have performed a small optimization using only two parameters: tf (working timeframe) and period (RSI indicator period).
And we obtained following results on M15:
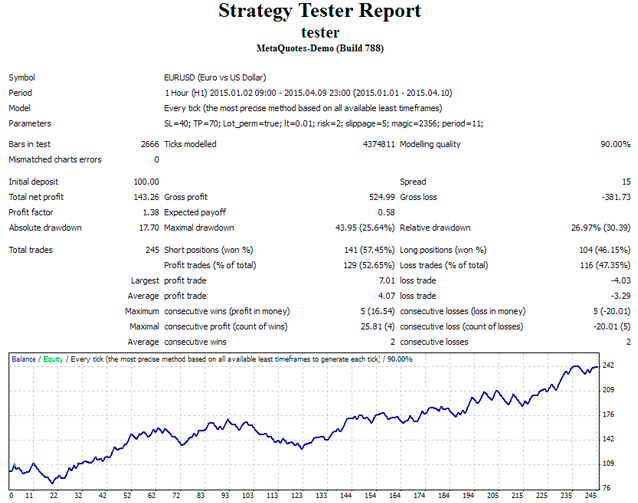
Fig. 4. The Expert Advisor backtesting results
Conclusion
Determination of beginning and end of the trend is one of complicated tasks for traders all over the world as it is impossible to predict market behavior.
But it is entirely possible to determine entry and exit moments in the current trend and therefore gain sizable profit. And the general idea of determination and dynamic track of the movement speed can be helpful in this matter.
Wish you successful trades.
Translated from Russian by MetaQuotes Ltd.
Original article: https://www.mql5.com/ru/articles/1747
 Plotting trend lines based on fractals using MQL4 and MQL5
 Bi-Directional Trading and Hedging of Positions in MetaTrader 5 Using the HedgeTerminal API, Part 2
 Tips for Purchasing a Product on the Market. Step-By-Step Guide
 Studying the CCanvas Class. How to Draw Transparent Objects
- Free trading apps
- Over 8,000 signals for copying
- Economic news for exploring financial markets
You agree to website policy and terms of use
I slightly corrected your code
well the basic idea is interesting at first
you should take a look on speed and acceleration (file in attachment)
I think you will be able to set up a better strategy than AC
Good luck
jaguar1637 from http://beathespread.com
hi
Well, there is another possibility, regarding the replacement of AC, PFE , and also DPO
Your speed_ac function is wrong, the if else blocks are backwards. the should look like this
Hi,
I noticed the same error in the speed_ac function. Thanks for the hint. This error limits the return values for index_ac to 0, 1 or -1 affecting the Buy(), Sell(), Buy_close() and the Sell_close() function.
Here is my version returning the index_ac value and with the additional advantage of minimizing the number comparisons:
Similarly I changed the depth_trend function:
The use of these function in OnTick() is the following:
Now I' m finishing my modifications and I'm looking forward to see test results for this good idea of Alexander.
Happy trading
Matthias
Now I' m finishing my modifications and I'm looking forward to see test results for this good idea of Alexander.