mazen nafee / 个人资料
- 信息
|
10+ 年
经验
|
0
产品
|
0
演示版
|
|
0
工作
|
0
信号
|
0
订阅者
|
mazen nafee
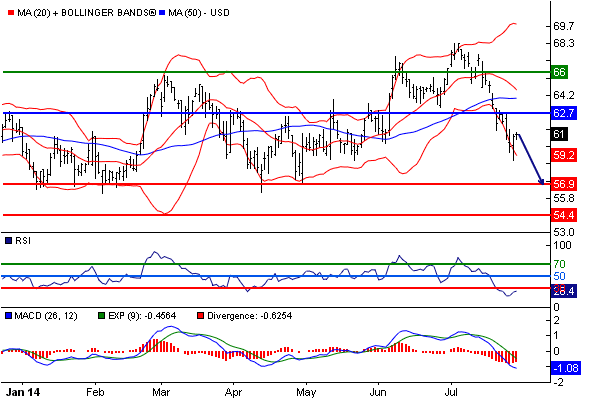
Rogers Corp ST: the RSI is oversold
Our pivot point is at 62.7.
Our preference: the downside prevails as long as 62.7 is resistance.
Alternative scenario: above 62.7, look for 64.8 and 66.
Comment: the RSI is below 30. It could either mean that the stock is in a lasting downtrend or just oversold and therefore bound to retrace (look for bullish divergence in this case). The MACD is below its signal line and negative. The configuration is negative. Moreover, the stock is trading under both its 20 and 50 day MA (respectively at 64.59 and 63.91).
Supports and resistances:
66 **
64.8 *
62.7 **
61.9
60.97 last
58.1
56.9 **
55.6 *
54.4 **

分享社交网络 · 3
mazen nafee
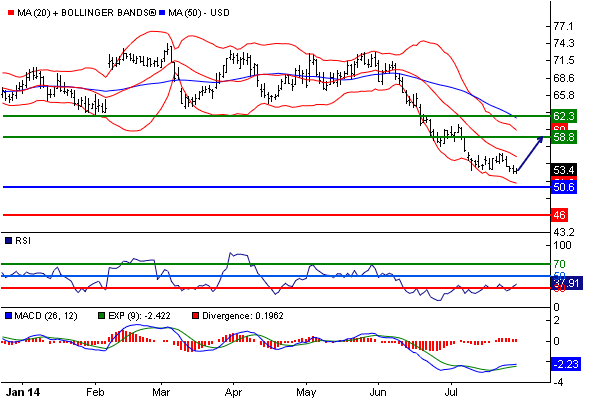
Outerwall ST: short term rebound towards 58.8
Our pivot point stands at 50.6.
Our preference: short term rebound towards 58.8.
Alternative scenario: the downside breakout of 50.6 would call for 47.8 and 46.
Comment: the RSI is below its neutrality area at 50. The MACD is negative and above its signal line. The configuration is mixed. Moreover, the stock is trading under both its 20 and 50 day MA (respectively at 55.66 and 62.04).
Supports and resistances:
62.3 **
60.6 *
58.8 **
57.1
53.39 last
51.7
50.6 **
47.8 *
46 **

分享社交网络 · 3
mazen nafee
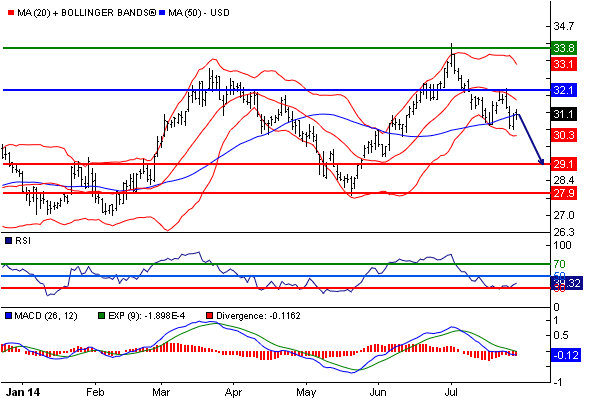
American States Water Co ST: the downside prevails as long as 32.1 is resistance
Our pivot point stands at 32.1.
Our preference: the downside prevails as long as 32.1 is resistance.
Alternative scenario: above 32.1, look for 33.2 and 33.8.
Comment: the RSI is below 50. The MACD is below its signal line and negative. The configuration is negative. Moreover, the stock is trading under both its 20 and 50 day MA (respectively at 31.71 and 31.14).
Supports and resistances:
33.8 **
33.2 *
32.1 **
31.7
31.12 last
29.7
29.1 **
28.5 *
27.9 **

分享社交网络 · 3
mazen nafee
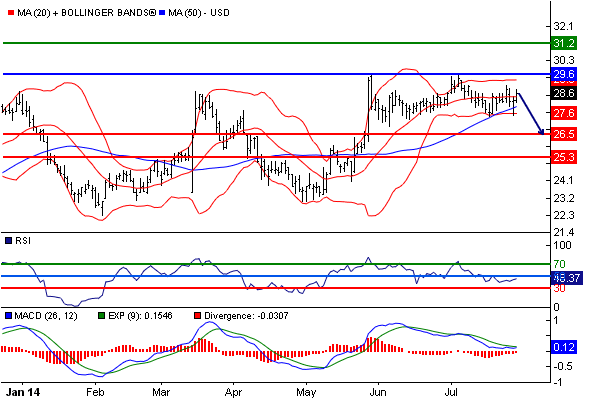
Brown Shoe Co Inc ST: target 26.5
Our pivot point is at 29.6.
Our preference: target 26.5.
Alternative scenario: the upside breakout of 29.6 would call for 30.6 and 31.2.
Comment: the RSI is below 50. The MACD is below its signal line and positive. The MACD must penetrate its zero line to expect further downside. Moreover, the stock is above its 20 and 50 day MA (respectively at 28.45 and 27.94). Brown Shoe Co Inc is currently trading near its 52 week high reached at 29.65 on 29/05/14.
Supports and resistances:
31.2 **
30.6 *
29.6 **
29.2
28.63 last
27
26.5 **
25.9 *
25.3 **

分享社交网络 · 3
mazen nafee
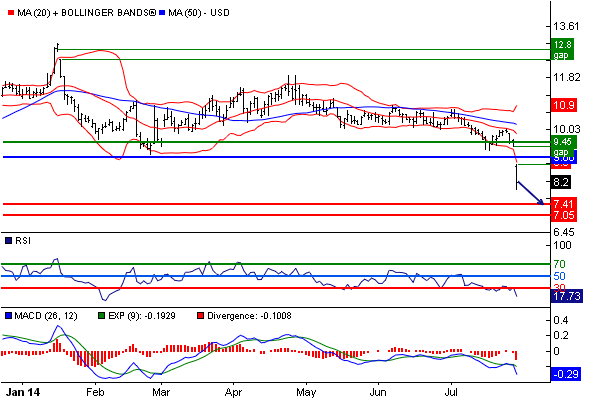
GrafTech ST: the RSI is oversold
Our pivot point stands at 9.06.
Our preference: the downside prevails as long as 9.06 is resistance.
Alternative scenario: the upside breakout of 9.06 would call for 9.4 and 9.59.
Comment: the RSI is trading below 30. This could mean that either the stock is in a lasting downtrend or just oversold and that therefore a rebound could shape (look for bullish divergence in this case). The MACD is negative and below its signal line. The configuration is negative. Moreover, the stock is trading under both its 20 and 50 day MA (respectively at 9.88 and 10.21). Finally, GrafTech is trading below its lower daily Bollinger band (standing at 8.87).
Supports and resistances:
9.59 **
9.4 *
9.06 **
8.93
8.205 last
7.59
7.41 **
7.23 *
7.05 **

分享社交网络 · 1
mazen nafee
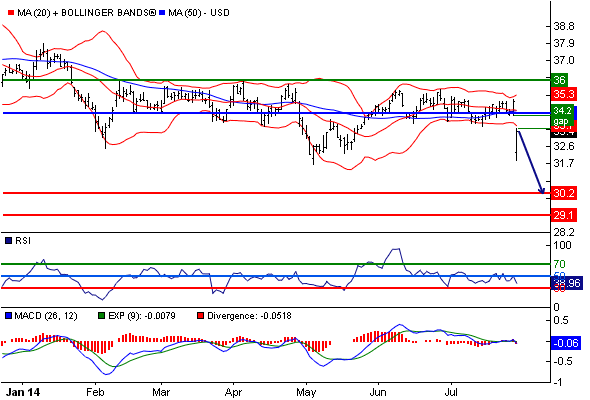
Owens & Minor ST: below its lower Bollinger band
Our pivot point is at 34.3.
Our preference: the downside prevails as long as 34.3 is resistance.
Alternative scenario: above 34.3, look for 35.3 and 36.
Comment: the RSI is below 50. The MACD is below its signal line and negative. The configuration is negative. Moreover, the share stands below its 20 and 50 day MA (respectively at 34.48 and 34.46). Finally, Owens & Minor has penetrated its lower daily Bollinger band (33.67). Owens & Minor is currently trading near its 52 week low at 31.71 reached on 05/05/14.
Supports and resistances:
36 **
35.3 *
34.3 **
34
33.42 last
30.8
30.2 **
29.7 *
29.1 **

分享社交网络 · 1
mazen nafee
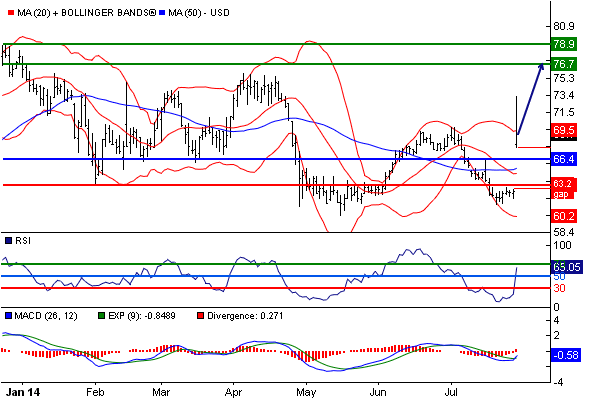
IPG Photonics Corp ST: gap
Our pivot point stands at 66.4.
Our preference: our next up target stands at 76.7.
Alternative scenario: below 66.4, expect 64.6 and 63.6.
Comment: the RSI is above its neutrality area at 50. The MACD is above its signal line and negative. The MACD must break above its zero level to call for further upside. Moreover, the stock is trading above both its 20 and 50 day MA (respectively at 64.86 and 65.43).
Supports and resistances:
78.9 **
77.8 *
76.7 **
75.6
69.12 last
67.1
66.4 **
64.6 *
63.6 **

分享社交网络 · 1
mazen nafee
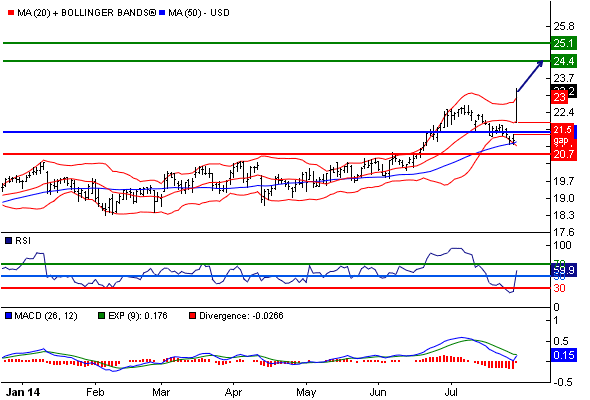
Consolidated Communications Holdings Inc ST: above its upper Bollinger band
Our pivot point stands at 21.6.
Our preference: as long as 21.6 is support look for 24.4.
Alternative scenario: below 21.6, expect 21 and 20.7.
Comment: the RSI is above 50. The MACD is below its signal line and positive. The stock could retrace in the short term. Moreover, the stock is above its 20 and 50 day MA (respectively at 22.02 and 21.22). Finally, Consolidated Communications Holdings Inc is trading above its upper Bollinger band (standing at 23.01). Consolidated Communications Holdings Inc is currently trading near its 52 week high reached at 23.32 on 29/07/14.
Supports and resistances:
25.1 **
24.7 *
24.4 **
24
23.2 last
21.8
21.6 **
21 *
20.7 **

分享社交网络 · 1
mazen nafee
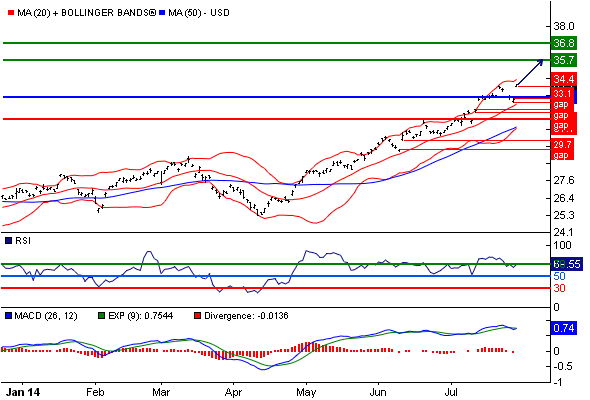
NTT (ADR) ST: gap
Our pivot point stands at 33.2.
Our preference: as long as 33.2 is support look for 35.7.
Alternative scenario: below 33.2, expect 32.3 and 31.7.
Comment: the RSI is above 50. The MACD is positive and below its signal line. The stock could retrace in the short term. Moreover, the stock is above its 20 and 50 day MA (respectively at 32.74 and 31.2). NTT (ADR) is currently trading near its 52 week high reached at 34.08 on 29/07/14.
Supports and resistances:
36.8 **
36.3 *
35.7 **
35.2
34.08 last
33.5
33.2 **
32.3 *
31.7 **

分享社交网络 · 1
mazen nafee
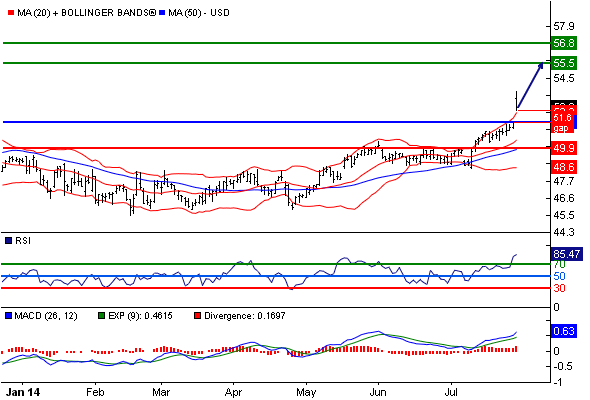
Verizon Communications ST: the RSI is overbought
51.6 is our pivot point.
Our preference: the upside prevails as long as 51.6 is support.
Alternative scenario: below 51.6, expect 50.5 and 49.9.
Comment: the RSI is above 70. It could mean either that the stock is in a lasting uptrend or just overbought and therefore bound to correct (look for bearish divergence in this case). The MACD is above its signal line and positive. The configuration is positive. Moreover, the stock is trading above both its 20 and 50 day MA (respectively at 50.42 and 49.8). Finally, Verizon Communications is trading above its upper Bollinger band (standing at 52.3). Verizon Communications is currently trading near its 52 week high reached at 53.66 on 29/07/14.
Supports and resistances:
56.8 **
56.2 *
55.5 **
54.9
52.61 last
52
51.6 **
50.5 *
49.9 **

分享社交网络 · 1
mazen nafee
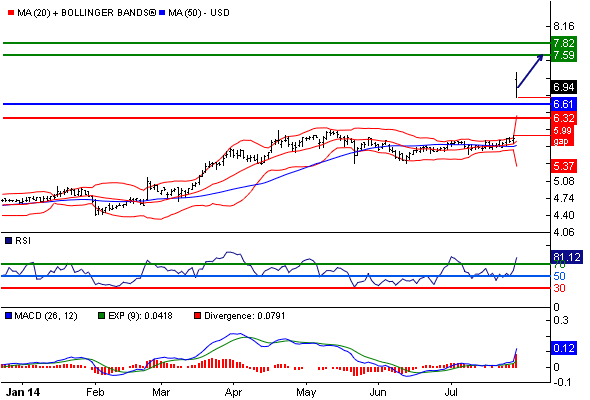
Frontier Communications ST: the RSI is overbought
Our pivot point is at 6.61.
Our preference: the upside prevails as long as 6.61 is support.
Alternative scenario: the downside breakout of 6.61 would call for 6.43 and 6.32.
Comment: the RSI is trading above 70. This could mean that either the stock is in a lasting uptrend or just overbought and that therefore a correction could shape (look for bearish divergence in this case). The MACD is above its signal line and positive. The configuration is positive. Moreover, the stock is trading above both its 20 and 50 day MA (respectively at 5.88 and 5.79). Finally, Frontier Communications is trading above its upper Bollinger band (standing at 6.39). Frontier Communications is currently trading near its 52 week high reached at 7.24 on 29/07/14.
Supports and resistances:
7.82 **
7.7 *
7.59 **
7.47
6.9435 last
6.68
6.61 **
6.43 *
6.32 **

分享社交网络 · 1
mazen nafee
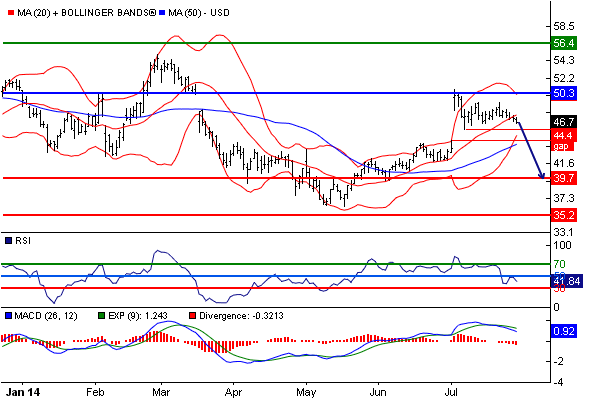
Shutterfly Inc ST: target 39.7
Our pivot point stands at 50.3.
Our preference: target 39.7.
Alternative scenario: above 50.3, look for 54.2 and 56.4.
Comment: the RSI is below 50. The MACD is positive and below its signal line. The MACD must penetrate its zero line to expect further downside. Moreover, the stock is trading under its 20 day MA (47.6) but above its 50 day MA (43.97).
Supports and resistances:
56.4 **
54.2 *
50.3 **
48.7
46.71 last
42
39.7 **
37.5 *
35.2 **

分享社交网络 · 1
mazen nafee
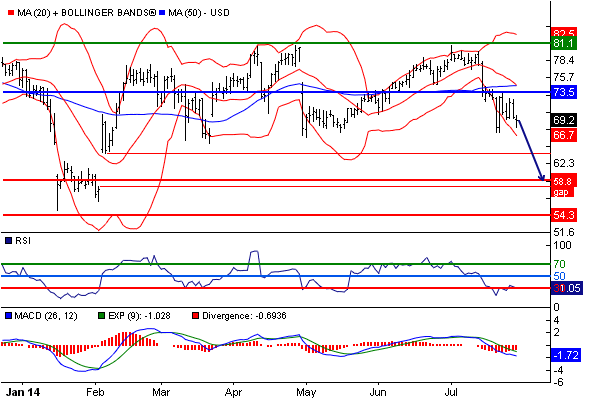
USANA Health Sciences Inc ST: the downside prevails as long as 73.5 is resistance
Our pivot point stands at 73.5.
Our preference: the downside prevails as long as 73.5 is resistance.
Alternative scenario: the upside breakout of 73.5 would call for 78.3 and 81.1.
Comment: the RSI is below 50. The MACD is negative and below its signal line. The configuration is negative. Moreover, the share stands below its 20 and 50 day MA (respectively at 74.63 and 74.54).
Supports and resistances:
81.1 **
78.3 *
73.5 **
71.7
69.18 last
62.5
59.8 **
57 *
54.3 **

分享社交网络 · 1
mazen nafee
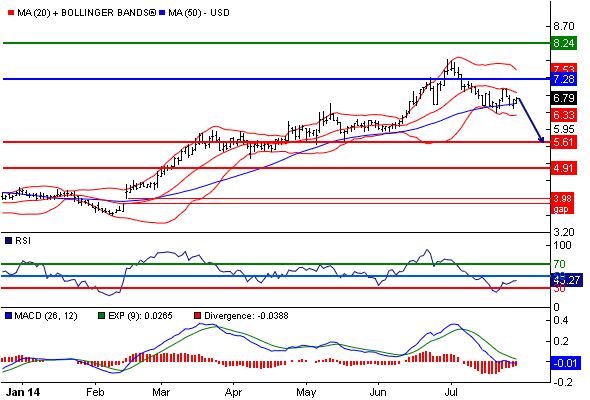
Petroquest Energy Inc ST: eye 5.61
7.28 is our pivot point.
Our preference: eye 5.61.
Alternative scenario: above 7.28, look for 7.88 and 8.24.
Comment: the RSI is below its neutrality area at 50. The MACD is below its signal line and negative. The configuration is negative. Moreover, the stock is below its 20 day MA (6.93) but above its 50 day MA (6.65).
Supports and resistances:
8.24 **
7.88 *
7.28 **
7.05
6.79 last
5.95
5.61 **
5.25 *
4.91 **

分享社交网络 · 1
mazen nafee
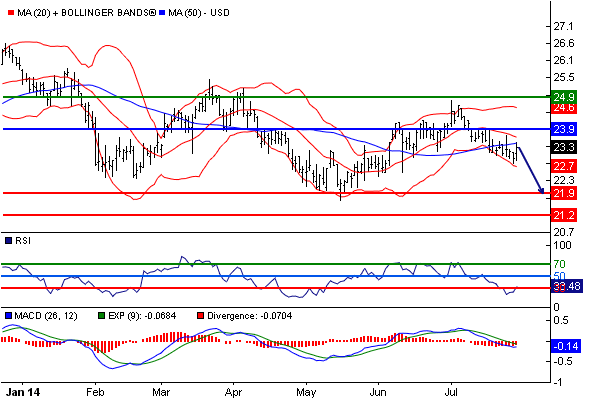
NBT Bancorp Inc ST: the downside prevails as long as 23.9 is resistance
23.9 is our pivot point.
Our preference: the downside prevails as long as 23.9 is resistance.
Alternative scenario: above 23.9, look for 24.5 and 24.9.
Comment: the RSI is below 50. The MACD is negative and below its signal line. The configuration is negative. Moreover, the share stands below its 20 and 50 day MA (respectively at 23.65 and 23.47).
Supports and resistances:
24.9 **
24.5 *
23.9 **
23.7
23.32 last
22.2
21.9 **
21.6 *
21.2 **

分享社交网络 · 1
mazen nafee
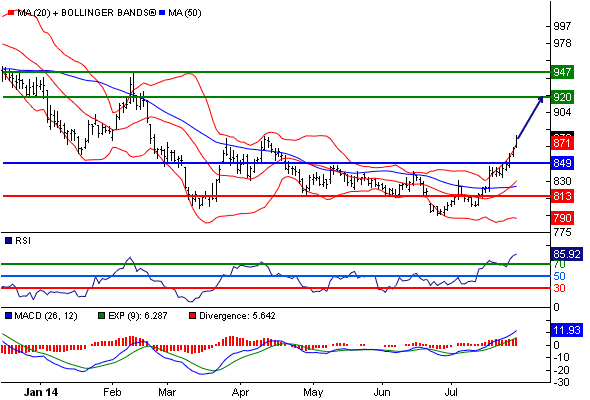
Our pivot point stands at 849.
Our preference: the upside prevails as long as 849 is support.
Alternative scenario: below 849, expect 827 and 813.
Comment: the RSI is trading above 70. This could mean that either the index is in a lasting uptrend or just overbought and that therefore a correction could shape (look for bearish divergence in this case). The MACD is above its signal line and positive. The configuration is positive. CSI 300 Transportation index is trading above both its 20 and 50 period MA (respectively at 830.32 and 824.6). Finally, the CSI 300 Transportation index is trading above its upper Bollinger band (standing at 871.77).
Supports and resistances:
947 **
934 *
920 **
907
875.819 last
858
849 **
827 *
813 **

分享社交网络 · 1
mazen nafee
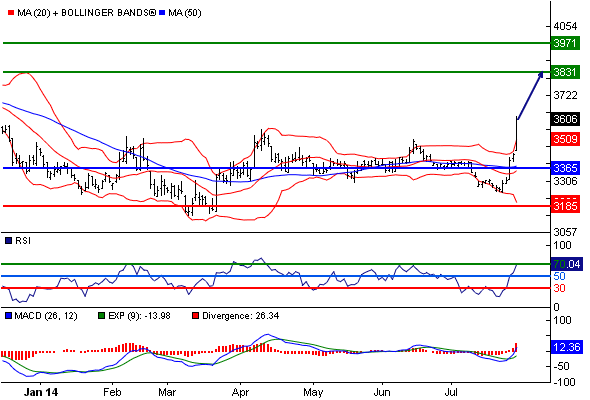
CSI 300 Banks index ST: above its upper Bollinger band
Our pivot point is at 3365.
Our preference: the upside prevails as long as 3365 is support.
Alternative scenario: below 3365, expect 3252 and 3185.
Comment: the RSI is trading above 70. This could mean that either the index is in a lasting uptrend or just overbought and that therefore a correction could shape (look for bearish divergence in this case). The MACD is positive and above its signal line. The configuration is positive. CSI 300 Banks index is above its 20 and 50 period MA (respectively at 3355.49 and 3378.28). Finally, the CSI 300 Banks index has crossed above its upper daily Bollinger band (3513.38).
Supports and resistances:
3971 **
3901 *
3831 **
3761
3605.524 last
3409
3365 **
3252 *
3185 **

分享社交网络 · 1
mazen nafee
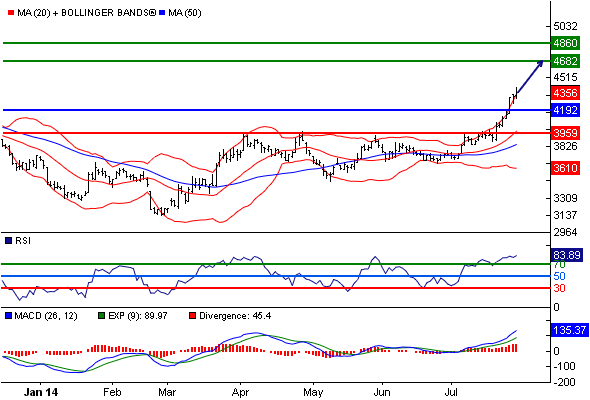
CSI 300 Real Estate index ST: the RSI is overbought
Our pivot point is at 4192.
Our preference: the upside prevails as long as 4192 is support.
Alternative scenario: below 4192, expect 4046 and 3959.
Comment: the RSI is above 70. It could mean either that the index is in a lasting uptrend or just overbought and therefore bound to correct (look for bearish divergence in this case). The MACD is positive and above its signal line. The configuration is positive. CSI 300 Real Estate index is trading above both its 20 and 50 period MA (respectively at 3982.82 and 3848.56). Finally, the CSI 300 Real Estate index has crossed above its upper daily Bollinger band (4365.83).
Supports and resistances:
4860 **
4772 *
4682 **
4594
4373.434 last
4249
4192 **
4046 *
3959 **

分享社交网络 · 1
mazen nafee
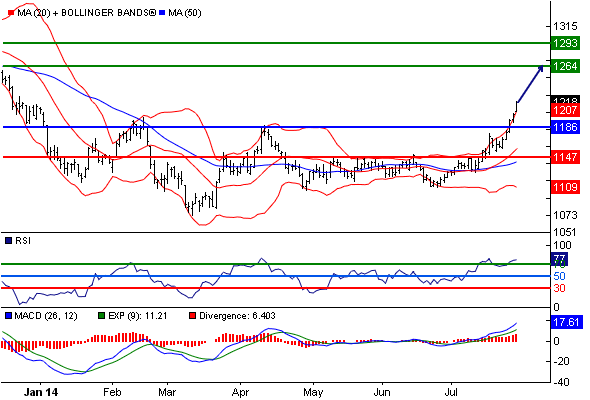
CSI 300 Infrastructure index ST: the RSI is overbought
Our pivot point stands at 1186.
Our preference: the upside prevails as long as 1186 is support.
Alternative scenario: the downside breakout of 1186 would call for 1162 and 1147.
Comment: the RSI is trading above 70. This could mean that either the index is in a lasting uptrend or just overbought and that therefore a correction could shape (look for bearish divergence in this case). The MACD is above its signal line and positive. The configuration is positive. CSI 300 Infrastructure index is above its 20 and 50 period MA (respectively at 1158.05 and 1141.33). Finally, the CSI 300 Infrastructure index is trading above its upper Bollinger band (standing at 1208.61).
Supports and resistances:
1293 **
1279 *
1264 **
1249
1217.689 last
1196
1186 **
1162 *
1147 **

分享社交网络 · 1
mazen nafee
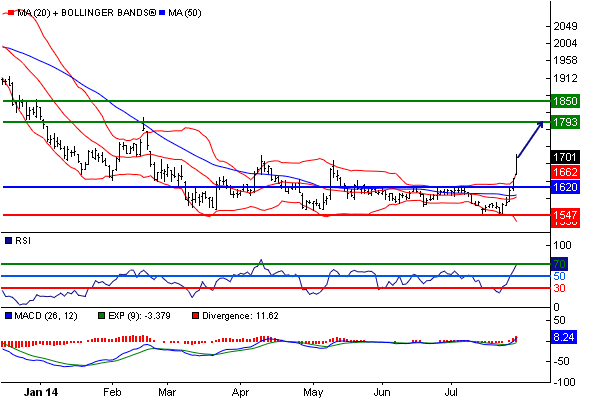
CSI 300 Energy index ST: above its upper Bollinger band
Our pivot point is at 1620.
Our preference: the upside prevails as long as 1620 is support.
Alternative scenario: the downside breakout of 1620 would call for 1574 and 1547.
Comment: the RSI is above 70. It could mean either that the index is in a lasting uptrend or just overbought and therefore bound to correct (look for bearish divergence in this case). The MACD is positive and above its signal line. The configuration is positive. CSI 300 Energy index is above its 20 and 50 period MA (respectively at 1595.94 and 1601.03). Finally, the CSI 300 Energy index has crossed above its upper daily Bollinger band (1663.96).
Supports and resistances:
1850 **
1822 *
1793 **
1765
1700.671 last
1639
1620 **
1574 *
1547 **

分享社交网络 · 1
: