Richard Jehl / 个人资料
- 信息
|
10+ 年
经验
|
2
产品
|
37
演示版
|
|
0
工作
|
0
信号
|
0
订阅者
|
Richard Jehl
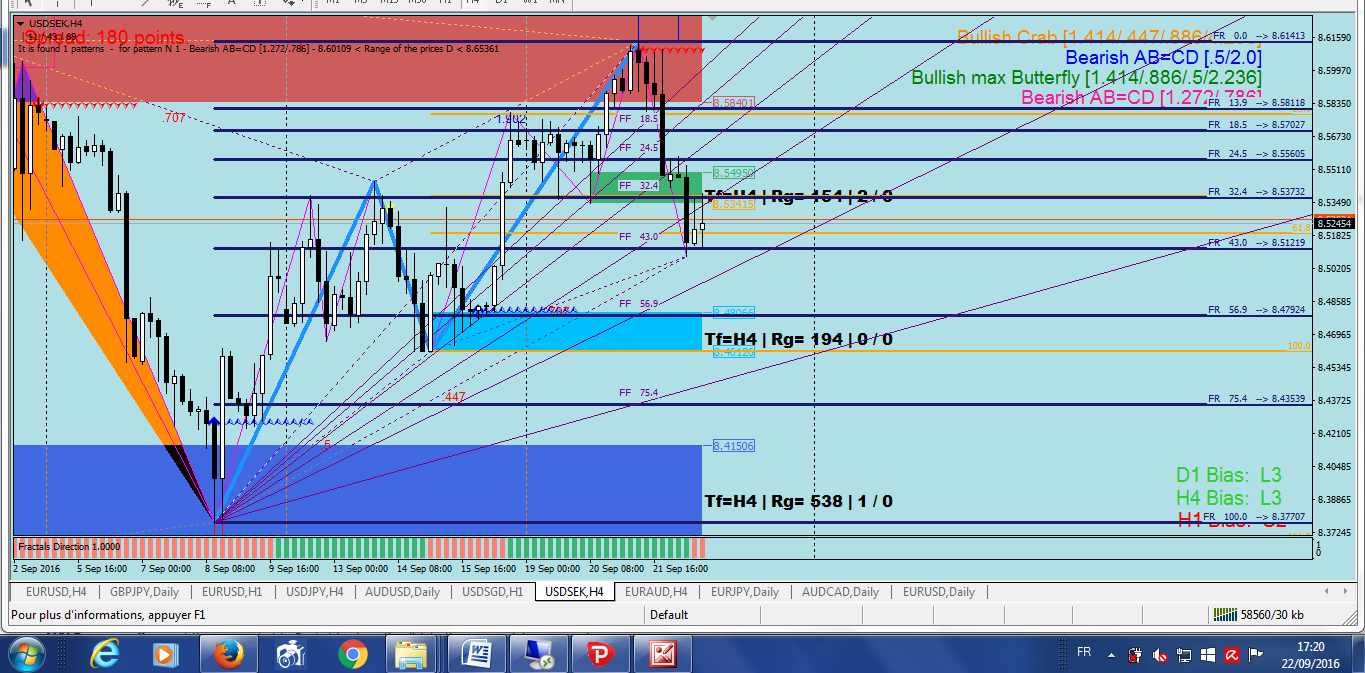
Relation of the 61.8 classic Fibonacci level and the 43.0 of Padovan grid. Here Fibos are drawn considering the CD leg and Padovan the AD move.
分享社交网络 · 1
Richard Jehl
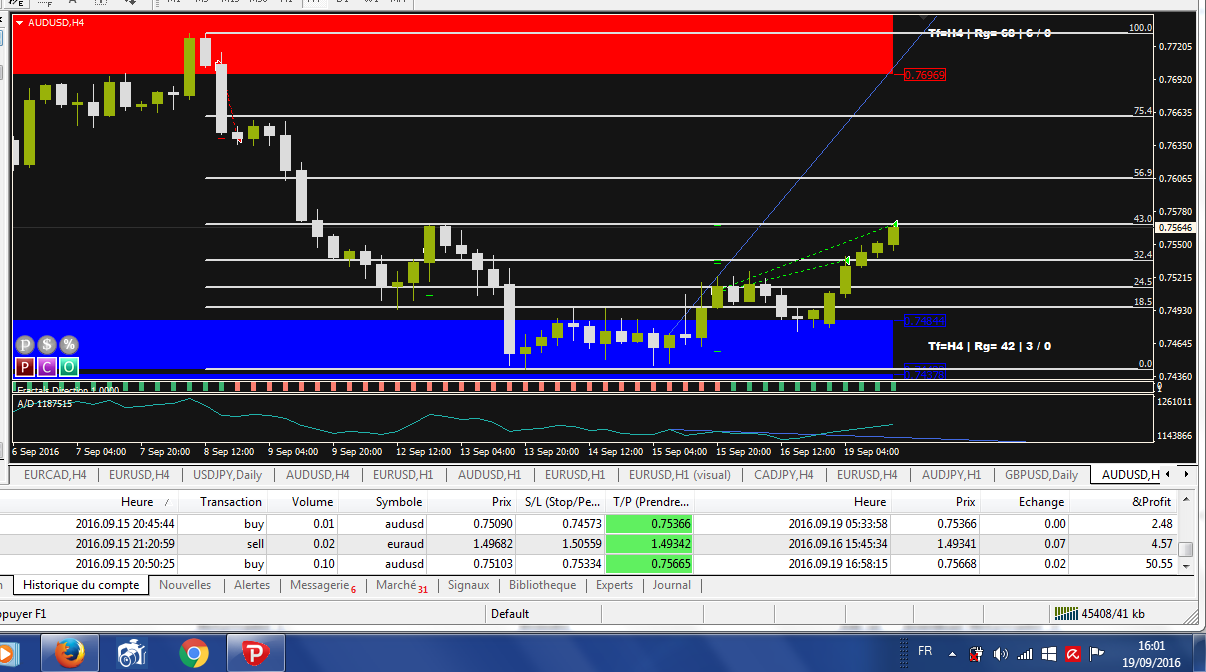
Here is an example of using Padovan grid for TP. So far I find these levels slightly safer than the classic Fibonacci levels, as the 61.8% is often missed by a few pips. Coming from the mathematical characteristics of the sequence, 24.5% level is often a good entry point if broken significantly, and 43% a good TP. 56.9% level broken means reversal is strong and initial trend (fundamental leg the retracements are drawn from) is momentarily suspended. Here AUDUSD reached the significant 43% level right at intraday US secondary session opening.
分享社交网络 · 1
Richard Jehl

GBPAUD has had bullish momentum, but it is reaching Supply Zone on D1. It may break this zone later, after a pullback. Not any bearish pattern formed yet, but there are already some on H4. Too soon to open a sell trade, but I think the 24.5 level is likely to be hit. Risk/Reward can be 1/1.
分享社交网络 · 1
Richard Jehl
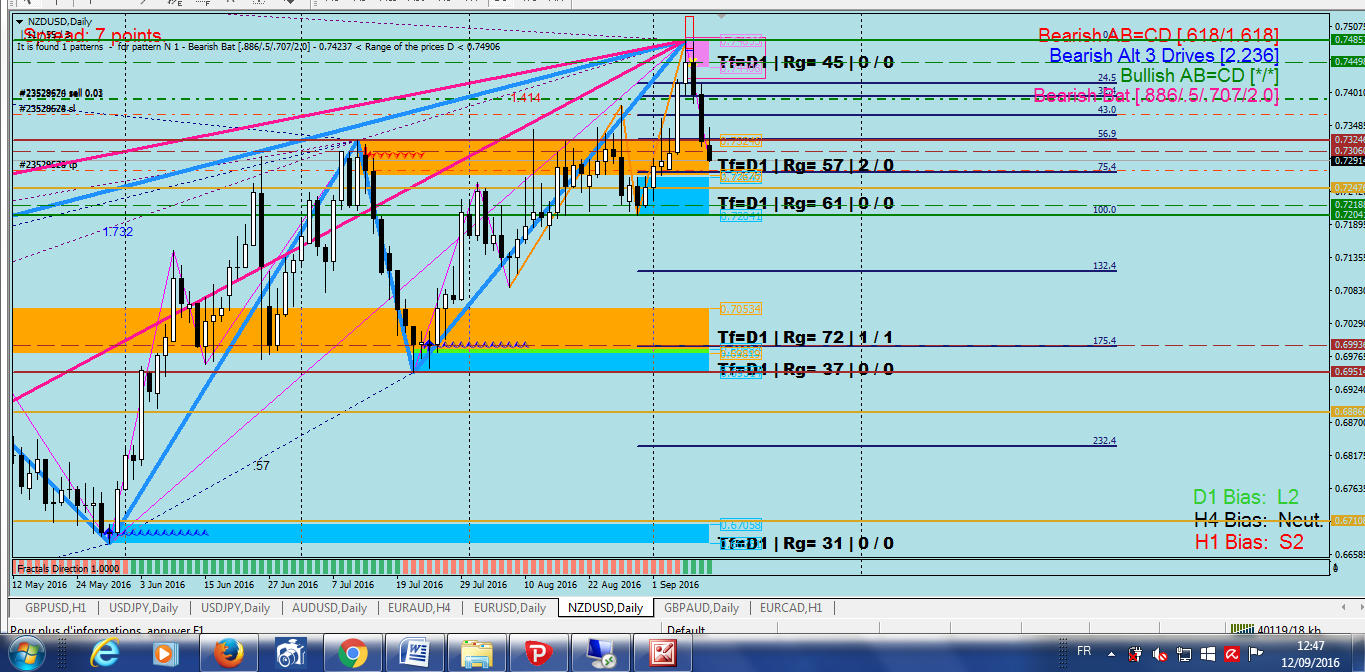
NZDUSD D1 chart. Convergence of several bearish patterns. I think the 75.4 level will be reached, and that also the pair can fall further down. W1 chart also shows several bearish patterns just formed. I'll have to reconsider Padovan patterns because the ratios were incorrect in the below images, despite the patterns were quite impressive. True triangles on their own are to be considered with the sequence, and not triangles as part of squares, as in the Phytagorean theorem. Thus it is not square roots to be used in ratio calculations but rather third roots. You can play with and look at Padovan grid considering the silver number is 1.3247. Grid levels thus are 0.7548, 0.5698, 0.4301, 0.3247, 0.2451, and 1, 1.3247, 1.7548, 2.3247 etc. Will NZDUSD slowly fall to the 132.4 and the 175.4 levels, breaking the latest demand zone ?...
Richard Jehl

The 75.4 level in Padovan grid correspond to the 61.8 in the golden fibos. Here is a live trade where I try to catch the 75.4 level. I don't close TP yet because no demand zone is formed, we are still in between zones. Bullish patterns are not relevant yet. An important bullish ABCD on H4 has just been invalidated. When price has strong momentum it goes directly through a Padovan level to react to the next. Levels have to be considered 2 by 2, it is a difference from the Fibonacci grid. That comes from the Padovan sequence being a x3 - x - 1 = 0 equation. 43.0 and 56.9 levels are very important.
Richard Jehl
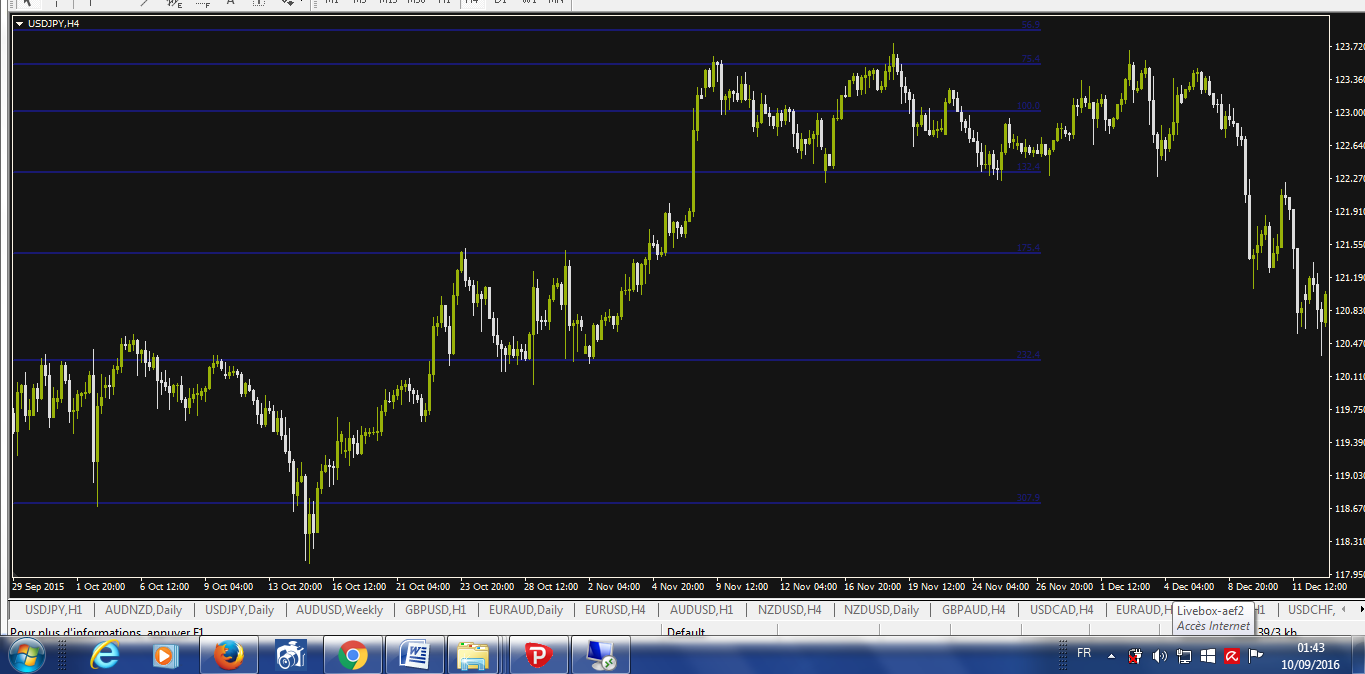
Padovan grid on USDJPY. Look how price reacts at these levels. It is even more clear and more obvious than Fibonacci levels.
Richard Jehl


Similarly to NZDUSD, USDJPY touched the 56.9 level but not the 61.8. It will probably be the case, next week, as if the 61.8 level was still an open target.
Richard Jehl
2016.09.12
Price later failed to reached 61.8 and went to the south, which shows the superiority of taking Padovan levels into account. 56.9 of Padovan grid EXACTLY hit.
Richard Jehl

Padovan retracements give also the reason an artificial "50% retracement" was felt necessary, and was added despite it is not derived from the Fibonacci serie. The true "50% level" corresponds in reality to a 56.9 % retracement. Here is NZDUSD D1 chart at market close. Levels precisely correspond to Supply and Demand zone of the market. Market DID NOT close touching the classic 61.8 level, but just stayed a few pips above it. The move accomplished itself on the 56.9 retracement. How beautiful.
Richard Jehl
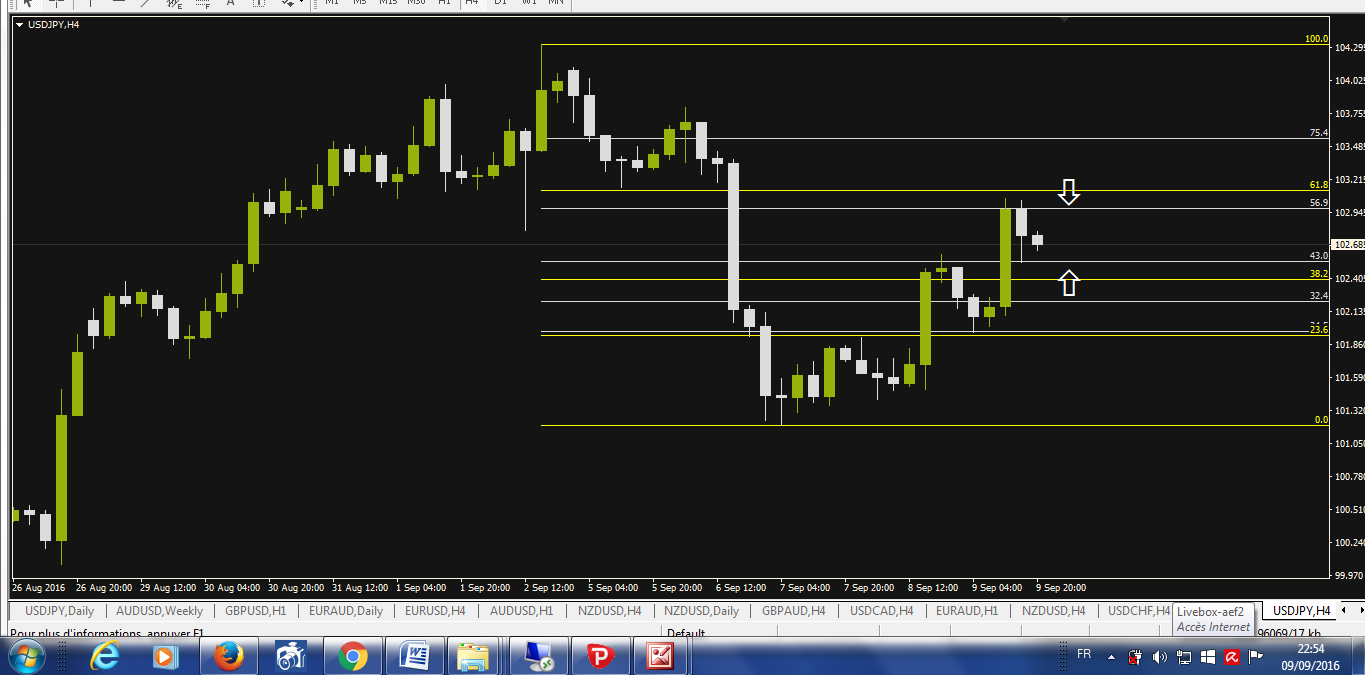
What is called the "silver number" or "plastic number" is the true core of the Fibonacci serie, where the 0 is replaced by the value 1 which is the value of the second number of the Fibonacci serie. This gives the Padovan serie, the rythm of which is ternary (x3 - x - 1 = 0 equation). Where the Fibonacci serie builds spirals with squares, the Padovan serie builds them with triangles. The Padovan sequence gives a wonderful approach to the spirals and living phenomenas of nature, and is said to give more precise estimations to living constructions. This suite gives the true birth the Fibonacci serie is awaiting, and truly reflects the movements of life. Look what is given when applied to retracements. In gold are the Fibonacci serie derived levels, and in silver the Padovan serie derived levels. A chart taken randomly. Appreciate.
Richard Jehl

Here is how comparing RSI can alert of a possible reversal setup, when a currency is in overbought area and another one in oversold area. USD is now on H1 the strongest and NZD among the weakest. To be used with other tools to decide entry, TP and SL.
分享社交网络 · 2
: