Critical Zones MT4
- 指标
- Rodrigo Arana Garcia
- 版本: 1.0
- 激活: 7
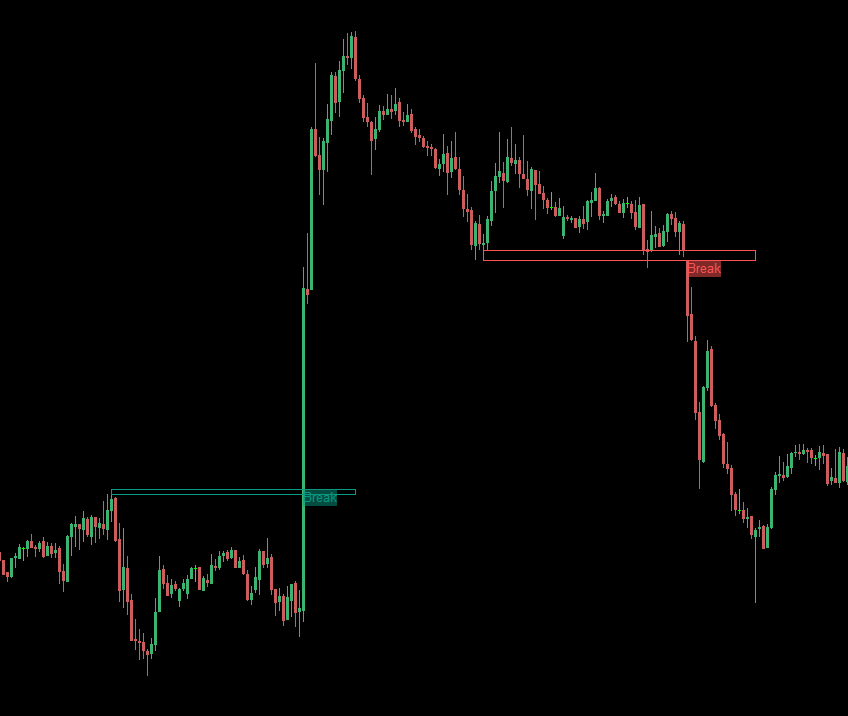
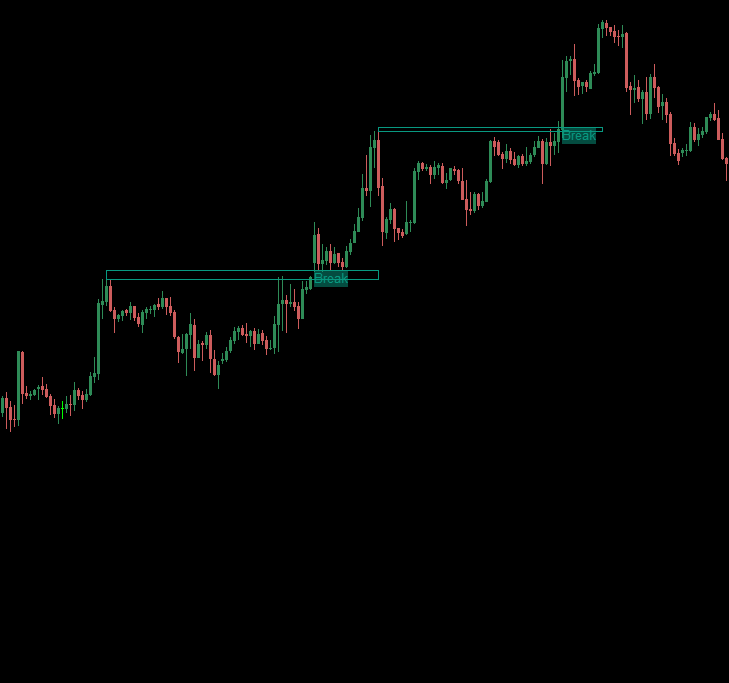
临界区(Critical Zones)是专为寻找更准确市场入口的手动交易者而设计的。该指标采用先进的算法,通过计算图表上最相关的支撑位和阻力位以及它们的突破和回测来检测感兴趣的区域。该指标可配置为在检测到潜在有利可图的买入/卖出机会时发送警报和通知,让交易者即使不在屏幕/MT5 版本前,也能随时掌握交易机会。
价格将逐步提高,直至达到 300 美元。下一个价格--> 69 美元
功能特点
| 无重绘 | 当新数据到来时,该指标不会改变其数值。 |
| 交易货币对 | 所有外汇货币对 |
| 季节性 | 所有季节性 |
参数
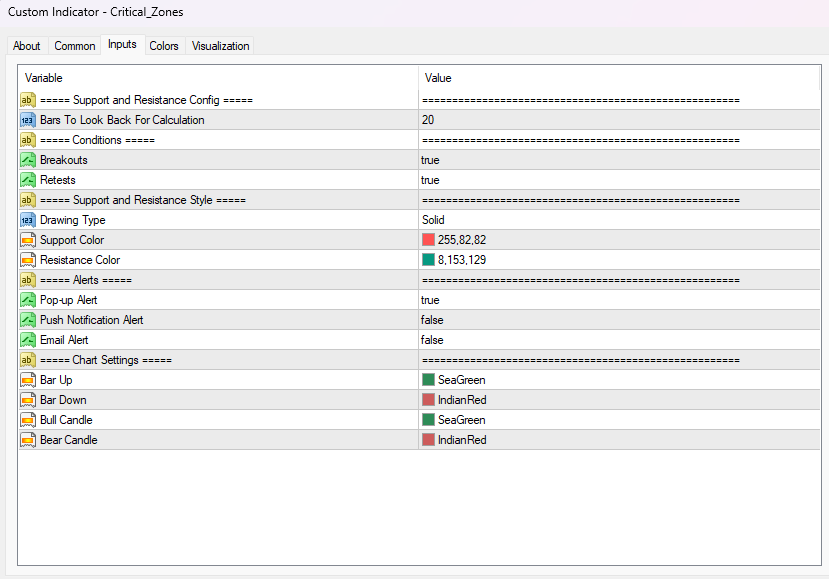
===== 支撑位和阻力位 配置 =====
用于计算的查看条形图 // 从当前条形图向后查看的条形图范围,用于计算支撑位和阻力位
===== 条件 =====
突破 // 打开或关闭突破检测
回测 // 启用或禁用回测检测
===== 支撑位和阻力位样式 =====
绘制类型 // 设置支撑线和阻力线的线型
支撑线颜色 // 设置支撑位的颜色
阻力位颜色 // 为阻力位定义颜色
===== 警报 =====
弹出式警报 // MT4 终端警报
推送通知警报 // 警报发送到手机
电子邮件警报 // 向电子邮件发出警报
===== 图表设置 =====
更改图表上烛台颜色的选项
警告
我只在 MQL5.com 上销售我的产品。如果有人联系您向您推销我的产品,那么他们就是骗子,只想要您的钱。
此外,如果您从外部网站购买我的产品,我向您保证,这些产品都是假冒版本,与正版产品的功能不一样。