Stairway
- 指标
- Gennadiy Stanilevych
- 版本: 6.0
- 更新: 21 十一月 2021
- 激活: 13
The multi-timeframe indicator of the levels of the Pivot Points.
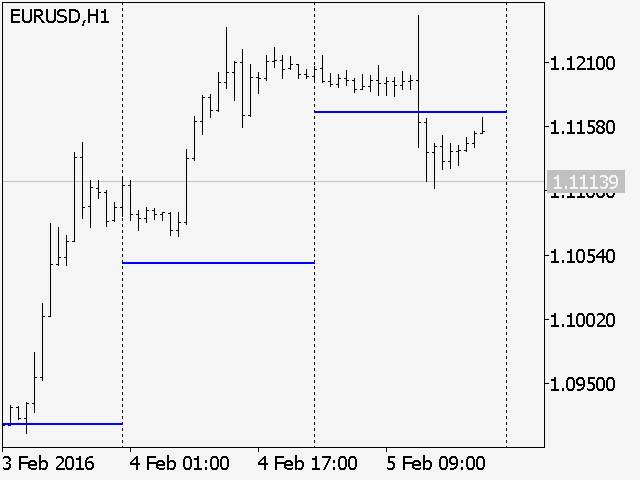
Every closed daily period has its own so-called reference point - Pivot Point, which sets the levels for smaller intraday timeframes for the following day. The Pivot Points indicators existing in the codes have no method of showing the dynamics of the pivot point changes on the historical data of the price chart.
Pivot Point calculation formula.
Pivot=(High + Low + Close) /3
High — the maximum of the previous day;
Low — the minimum of the previous day;
Close — the close price of the previous day;
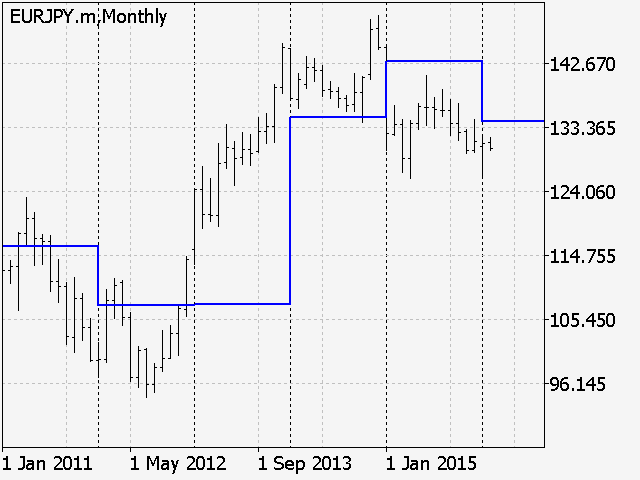
This calculation is also valid for the weekly, monthly and even yearly periods.
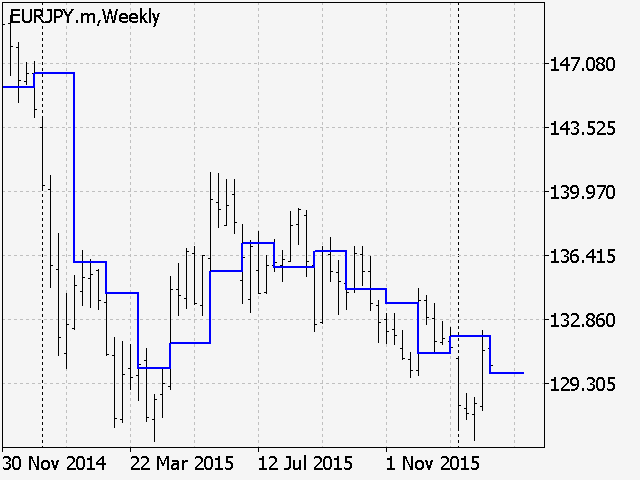
When there are no yearly candlestick on the chart, the pivot level for the previous year can be calculated based on the data on the price High and Low values reached during the previous year, and also with the close price of the last month of the previous year available. And so on, the calculation of the Pivot Point of the month will be the resistance or the support line for the weekly chart, and the Pivot Point of the week - for the daily chart.
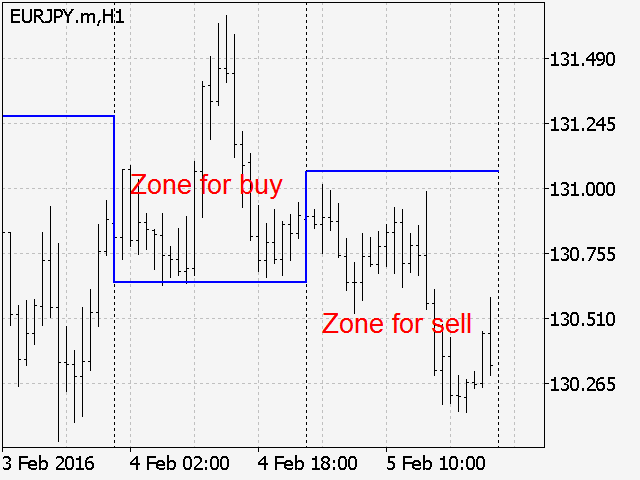
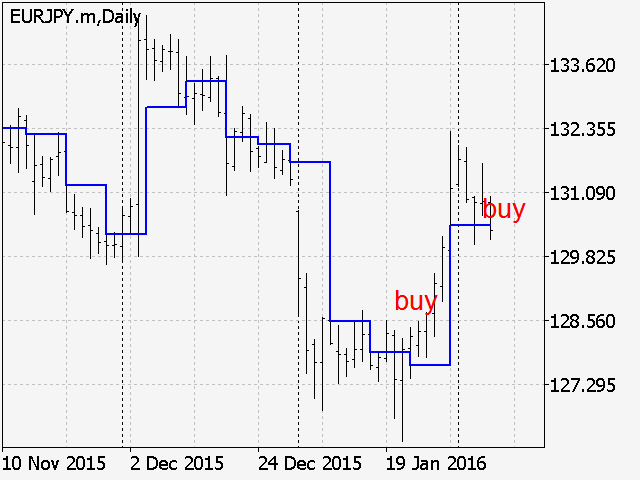
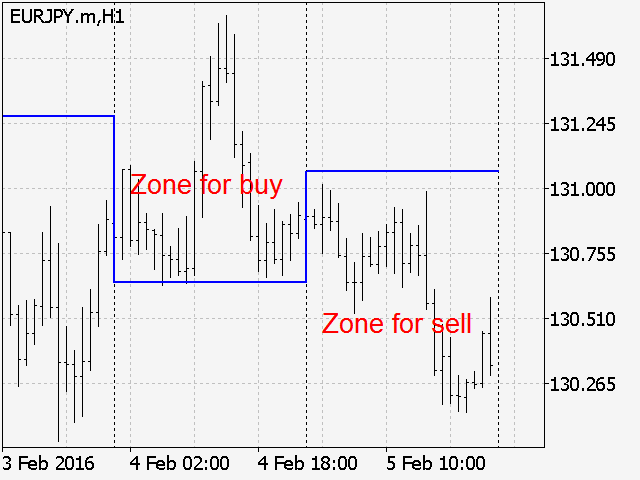
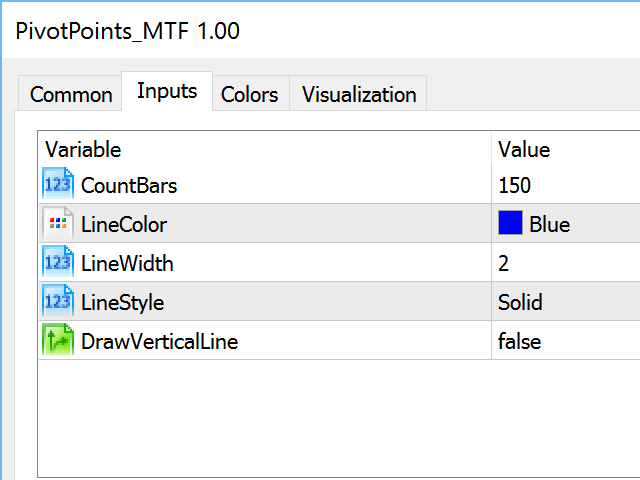
This is versatile indicator for automatic plotting of the Pivot Point levels based on the calculated Pivot Points on all periods. The settings of the indicator include the ability to connect the horizontal Pivot Point levels with a vertical line, which gives the ability to show the upward or downward "ladder" of the Pivot Points on the chart.
In addition, the settings include the ability to select the width and the color of the Pivot Point level lines.
The strategy for trading Pivot Point levels is the following. If the market of the current trading day (period) opens above the Pivot level, then during the trading day (period) buying of the instrument should be preferred. If the market opens with a price lower than the level, the short trades should be preferred.






用户没有留下任何评级信息