• 概述
  • 评论 (1)
  • 评论 (3)

JagzFX Gap Indicator

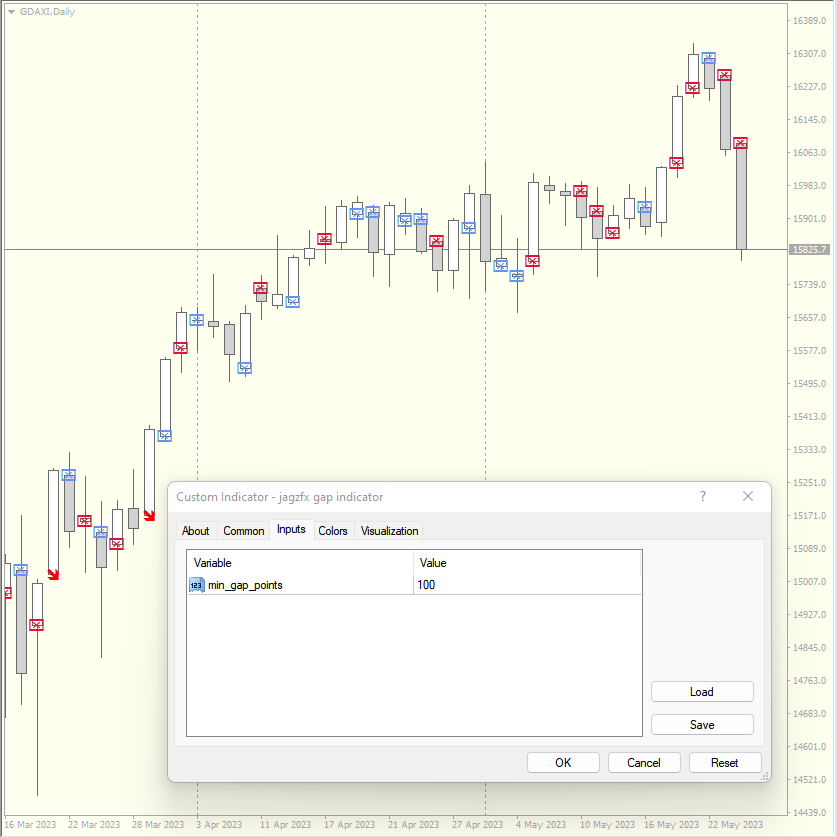
The JagzFX Gap Indicator acts as your vigilant companion, scanning the market with precision and alerting you to the presence of gaps as soon as a new candle is formed.

  • Set your desired gap size, and the indicator will highlight both filled and unfilled gaps, on any symbol and on any timeframe. 
  • By analysing the presence of unfilled gaps, you gain valuable insights into market behaviour, allowing for more informed trading decisions.
  • Combine JagzFX Gap Indicator with JagzFX OnePin to create a market-scanner and instantly find gaps across all the forex pairs or other assets that that you trade.

Unleash the power of gaps ... now!

推荐产品
UPD1 Volume Pixel
Vitaliy Kuznetsov
5 (3)
该指标根据指定的系数找到一个低,高,极端的体积,并用指定的颜色绘制它们。 它取代了metatrader终端中的标准体积绘制功能。 蜡烛也可以在体积的颜色着色。 在具有极端体积的烛台上,确定最大水平体积(cluster/POC)。 根据它的位置(推动,中立,停止),集群也有自己的颜色。 如果集群在阴影中,并且蜡烛有一个极端的体积,那么我们得到一个逆转的箭头。 您可以在设置中启用警报。 此外,指示器中还有一个单独的选项,以阴影显示群集。 输入参数 。 (一些与颜色和视觉设置相关的跳过) 。 基本设置 。 Bars Count – 指标将工作的历史柱数 。 Data Source - 报价时间范围的选择。 如果您认为您认为过去的历史被截断和不完整,那么为您正在研究的仪器下载更多M1报价。 Vertical Step - 影响密度和垂直精度 。 Calc Bars - 用于体积计算的平均蜡烛数 。 Low Volume Factor - 我们固定最小音量的系数。 如果不需要,请将值设置为0 。 High Volume Factor - 我们固定大体积的系数 。 Extreme Volum
The indicator detects and displays М. Gartley's Butterfly pattern. The pattern is plotted by the extreme values of the ZigZag indicator (included in the resources, no need to install). After detecting the pattern, the indicator notifies of that by the pop-up window, a mobile notification and an email. The pattern and wave parameters are displayed on the screenshots. The default parameters are used for demonstration purposes only in order to increase the amount of detected patterns. Parameters z
Program Overview: This program is a trading tool designed to monitor and analyze the 7 major currency pairs. It is a variant of a similar program used for tracking stock indices, but this version focuses on the seven major currency pairs. The program helps in identifying and calculating significant price movements (gaps) between the high and low prices of these currency pairs over a specified time frame. It then provides insights through comments and alerts based on the calculated gaps. Major Cu
Trend Ray
Andriy Sydoruk
The indicator shows the potential trend direction by cyclical-wave dependence. Thus, all the rays of the intersection will be optimal rays, in the direction of which the price is expected to move, taking into account the indicator period. Rays can be used as a direction for potential market movement. But we must not forget that the approach must be comprehensive, the indicator signals require additional information to enter the market.
The indicator detects and displays Shark harmonic pattern (see the screenshot). The pattern is plotted by the extreme values of the ZigZag indicator (included in the resources, no need to install). After detecting the pattern, the indicator notifies of that by a pop-up window, a mobile notification and an email. The indicator highlights the process of the pattern formation and not just the complete pattern. In the former case, it is displayed in the contour triangles. After the pattern is comple
Reversal Monster Mini
Abdulfattah Yahya Mohammed Alhazmi
The Most advanced and comprehensive EA to trade Trend Reversals/Pullbacks It is a very profitable EA, to trade trends breakout, and manage trades, takeprofit, stoploss, move to breakeven, and trailing stop. The   “Reversal Monster EA”   trades Reversal/Pullbacks when the current price of the pair pullback to a predefined horizontal level or trendline on the currency chart. The opening of the position can be immediate after pullback to the drawn trendline or after closing the candle below/above
FREE
Easy Trade indicator
Felipe Carvalho De Queiroz
Easy Trade Indicator – Your Path to Profitable Trades! Work any Time Frame! Maximize your profits with precise and assertive trades! ️ Trade with comfort – the indicator does the analysis and you only open the order in the direction in which the indicator shows you!  Exclusive panel with past trade counter and accuracy tracking! Simplify your analysis, boost your performance, and trade with confidence! Get it now and take your trading to the next level
该指标建立了趋势线的扇形(在单击某个蜡烛之后),类似于经典的江恩角。该指标的特点是它不仅在固定比例上构建角度,而且还使用一定数量柱线的平均价格(可选)。 有两种方法可以计算指标中角度的平均价格(可选): 1) 计算从高到低的平均价格变动(对于一定数量的柱); 2) 计算从开盘到收盘的平均价格变动; 选项: 1.Method——构造角的方法; 2. FixedScale - 固定比例(如果在Method中选择了Fixed_Scale); 3. SecondaryAngles - 控制绘制次角的权限; 4. RayRight - 为趋势线设置射线; 5. DrawBackground - 画线作为背景; 6. AnglesQuantity——角度数; 7. Bars_To_Process - 周期,柱的数量,在此基础上确定平均价格,角度的“速度”。如果为零或更低,则根据所有历史数据计算; 8. RisingMainAnglesClr、RisingSecondaryAnglesClr、FallingMainAnglesClr、FallingSecondaryAngl
FreqoMeterForecast
Stanislav Korotky
The main idea of this indicator is rates analysis and prediction by Fourier transform. Indicator decomposes exchange rates into main harmonics and calculates their product in future. You may use the indicator as a standalone product, but for better prediction accuracy there is another related indicator - FreqoMaster - which uses FreqoMeterForecast as a backend engine and combines several instances of FreqoMeterForecast for different frequency bands. Parameters: iPeriod - number of bars in the ma
Bar Timer Percent
Iurii Tokman
5 (1)
Bar Timer Percent   该指标以百分比形式显示当前柱形成的时间。 指标设置 color_back1 - 背景颜色 # 1 color_flat1 - 背景的边框颜色 #1 color_back2 - 背景颜色 # 2 Alert_Percent - 声音警报的百分比值 Sound_file - 声音文件的名称,自定义声音文件必须位于 Sound 文件夹下的终端文件夹中并具有扩展名 - .wav Bar Timer Percent   该指标以百分比形式显示当前柱形成的时间。 指标设置 color_back1 - 背景颜色 # 1 color_flat1 - 背景的边框颜色 #1 color_back2 - 背景颜色 # 2 Alert_Percent - 声音警报的百分比值 Sound_file - 声音文件的名称,自定义声音文件必须位于 Sound 文件夹下的终端文件夹中并具有扩展名 - .wav
FREE
Pivot Pro MT4
Samil Bozuyuk
5 (3)
Draws Daily, Weekly and Monthly pivots and the respective supports and resistances levels (S1, S2, S3, R1, R2, R3). Ideal for placing stop losses and/or using as a break-out strategy. Features Unlike other pivot indicators in market you get very clean charts. Pivot levels are plotted irrespective of timeframe, on which you trade, i.e. M1, M5, M15, M30, H1,H4 or Daily timeframes. Pivot levels do not change when you change timeframe. Fully customizable options.    If you are looking at Fibonacci
FREE
The indicator detects and displays 3 Drives harmonic pattern (see the screenshot). The pattern is plotted by the extreme values of the ZigZag indicator (included in the resources, no need to install). After detecting the pattern, the indicator notifies of that by a pop-up window, a mobile notification and an email. The indicator highlights the process of the pattern formation and not just the complete pattern. In the former case, it is displayed in the contour triangles. After the pattern is com
BeST Darvas Boxes
Eleni Koulocheri
5 (5)
BeST_Darvas Boxes is an MT4  Indicator based on the trading method developed in the 50’s by the Hungarian Nicolas Darvas . BeST_Darvas Boxes indicator draws the Top and the Bottom of every Darvas Box  that can be confirmed on the current Chart. draws Buy and Sell Arrows  for every confirmed Upwards or Downwards Breakout of the above levels. draws always only after the bar closing and so is non-repainting or backpainting . Note : Every customer who wants to have the older version v_1.75 with th
RTSPattern
Tomas Belak
The indicator provides a superior alternative to price action analysis. It enables the identification of normalized patterns, which are then transformed into a graphical representation to forecast future steps within a time series. In the top-left corner, you'll find information regarding the expected prediction accuracy, determined through a complex MSQE calculation. You have the flexibility to adjust the time window, making it easy to validate the indicator's performance. Additionally, you can
Expert Advisor designed for trading Engulfing Candle Patterns within a manually input price range the D point of harmonic patterns , gartley , bat cypher butterfly ect.  This is the  full version , word test in the title is an error How Does It Work Step 1 Identify a price range around the end point D of your harmonic pattern. Input two prices into the EA settings   Inp9 Upper Level- type the highest price where an engulfing candle pattern can occur. Inp9 Lower Level - type the lowest price whe
FREE
Day Pattern
Oleksandr Martsynyshen
Description: - D ay Pattern - an indicator that helps to identify patterns of price changes for the development of trading algorithms and strategies. For whom this tool? - For developers of trading strategies and algorithms. - Medium- and long-term traders. Time frames H1-W1. Features of the indicator: - There is a function of exporting indicator values to a file of the csv format. - Using the information panel, you can conduct an express analysis of trading tool. - The indicator is sui
Description:  For a comprehensive understanding of our indicators, we invite you to explore the entire Q&A section within this MQL5 blog post   here . The "Divergence Strategy Indicator" is an advanced technical analysis tool designed to identify potential trend reversals and trend continuation opportunities in the market. It leverages the concept of divergence, a powerful phenomenon that occurs when price action diverges from an oscillator, indicating underlying shifts in market sentiment. Spot
PZ Penta O MT4
PZ TRADING SLU
The Penta-O is a 6-point retracement harmonacci pattern which usually precedes big market movements. Penta-O patterns can expand and repaint quite a bit. To make things easier this indicator implements a twist: it waits for a donchian breakout in the right direction before signaling the trade. The end result is an otherwise repainting indicator with a very reliable trading signal. The donchian breakout period is entered as an input. [ Installation Guide | Update Guide | Troubleshooting | FAQ | A
Crypto_Forex 指标“上吊线模式”适用于 MT4。 - 指标“上吊线模式”是价格行为交易的非常强大的指标:无需重绘,无延迟。 - 指标检测图表上的看跌上吊线模式:图表上的红色箭头信号(见图片)。 - 带有 PC、手机和电子邮件警报。 - 指标“上吊线模式”非常适合与支撑/阻力位结合使用。 ................................................................................................................. // 出色的交易机器人和指标可在此处获得: https://www.mql5.com/en/users/def1380/seller 这是仅在此 MQL5 网站上提供的原创产品。
Trend Catcher with Alert
Issam Kassas
4.68 (63)
趋势捕捉器: 具有警示指标的趋势捕捉器策略是一种多功能的技术分析工具,可帮助交易员识别市场趋势和潜在的进出点。它采用动态趋势捕捉器策略,根据市场条件进行调整,清晰地呈现趋势方向。交易员可以自定义参数,以符合其偏好和风险容忍度。该指标有助于识别趋势,发出潜在的反转信号,充当跟踪止损机制,并提供实时警报,以便及时应对市场。 具有警示指标的趋势捕捉器策略是一种多功能的技术分析工具,可帮助交易员识别市场趋势和潜在的进出点。它采用动态趋势捕捉器策略,根据市场条件进行调整,清晰地呈现趋势方向。交易员可以自定义参数,以符合其偏好和风险容忍度。该指标有助于识别趋势,发出潜在的反转信号,充当跟踪止损机制,并提供实时警报,以便及时应对市场。 特点: 趋势识别:信号牛市趋势和熊市趋势。 趋势反转:当蜡烛颜色从牛市变为熊市,反之亦然时,提醒可能的反转。 实时警报:为新趋势识别生成警报。 建议: 货币和货币对:EURUSD,AUDUSD,XAUUSD... 时间框架:H1。 账户类型:任何ECN,低点差账户。
FREE
Gold Phoenix
Yaroslav Varankin
The perfect tool for Scalng in the Forex markets You can trade both from signal to signal and using take profit  The algorithm does not use Zigzag!  No redrawing!  This is a channel instrument that uses a moving average as a filter. Moving Average  There are 2 parameters for the settings Ma Period = 5 period Moving Average  Channel 1.0 distance of channel lines from the chart Price Signal Filter - calculation of signal opening and filter There is a complete set of Alert There is a multi-timefram
Auto Fibo Pro m
DMITRII GRIDASOV
“Auto FIBO Pro” Crypto_Forex 指标 - 是交易中的绝佳辅助工具! - 指标自动计算并放置在图表斐波那契水平和局部趋势线(红色)上。 - 斐波那契水平指示价格可能反转的关键区域。 - 最重要的水平是 23.6%、38.2%、50% 和 61.8%。 - 您可以将其用于反转剥头皮或区域网格交易。 - 还有很多机会可以使用 Auto FIBO Pro 指标来改进您当前的系统。 - 它具有信息价差掉期显示 - 它显示所连接的外汇对的当前价差和掉期。 - 显示屏还显示账户余额、净值和保证金。 - 可以将信息价差掉期显示定位在图表的任何角落: 0 - 左上角,1 - 右上角,2 - 左下角,3 - 右下角。 // 出色的交易机器人和指标可在此处获得: https://www.mql5.com/en/users/def1380/seller 这是仅在此 MQL5 网站上提供的原创产品。
Tipu Panel
Kaleem Haider
4.88 (8)
Tipu Panel series is set of innovative indicators created to consolidate indicators in form of a panel. As a trader, indicators can easily create a cluster on the chart and distract you from the bigger picture. It can also be overwhelming and visually exhausting. Tipu Panel simplifies this by displaying each indicator in a beautifully boxed panel. You can customize the panel to display indicator signals for multiple time frames and also to quickly switch time frames. There are two types of indic
FREE
History Pattern Search
Yevhenii Levchenko
该指标建立当前报价,可以与历史报价进行比较,并在此基础上进行价格走势预测。指示器有一个文本字段,用于快速导航到所需日期。 选项: 符号 - 选择指标将显示的符号; SymbolPeriod - 选择指标从中获取数据的时段; IndicatorColor - 指示器颜色; HorisontalShift - 由指标绘制的报价移动指定的柱数; Inverse - true 反转引号,false - 原始视图; ChartVerticalShiftStep - 图表垂直移动(键盘上的向上/向下箭头); 接下来是文本字段的设置,您可以在其中输入日期,您可以通过按“回车”立即跳转到该日期。 接下来是文本字段的设置,您可以在其中输入日期,您可以通过按“回车”立即跳转到该日期。
Extremum Reverse Bar
Yurij Izyumov
2.8 (5)
This indicator has been created for finding the probable reversal points of the symbol price. A small candlestick reversal pattern is used it its operation in conjunction with a filter of extremums. The indicator is not redrawn! If the extremum filter is disabled, the indicator shows all points that have a pattern. If the extremum filter is enabled, the condition works – if the history Previous bars 1 candles back contains higher candles and they are farther than the Previous bars 2 candle, such
FREE
“可调分形” - 是分形指标的高级版本,非常有用的交易工具! .......................................................................................... - 众所周知,标准分形 mt4 指标根本没有设置 - 这对交易者来说非常不方便。 - 可调分形解决了这个问题 - 它具有所有必要的设置: - 指标的可调周期(建议值 - 高于 7)。 - 价格高点/低点的距离可调。 - 可调分形箭头设计。 - 指标内置移动和 PC 警报。 // 出色的交易机器人和指标可在此处获取: https://www.mql5.com/en/users/def1380/seller 这是仅在此 MQL5 网站上提供的原创产品。
Description:  For a comprehensive understanding of our indicators, we invite you to explore the entire Q&A section within this MQL5 blog post   here . The "Divergence Strategy Indicator" is an advanced technical analysis tool designed to identify potential trend reversals and trend continuation opportunities in the market. It leverages the concept of divergence, a powerful phenomenon that occurs when price action diverges from an oscillator, indicating underlying shifts in market sentiment. Spo
Reversal Pattern Pro
Boonyapagorn Rodvattanajinda
Reversal Patterns Pro Reversal Patterns Pro is a Price Action (PA) analytical tool that scans the reversal patterns.  - Finds and marks the most dependable Japanese candlestick patterns in real-time. - Supports all time frames (Best for Scalping) - Doesn't repaint making it an exceptional indicator for Expert Advisors. Input parameters : - Support & Resistance Mode ( true or false ) for enabling advanced filtering - Donchian Period - RSI Period - RSI Oversold Level - RSI Overbought Level - Al
Major Support and Resistance Indicator
Ahmad Ar Abedalaziz Alazaizeh
This indicator filters the Zigzag indicator to calculate the main support and resistance levels. Variables minimum gap between peaks : is the distance (GAP) between the peaks of the Zigzag peaks sensitivity : Minimum number of nearby peaks look back: it means that it has to test the last 50 peaks in the Zigzag object name perfix: a prefix for level’s line name on chart
FREE
The indicator displays Renko bars on the chart, uses them to plot the ZigZag - trend lines connecting the local Lows and Highs of the price movement, and highlights them based on the Gartley patterns, showing the potential price reversal points. Renko - specialized display of the price action, in which the graph is displayed not every bar of the time frame, but only under the condition that the price had passed more than the specified number of points. Renko bars are not bound to a time frame, s
该产品的买家也购买
Gann Made Easy
Oleg Rodin
4.8 (116)
Gann Made Easy 是一个专业且易于使用的外汇交易系统,它基于使用先生理论的最佳交易原则。 W.D.江恩。该指标提供准确的买入和卖出信号,包括止损和获利水平。您甚至可以使用推送通知在旅途中进行交易。 购买后请联系我!我将免费与您分享我的交易技巧和丰厚的红利指标! 您可能已经多次听说过江恩交易方法。通常 Gann 的理论不仅对于新手交易者而且对于那些已经有一定交易经验的人来说都是非常复杂的东西。这是因为江恩的交易方法在理论上并不那么容易应用。我花了几年时间来完善这些知识,并将最好的原则应用到我的外汇指标中。 该指标非常易于应用。您所需要的只是将其附加到您的图表并遵循简单的交易建议。该指标不断进行市场分析工作并寻找交易机会。当它检测到一个好的入口点时,它会为您提供一个箭头信号。该指标还显示止损和获利水平。 换句话说,当您像先生一样进行交易时,该指标会为您提供最佳江恩建议。江恩亲自告诉你此时此刻该做什么。但最好的部分是您不需要了解任何有关江恩交易原则的知识,因为该指标会为您完成整个市场分析工作。
目前八折优惠! 对任何新手或专家交易者来说都是最好的解决方案! 这个仪表板软件适用于28种货币对。它基于我们的两个主要指标(高级货币强度28和高级货币冲动)。它对整个外汇市场提供了一个伟大的概述。它显示高级货币强度值,货币运动速度和28个外汇对在所有(9)时间段的信号。想象一下,当你可以使用图表上的单一指标观察整个市场,以确定趋势和或剥头皮的机会时,你的交易将得到改善 我们已经在这个指标中建立了一些功能,使你更容易识别强势和弱势货币,同时识别和确认潜在的交易。该指标以图形方式显示货币的强势或弱势是增加还是减少,以及它在所有时间段的表现。 增加的新功能是动态市场斐波那契水平,它适应当前的市场条件变化,这是一个已经在我们的高级货币强度28和高级货币冲动指标中使用的成熟的加分项。 在交易时,总是将弱势货币和强势货币配对,这个新指标将帮助你做到这一点。 用户手册:点击这里  https://www.mql5.com/en/blogs/post/708783 特点  显示每个时间段的ACS28和GAP-speed(冲动)的货币强度值。 列:颜色代码以7种颜色显示货币强度:强势
Gold Stuff
Vasiliy Strukov
4.86 (253)
Gold Stuff 是专为黄金设计的趋势指标,也可用于任何金融工具。 该指标不会重绘,也不会滞后。 推荐时间框架 H1。 在它指标工作全自动专家顾问 EA Gold Stuff。 你可以在我的个人资料中找到它。 重要! 购买后立即与我联系,以获得说明和奖金!   您可以免费收到我们的强力支持和趋势扫描指标的副本,请私信。大部头书! 购买后立即联系我以获得设置和个人奖励!   设置 绘制箭头 - 打开关闭。 在图表上绘制箭头。 警报 - 打开关闭声音警报。 电子邮件通知 - 打开关闭。 电子邮件通知。 Puch-notification - 打开关闭。 推送通知。 接下来,调整色域。 Gold Stuff 是专为黄金设计的趋势指标,也可用于任何金融工具。 该指标不会重绘,也不会滞后。 推荐时间框架 H1。 在它指标工作全自动专家顾问 EA Gold Stuff。 你可以在我的个人资料中找到它。 购买后立即联系我以获得设置和个人奖励!   设置 绘制箭头 - 打开关闭。 在图表上绘制箭头。 警报 - 打开关闭声音警报。 电子邮件通知 - 打开关闭。 电子邮件通知。 Puch
M1 Arrow
Oleg Rodin
5 (17)
M1 Arrow - 基于市场的两个基本原则的盘中策略。 该算法基于使用附加过滤器对交易量和价格波动的分析。该指标的智能算法仅在两个市场因素合二为一时才会发出信号。该指标使用较高时间框架的数据计算 M1 图表上某个范围的波浪。为了确认波浪,该指标使用了成交量分析。 从理论上讲,该指标可以与其他时间框架一起使用,但您需要考虑到该指标最初是为在 M1 上交易而开发的这一事实。 该指标是一个现成的交易系统。交易者所需要的只是跟随信号。此外,该指标可以成为您自己的交易系统的基础。交易仅在分钟图表上进行。 尽管指标使用 MTF 原理,但指标算法尽可能稳定。 购买后,一定要写信给我!我将与您分享我的交易设置和建议!祝您交易成功!感谢您的关注!
Dynamic Forex28 Navigator
Bernhard Schweigert
5 (5)
Dynamic Forex28 Navigator - 下一代外汇交易工具。 当前 49% 折扣。 Dynamic Forex28 Navigator 是我们长期流行的指标的演变,将三种功能合二为一: 高级货币强度 28 指标 (695 条评论)+ 高级货币 IMPULSE 带警报 (520 条评论)+ CS28 组合信号(奖励)。 有关指标的详细信息 https://www.mql5.com/en/blogs/post/758844 下一代强度指标提供什么? 您喜欢的原始指标的一切,现在通过新功能和更高的精度进行了增强。 主要特点: 专有货币强度公式。  所有时间范围内的平滑和准确的强度线。 非常适合识别趋势和精确进入。 动态市场斐波那契水平(市场斐波那契)。  此指标独有的独特功能。 斐波那契应用于货币强度,而不是价格图表。 适应实时市场活动以获得准确的反转区域。 实时市场动量。  第 9 行显示市场是活跃还是被动。 对于定时交易至关重要。 全面的警报和显示。  每种货币最强的买入和卖出动量。 ​​28 对的双重动量买入和卖出。 超买/超卖警告外部范围和止损。 反转
Grabber System MT4
Ihor Otkydach
5 (1)
向您介绍一款优秀的技术指标——Grabber,它是一套即开即用的“全包式”交易策略。 在一个代码中集成了强大的市场技术分析工具、交易信号(箭头)、提醒功能和推送通知。 每位购买该指标的用户还可免费获得以下内容: Grabber辅助工具:用于自动管理已开仓位 视频操作指南:逐步教学如何安装、设置和使用该指标进行交易 原创Set文件:可快速自动配置,帮助实现最佳交易效果 忘掉其他策略吧!只有Grabber能够真正激励你在交易中攀登新高峰! Grabber策略的主要特点: 交易周期:从M5到H4 适用资产:任意,但我推荐我亲自测试过的品种(GBPUSD、GBPCAD、GBPCHF、AUDCAD、AUDUSD、AUDSGD、AUDCHF、NZDUSD、NZDCAD、EURCAD、EURUSD、EURAUD、EURGBP、EURCHF、USDCAD、USDSGD) 交易时间:全天候 24/7 交易效果:我分享自己的真实交易结果,并在此教学如何操作: https://www.mql5.com/ru/market/product/134563?source=Site+Market+MT5+Indic
Scalper Inside PRO
Alexey Minkov
4.76 (63)
!SPECIAL SALE! An exclusive indicator that utilizes an innovative algorithm to swiftly and accurately determine the market trend. The indicator automatically calculates opening, closing, and profit levels, providing detailed trading statistics. With these features, you can choose the most appropriate trading instrument for the current market conditions. Additionally, you can easily integrate your own arrow indicators into Scalper Inside Pro to quickly evaluate their statistics and profitability
Easy Breakout
Mohamed Hassan
5 (10)
After your purchase, feel free to contact me for more details on how to receive a bonus indicator called VFI, which pairs perfectly with Easy Breakout for enhanced confluence!   Easy Breakout is a powerful price action trading system built on one of the most popular and widely trusted strategies among traders: the Breakout strategy ! This indicator delivers crystal-clear Buy and Sell signals based on breakouts from key support and resistance zones. Unlike typical breakout indicators, it levera
Algo Pumping MT4
Ihor Otkydach
5 (4)
PUMPING STATION – 您的专属“全包式”交易策略 我们为您推出PUMPING STATION —— 一款革命性的外汇指标,它将使您的交易变得更加有趣且高效。这不仅仅是一个辅助工具,而是一套完整的交易系统,具备强大的算法,帮助您开始更加稳定的交易。 购买本产品,您将免费获得: 专属设置文件:用于自动配置,实现最大化性能。 逐步视频教程:学习如何使用PUMPING STATION策略进行交易。 Pumping Utility:专为PUMPING STATION打造的半自动交易机器人,让交易变得更加方便和简单。 购买后请立即联系我,我将为您提供所有额外资源的访问权限。 PUMPING STATION如何工作: 趋势监控:能够即时识别市场趋势方向。趋势是您最好的朋友。 进场信号:图表上的箭头会提示您何时进场以及交易方向。 明确的交易目标:指标会自动识别最佳的平仓时机。 回调交易:内置的基于布林带的价格通道可检测修正结束并发出新趋势开始的信号。 效率分析:如果当前设置效果较差,系统会自动提示。只需调整PUMPING STATION,即可获得最佳性能。 功能强大: 推送和邮件通知:即
Enigmera
Ivan Stefanov
5 (7)
ENIGMERA: 市场的核心 重要提示:MQL5.com 演示版本在策略测试器中运行,可能无法完全反映 Enigmera 的功能。请查看描述、截图和视频了解详细信息。如有任何问题,请随时联系我! 该指标的代码已完全重写。版本 3.0 增加了新功能并修复了自指标发布以来积累的错误。 简介 这个指标和交易系统是金融市场的一种独特方法。ENIGMERA 使用分形周期来精确计算支撑和阻力水平。它展示了真实的积累阶段,并提供了方向和目标。无论是在趋势中还是在修正中,这个系统都能工作。 它是如何工作的 指标的大部分功能通过图表左侧的按钮控制,使得能够快速响应不同的市场情况。 按钮 ON/OFF – 显示或隐藏整个指标。 Channel – 激活支撑通道,显示可接受的偏差范围。 Dev1 (第一偏差) – 指示价格在支撑偏差内的波动,信号表示市场正在整合或积累力量。 Dev2 (第二偏差) – 显示价格在偏差之间的波动,表示趋势形成和方向。 Dev3 (第三偏差) – 表示趋势的显著加速和高波动性。 45deg (45度) – 显示市场的节奏和相对于 45 度线的运动稳定性。 Tgt1/2
Scalper Vault
Oleg Rodin
5 (29)
Scalper Vault 是一个专业的剥头皮系统,为您提供成功剥头皮所需的一切。该指标是一个完整的交易系统,可供外汇和二元期权交易者使用。推荐的时间范围是 M5。 该系统为您提供趋势方向的准确箭头信号。它还为您提供顶部和底部信号以及江恩市场水平。无论您拥有何种交易经验,该系统都易于使用。您只需要遵循简单的规则并每天重复该过程。 建议将此系统用于主要货币对。感谢您的关注! 请注意,该指标在策略测试器中可能无法正常工作。因此,我建议仅在模拟或真实账户的真实交易条件下使用该系统。 指示器提供所有类型的警报,包括推送通知。 购买指标后请与我联系。我将免费与您分享我的个人交易建议和出色的奖励指标! 祝您交易愉快,盈利!
Trend Screener
STE S.S.COMPANY
4.78 (93)
趋势指标,趋势交易和过滤的突破性独特解决方案,所有重要趋势功能都内置在一个工具中! 它是 100% 非重绘多时间框架和多货币指标,可用于所有符号/工具:外汇、商品、加密货币、指数、股票。 限时优惠:支撑和阻力筛选指标仅售 50美元,终身有效。(原价 250 美元)(优惠延长) 趋势筛选器是有效的指标趋势跟踪指标,它在图表中提供带有点的箭头趋势信号。 趋势分析器指标中可用的功能: 1.趋势扫描仪。 2. 具有最大利润分析的趋势线。 3.趋势货币强度计。 4. 带有警报的趋势反转点。 5. 带有警报的强趋势点。 6. 趋势箭头 每日分析示例,每日信号表现...等与我们的趋势筛选指标,可以在这里找到: 点击这里 限时优惠:Trend Screener Indicator 仅售 50 美元且终身可用。原价 125$) 通过访问我们的 MQL5 博客,您可以找到我们所有的高级指标以及分析示例、每日信号表现...等。 : 点击这里 我们的趋势系统由 2 个指标组成: 1. Trend Screener Indicator:显示趋势仪表盘、图表中的趋势线、入场点...等。 2. Trend
Apollo Secret Trend
Oleg Rodin
5 (6)
Apollo Secret Trend 是一个专业的趋势指标,可用于查找任何货币对和时间范围内的趋势。该指标可以轻松成为您的主要交易指标,无论您喜欢交易什么货币对或时间框架,您都可以使用它来检测市场趋势。通过在指标中使用特殊参数,您可以使信号适应您的个人交易风格。 该指标提供所有类型的警报,包括推送通知。指示器的信号不要重绘!在提供的屏幕截图中,您可以看到 Apollo Secret Trend 指标与超买/超卖振荡器指标相结合,我将完全免费为您提供。该交易系统可用于日间交易、剥头皮和长期交易。 购买后请联系我免费获得第二个超买超卖震荡指标!我还将为您提供有关如何使用该系统的说明。我还将与您分享丰厚的奖金! 祝您交易愉快,盈利!感谢您的关注!
TPSproTREND PrO
Roman Podpora
4.68 (25)
VERSION MT5        —        ИНСТРУКЦИЯ RUS           —        INSTRUCTIONS  ENG 主要功能: 准确的输入信号,无需渲染! 如果出现信号,它仍然相关!这是与重提指标的一个重要区别,重提指标可以提供信号然后改变信号,这可能导致存款资金的损失。现在您可以以更高的概率和准确度进入市场。还有一个功能是在箭头出现后为蜡烛着色,直到达到目标(止盈)或出现反转信号。 显示止损/获利区域 为了提高搜索切入点时的视觉清晰度,创建了一个模块,该模块最初显示买入/卖出区域,在该区域中搜索进入市场的最佳点。用于处理止损水平的附加智能逻辑有助于随着时间的推移减小其大小,从而降低进入交易(移动 sl)时的初始风险。 显示较高时间范围内的最小值/最大值(MTF 模式) 添加了一项功能,可以显示较高时间间隔的最小/最大校正位置,并显示趋势变化。此外,MIN/MAX 现在有编号,显示修正内容。 风险回报率 (RR) 使用指标算法,可以检测精确的入场点,平均风险回报比超过1k2。这也伴随着视觉效果,例如,收到信号后会出现蜡烛的彩色草图。 无论价
SSM ZakopiecFX Follow The Trend
ROBERT URBANSKI
4.83 (23)
使用我们的自定义MT4指标发现成功外汇交易的秘诀! 您是否曾经想过如何在外汇市场上取得成功,一贯赚取利润,同时降低风险? 这是您一直在寻找的答案! 允许我们介绍我们的专有MT4指标,该指标将彻底改变您的交易方法。 独特的多功能性 我们的指标专为喜欢Renko和Rangebar Candle编队的用户而设计。 我们了解到,这些图表类型受到许多经验丰富的交易者的青睐,这就是为什么我们的指标与它们无缝集成,从而提供无与伦比的市场分析。 清晰的趋势信号 忘记复杂的分析! 我们的指标利用鲜艳的色彩和清晰的点结构来明确指示市场趋势。 红色和蓝色的点毫无疑问地对价格变动的方向留下了疑问,从而可以在您的交易中快速决策。 与HH/HL HL/LL策略对齐 如果您正在寻求一个指标,该指标无缝地与基于HH/HL和HL/LL结构的策略无缝合作,则不需要更多。 我们的工具不仅确定了这些形式,而且还促进了它们在投资过程中的有效利用。 绝对的清晰度和简单性 我们的首要任务是为您提供一种不仅有效而且易于使用的工具。 我们的指标是为了清晰而设计的,使您可以专注于做出投资决策,而不是花时间分析复杂的数据。 由专
Golden Trend Indicator
Noha Mohamed Fathy Younes Badr
4.9 (10)
Golden Trend indicator  is The best indicator for predicting trend movement this indicator never lags and never repaints and never back paints    and give  arrow buy and sell    before the candle appear  and it will help you and  will make your trading decisions clearer its work on all currencies and  gold and crypto and all time frame This unique  indicator uses very secret algorithms to catch the  trends, so you can trade using this indicator and see the trend clear on charts  manual guide and
波浪同步器是波浪分析的可视化指标。结合蜡烛图运动序列并构建定向波浪,与市场一起产生同步运动。 每个波浪的开始都以信号箭头开始,还有警报。 该指标永远不会重绘或移动先前历史记录上的箭头。 信号箭头出现在蜡烛图的收盘价。 适用于任何交易工具和时间框架。 易于使用和配置,仅包含 2 个输入参数:选择与所选参数一起使用的时间框架和计算 MA 线的方法。 推荐的参数可以移动 1-2 个周期。 红色箭头方向用于购买交易资产。 蓝色箭头方向用于出售交易资产。 ----------------------------------------------------------------------------------------------
Lux Trend
Mohamed Hassan
5 (3)
After purchase, please contact me to get your trading tips + more information for a great bonus!   Lux Trend is a professional strategy based on using Higher Highs and Lower Highs to identify and draw Trendline Breakouts! Lux Trend  utilizes two Moving Averages to confirm the overall trend direction before scanning the market for high-quality breakout opportunities, ensuring more accurate and reliable trade signals. This is a proven trading system used by real traders worldwide, demonstrating
FX Power MT4 NG
Daniel Stein
4.94 (18)
FX Power:分析货币强度,助您做出更明智的交易决策 概述 FX Power 是一款专业工具,帮助您全面了解主要货币和黄金在任何市场条件下的真实强度。通过识别强势货币用于买入,弱势货币用于卖出, FX Power 简化了交易决策,并帮助您发现高概率的交易机会。不论您是想跟随趋势还是通过极端的 Delta 值预测反转,这款工具都能完美适应您的交易风格。别再盲目交易——用 FX Power 让您的交易更加智慧。 1. 为什么 FX Power 对交易者极具价值 实时货币和黄金强度分析 • FX Power 实时计算并显示主要货币和黄金的相对强度,助您全面了解市场动态。 • 监控领先或落后资产,轻松识别值得交易的货币对。 全面的多时间框架视图 • 跟踪短期、中期和长期时间框架的货币和黄金强度,以便将您的交易策略与市场趋势保持一致。 • 无论是快进快出的短线交易还是更长期的投资策略, FX Power 都能为您提供所需的信息。 Delta 动态分析用于趋势和反转 • 极端 Delta 值常常预示反转机会,而平缓的 Delta 变化则确认趋势延续。 • 使用 Delta 分析,轻
Volatility Trend System - a trading system that gives signals for entries. The volatility system gives linear and point signals in the direction of the trend, as well as signals to exit it, without redrawing and delays. The trend indicator monitors the direction of the medium-term trend, shows the direction and its change. The signal indicator is based on changes in volatility and shows market entries. The indicator is equipped with several types of alerts. Can be applied to various trading ins
Gold Venamax MT4
Sergei Linskii
2 (1)
Gold Venamax   - 這是最好的股票技術指標。 此指標演算法分析資產的價格變動並反映波動性和潛在的進入區域。 指標特點: 這是一個帶有 Magic 和兩個趨勢箭頭塊的超級指標,可實現舒適且有利可圖的交易。 圖表上顯示用於切換方塊的紅色按鈕。 Magic 在指標設定中進行設置,以便您可以將指標安裝在顯示不同區塊的兩個圖表上。 Gold Venamax 可以放置在具有不同箭頭緩衝區(GV 和 SD)的兩個圖表上。 為此,您需要在設定中選擇不同的 Magic,例如,一個具有 Magic = 999,另一個具有 Magic = 666。接下來,您可以使用圖表上的紅色按鈕選擇箭頭緩衝區。 指標設定中的每個箭頭緩衝區(GV и SD)都有一個單獨的箭頭過濾器,以實現舒適且有利可圖的交易(UseFiltrGV = true; 和 UseFiltrSD = true;)。 進入的最佳訊號 = 遵循兩個緩衝區的訊號箭頭(GV 和 SD)+ 所有三個 MA 線(紅色或藍色)的方向 + TMA 通道邊界(下或上) 。 TMA 通道邊界(下限或上限)也可用於鎖定利潤和/或以較短的停損位進行逆
FX Volume
Daniel Stein
4.6 (35)
FX Volume:从经纪商视角洞察真实市场情绪 简要概述 想要提升您的交易策略? FX Volume 可提供零售交易者和经纪商的持仓实时数据——远早于诸如 COT 之类的延迟报告。不论您希望获得持续稳定的收益,还是想在市场中多一分制胜的砝码, FX Volume 都能帮您识别重大失衡、确认突破以及完善风险管理。立即开启体验,让真实的成交量数据为您的交易决策带来革新! 1. 为什么 FX Volume 对交易者格外有用 极具准确度的早期预警 • 快速捕捉有多少交易者正在买入或卖出某个货币对——比大多数人提前一步。 • FX Volume 是 唯一 能够整合多家零售经纪商真实成交量数据并以简洁方式呈现的工具。 强力风险管理 • 及时识别多头或空头仓位的巨大不平衡,这往往预示着潜在的趋势反转,帮助您更自信地设置止损和目标位。 • 独家而真实的数据让每一次交易决策更具可靠性。 优化进场与出场点 • 发现“过度集中”的交易(大多数交易者都在同一方向),并通过真实成交量来确认突破。 • 避免依赖常见指标可能带来的误导信号,而是利用真实的实时成交量。 适配各种交易策略 • 将 FX
- Real price is 80$ - 40% Discount (It is 49$ now) - Lifetime update free Contact me for instruction, add group and any questions! Related Products:  Bitcoin Expert , Gold Expert - Non-repaint - I just sell my products in Elif Kaya profile, any other websites are stolen old versions, So no any new updates or support. Introduction The breakout and retest strategy is traded support and resistance levels. it involves price breaking through a previous level.  The break and retest strategy is design
Black dragon indicator
Ramil Minniakhmetov
4.86 (119)
趋势检测指标将补充任何策略,也可用作独立工具。 使用该指标的建议,您可以在评论 #8 中下载 好处 易于使用,不会因不必要的信息而使图表过载; 可用作任何策略的过滤器; 具有内置的动态支撑和阻力水平,可用于获利和设置止损; 指标在烛台关闭后不会改变颜色;  适用于股票市场、指数、石油、黄金和所有时间范围; 具有吐司通知、邮件通知、推送通知和声音提醒功能。 我的其他开发可以在这里找到: https://www.mql5.com/zh/users/mechanic/seller 输入参数 Alert - 开/关。警报; Push Notification - 开/关。推送通知; Mail - 开/关电子邮件通知; Fibo 1,2,3,4,5,6,7,11,21,31,41,51,61,71 - 动态支撑和阻力位的设置。
IX Power MT4
Daniel Stein
4.75 (8)
IX Power:解锁指数、大宗商品、加密货币和外汇市场洞察 概述 IX Power 是一款多功能工具,可分析指数、大宗商品、加密货币和外汇市场的强弱表现。 FX Power 提供针对货币对的最高精度,利用所有可用货币对数据进行分析,而 IX Power 专注于基础资产的市场数据。这使得 IX Power 成为非外汇市场的理想选择,同时在需要简单外汇分析时也非常可靠。它可以无缝适用于任何图表,提供清晰的、有行动价值的洞察,帮助提升您的交易决策。 1. 为什么 IX Power 对交易者非常有价值 多市场强弱分析 • IX Power 分析指数、大宗商品、加密货币和外汇市场的强弱表现,为每个市场提供量身定制的洞察。 • 监控 US30、WTI、黄金、比特币等资产的表现,发现交易机会。 适用于更广泛的市场 • 对于外汇交易, FX Power 提供无与伦比的精度,通过分析所有相关货币对。 • IX Power 专注于基础资产的市场数据,非常适合非外汇市场及简化的外汇分析。 实时适应性 • 借助自适应算法, IX Power 实时响应市场数据变化,保持分析的最新性。 • 实时更新
Chart Patterns All in One
Davit Beridze
4.68 (19)
以演示模式试用 "Chart Patterns All in One" 并获得奖励。试用后,请发送消息给我以领取奖励。 购买后留言即可获得8个高质量的指标作为赠品。 Chart Patterns All-in-One 指标帮助交易者可视化技术分析中常用的各种图表形态。它帮助识别潜在的市场行为,但不保证盈利。建议在购买前在模拟模式下测试该指标。 当前优惠 : “Chart Patterns All in One” 指标享受 50% 折扣。 包含的形态 : 1-2-3 形态 :通过三个关键点(高点或低点)检测市场反转。 买入 :连续两个低点后出现较低的高点。 卖出 :连续两个高点后出现较高的低点。 可视化 :线条和箭头连接识别的点。 双顶和双底 :当价格形成两个连续的高点(双顶)或低点(双底)且它们大致相等时,表明反转趋势。 双顶 :看跌反转。 双底 :看涨反转。 可视化 :线条连接峰值或低谷,箭头标记反转点。 三顶和三底 :与双顶/双底类似,但有三个连续的高点或低点,信号更强的反转趋势。 三顶 :看跌反转。 三底 :看涨反转。 可视化 :线条和箭头标记形态。 三角形 :在趋势延续前识别
Order Blocks ICT Multi TF MT4
Diego Arribas Lopez
5 (2)
[ MT5 Version ]  [ Kill Zones ]  [ SMT Divergences ] How to trade using Order Blocks:  Click here User Interface Performance:  During testing in the strategy tester, the UI may experience lag. Rest assured, this issue is specific to the testing environment and does not affect the indicator's performance in live trading. Elevate your trading strategy with the  Order Blocks ICT Multi TF  indicator, a cutting-edge tool designed to enhance your trading decisions through advanced order block analys
Volumatic VIDyA MT4
Duc Hoan Nguyen
5 (3)
Special offer : ALL TOOLS , just $35 each! New tools   will be   $30   for the   first week   or the   first 3 purchases !  Trading Tools Channel on MQL5 : Join my MQL5 channel to update the latest news from me Volumatic VIDYA (Variable Index Dynamic Average) 是一款高级指标,旨在跟踪趋势并分析每个趋势阶段中的买卖压力。通过使用可变指数动态平均值 (Variable Index Dynamic Average) 作为核心动态平滑技术,该工具在关键市场结构水平上提供了关于价格和交易量动态的重要洞察。 查看更多 MT5 版本:  Volumatic VIDyA MT5 查看更多产品:    所有产品 To use iCustom for EA, please see here:  Create EA (iCustom) with VO
Gold Trend 4
Sergei Linskii
黄金趋势   - 这是一个很好的股票技术指标。该指标算法分析资产的价格走势,并反映波动性和潜在进入区。 最佳指标信号: - 卖出 = 红色柱状图 + 红色短指针 + 同方向黄色信号箭头。 - 买入 = 蓝色柱状图 + 蓝色多头指针 + 同方向水蓝色信号箭头。 该指标的优点 1. 该指标生成的信号准确度高。 2. 只有当趋势发生变化时,才能重新绘制已确认的箭头信号。 3. 您可以在任何经纪商的 MetaTrader 4 交易平台上进行交易。 4. 您可以交易任何资产(货币、金属、加密货币、股票、指数等)。 5. 最好在 H1 时间框架(中期交易)上进行交易。 6. 在指标设置中可更改个别参数(TF、颜色等),以便每位交易者都能轻松定制适合自己的指标。 7. 该指标既可作为交易系统的主要补充,也可作为独立的交易系统使用。   注意:交易的入場準確性和盈利能力僅取決於交易者的技能。 任何指標都只是交易者的助手,而不是行動指南。黃金法則 - 根據趨勢開單,獲利並等待下一個最佳訊號。 MetaTrader 5 黄金趋势指标版本  祝大家交易好运,稳定盈利!
PZ Order Block
PZ TRADING SLU
订单块的个人实现,一种简单而有效的头寸交易策略。如果价格范围没有在与突破相反的方向被突破,则交易者应进入市场或在最后一个订单块的方向上寻找交易。为清楚起见,未绘制开放块。 [ 安装指南 | 更新指南 | 故障排除 | 常见问题 | 所有产品 ] 一个看涨的开盘是在一个新的市场低点之后的第一个看涨柱 看跌的开盘是在新的市场高点之后的第一个看跌柱 当打开的块被破坏时出现信号,成为订单块 当一个订单块被打破到相反的一侧时,它就变成了一个反转块 该指标实施各种警报 它不会重新粉刷或重新粉刷 输入参数 周期:创建新高或新低所需的柱线数量。较小的值会产生更多的信号。 最小 ATR 过滤器:订单块栏的最小主体尺寸,表示为 ATR 的乘数。 Max ATR Filter:订单块的最大主体尺寸,表示为 ATR 的乘数。 颜色:设置线条和箭头的颜色和大小。 警报:启用显示/电子邮件/推送/声音警报。 支持和问题 使用帮助台解决问题或及时获得支持。写一封电子邮件至:help@pointzero-trading.com。 作者 Arturo López Pérez,私人投资者和投机者、软件工程师和 P
作者的更多信息
Discover the ultimate trading solution - Expert ONE! Say goodbye to needing a coder and hello to configurable trading strategies that can be customized in thousands of different ways. Expert ONE is the game-changer you've been waiting for, built on the reliable foundation of Jagzfx's proven software products like pinTrader, OnePIN, and MUX. With advanced features like risk management, position sizing, profit averaging, trailing stop, and weekly and intraday sessions, Expert ONE allows you to tai
Volatility Channel from JagzFX helps you find breakouts by displaying a channel on the price chart. Volatility Channel is simple to use - there are no parameters - and works on any timeframe. BASIC USE of Volatility Channels The channel can be used as a 'No Trade Zone': you don't trade when the price is inside the channel. However: When the price breaks above the channel: go Long. When the price breaks below the channel: go Short. The indicator works on all timeframes to suit your trading style.
FREE
Transform indicators into trading signals JagzFX OnePin Basic allows a wide range of MT4 Custom Indicators to be transformed into multi-symbol trading signals without the need to write any code. You can use OnePin to create 'At A Glance' dashboards showing your preferred technical indicators and even send buy/sell signals to a PIN compatible dashboard just as JagzFX pinTrader. Whilst I have tried to limit the amount of technical jargon needed to use this PIN, there are a few terms that might nee
What is the RVOL Indicator? It is well established that volume (including tick volume) is a valuable indicator of trader commitment to a price movement. The challenge with using volume for intraday trading is that there is a general cycle of increasing and decreasing volume associated with the different regional trading sessions. The Relative Volume, or RVOL, indicator helps to overcome this by comparing the current volume with the average volume for that time of day, calculated over a period o
Elevate your trading with the JagzFX Market Regime Filter—adapt, optimize, succeed in navigating through smooth or volatile price movements. Gain a deeper understanding of market dynamics to refine your strategy and make informed decisions. KEY FEATURES Price Action Analysis: Distinguishes between smooth and volatile price movements. Trend Identification: Pinpoints bullish or bearish trends with precision. Strength Assessment : Evaluates the strength of identified trends—whether strong or weak M
筛选:
Elijah Montefalco
185
Elijah Montefalco 2024.05.31 03:41 
 

用户没有留下任何评级信息

JAGZFX LTD
1149
来自开发人员的回复 Robert Andrew Jagger 2024.07.25 21:23
Thank you for the feedback. I am pleased to hear you have found this useful.
回复评论