• 概述
  • 评论
  • 评论
  • 新特性

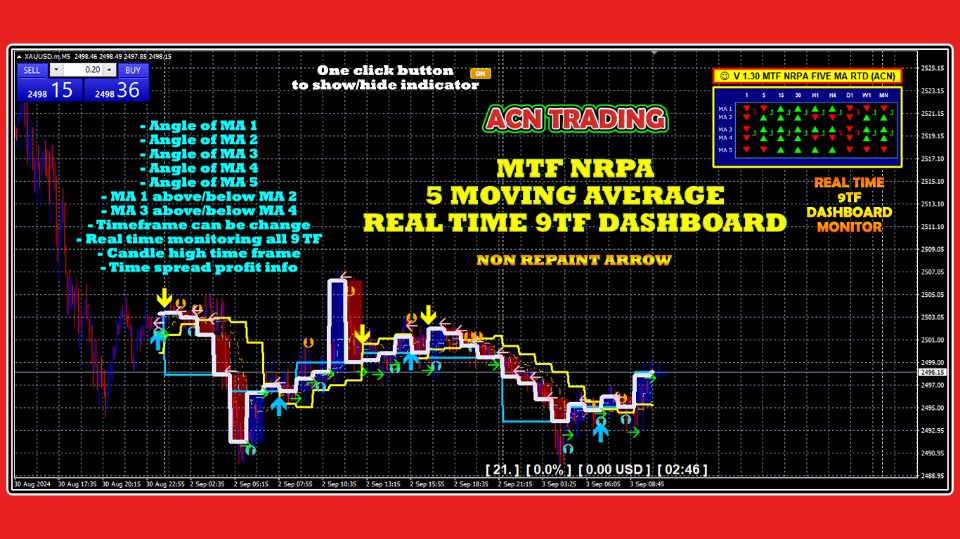
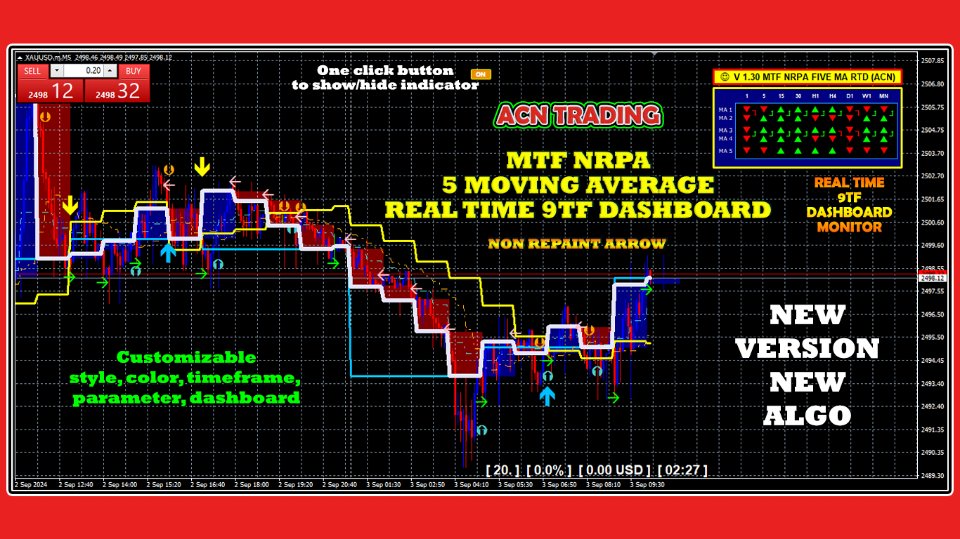
MTF Non Repaint Arrow Five Moving Average RTD

[V 1.00] MTF NRPA 5 移动平均 RTD 已发布!

非重绘箭头实时仪表板。

如果您正在寻找最好的移动平均线指标,那么您来对地方了。 通常人们会设置两条移动平均线,因为两条移动平均线的交点(交叉)将决定下一个价格趋势的方向。 如果快速移动平均线与慢速移动平均线相交且快 > 慢则趋势向上。 相反,如果快速移动平均线与慢速移动平均线相交且快 < 慢,则趋势向下。 两条均线的缺点是看不到长期趋势。 这就是我开发此交易工具的原因。

解释如下:

在这个交易工具中,我使用了五个移动平均线。 是的,五个! 默认情况下,我将 MA 1 和 MA 2 设置在较大的时间范围内,即 H1。 MA 1 和 MA 2 的交集意味着 H1 时间帧上有趋势变化。 然后 MA 3 和 MA 4 我在当前时间范围(小)上设置,例如,您在 M5 上打开图表。 MA 3 和 MA 4 的交叉点表示当前时间范围 (M5) 有趋势变化。 然后为了确认趋势运动,我在当前时间范围内设置了 MA 5。

这个交易工具有很多令人惊奇的东西:

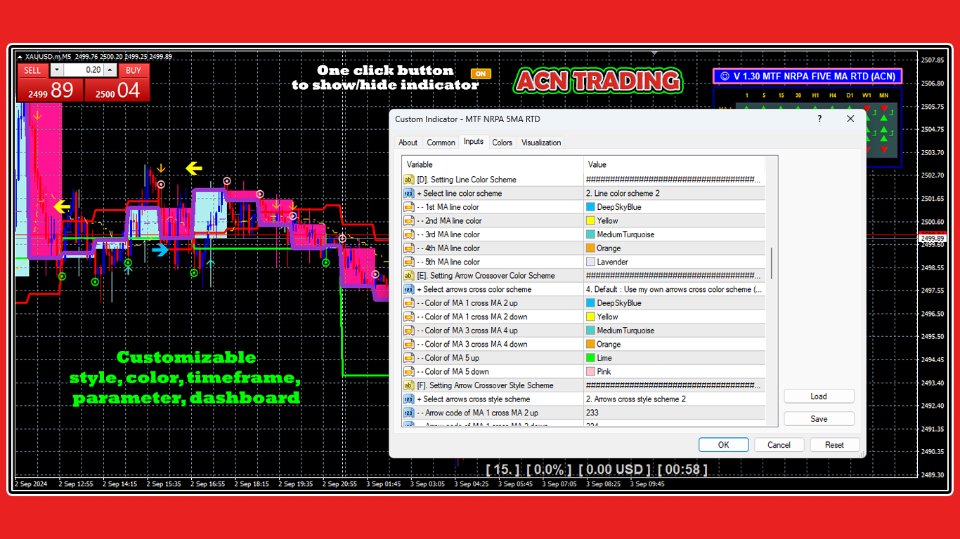
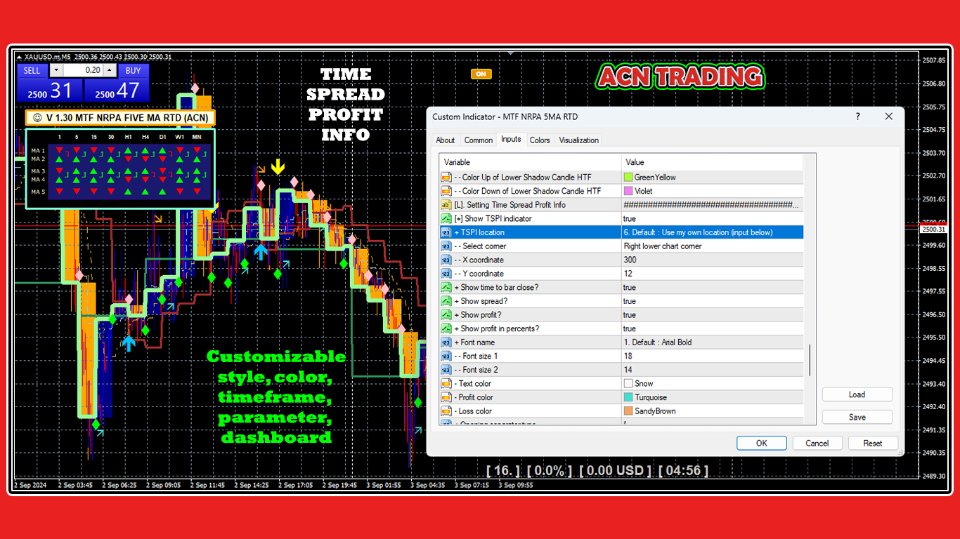
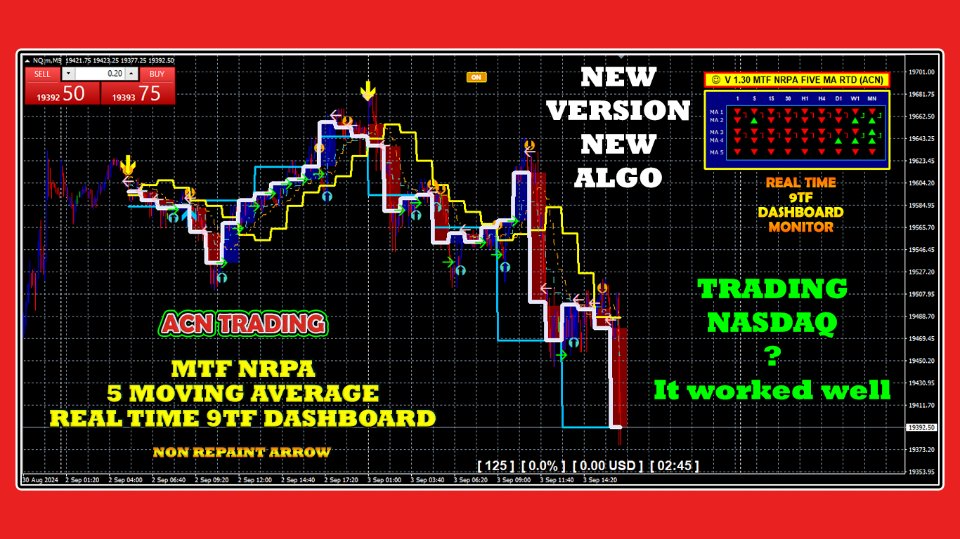
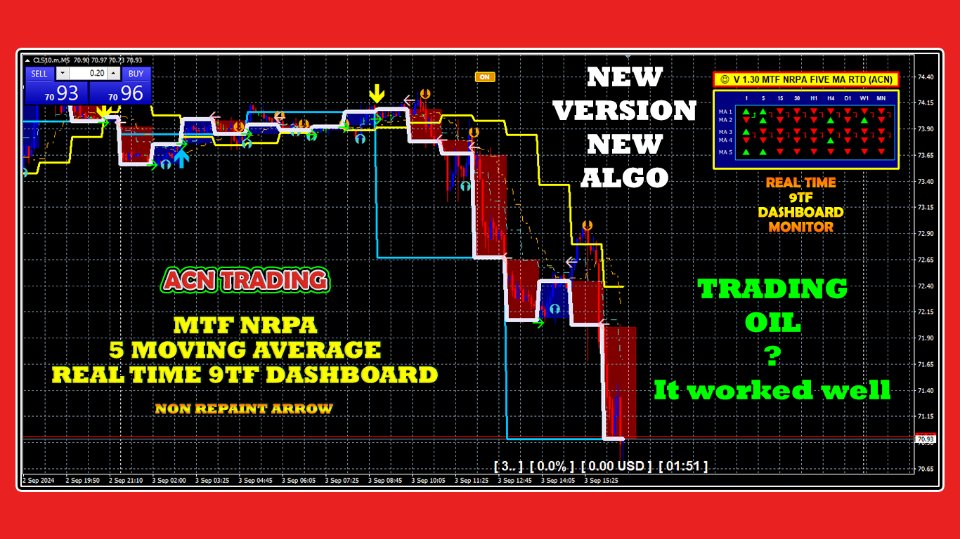
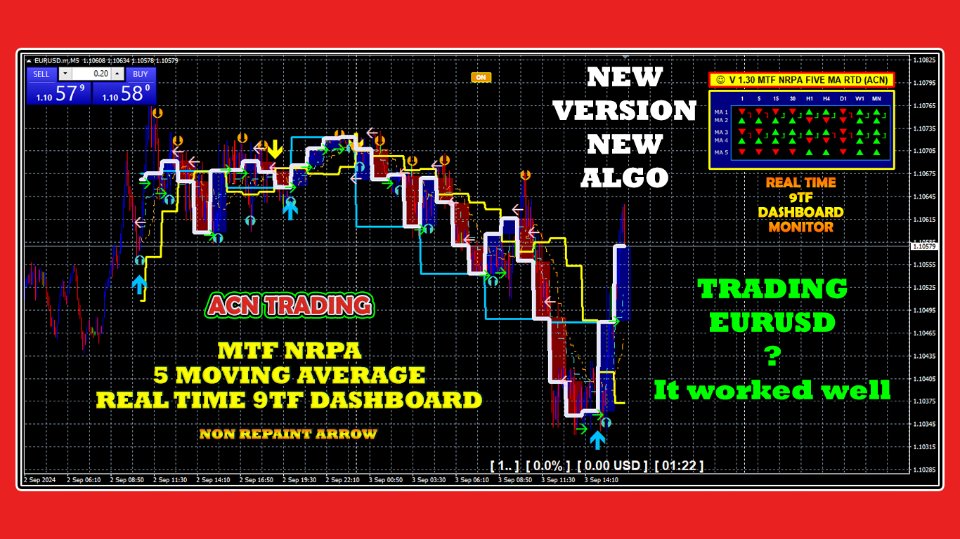
您可以根据自己的喜好更改五个 MA 的时间范围。 您可以更改线条样式,可以更改颜色样式,可以更改 MA 交叉点箭头类型,还可以根据自己的喜好更改 MA 参数。 更好的是五个 MA 的实时 9TF 仪表板监视器。 有 10 种仪表板配色方案可供应用。 好的,现在让我解释一下仪表板内的符号。 有两种符号。 三角形符号(上下)和箭头符号(上下)。 青灰色三角形符号表示 MA 角度为正,这意味着趋势向上。 而红色三角形符号表示 MA 角度为负,这意味着下降趋势。 此外,您可以观察 MA 1 是高于还是低于 MA 2,以及 MA 3 是高于还是低于 MA 4。这可以从向上或向下的箭头符号看出。 还有更多。 按钮功能。 通过单击按钮,您可以一键隐藏或显示此指示器!

这确实是您必须拥有的交易工具。

赶在价格上涨之前购买此交易工具!

自信入场,像专业人士一样交易。

谢谢。

#movingaverage #movinaveragetradingstrategy #exponential #tradingindicators #tradingforex #tradingtips #bestindicator
推荐产品
This Indicator is use the ZigZag to calculate the Upper and  Lower Bound and the uptrend and the downtrned. Red for downtrend, Green for uptrend and Yellow is for the horizontal trend this horizontal trend also bookmarked the upper limited and the lower limited the the price swings.  Or in simple the Support and the Resistance level. However, You may use the Heikin Ashi to confirm the trend of the buy sell signal above. I cannot guarantee the win rate, Nevertheless, you must study well the timef
Max Volume
Maksim Slovakov
Подкрашивает аномально большие тиковые объёмы в красный цвет. Имеет следующие настройки: "Процент" по умолчанию "70"  (Процент на который аномальный объём должен быть больше предыдущего) "Уровень" по умолчанию "500" (Количество тиков, больше которого будем брать во внимание аномальный объём) Внимание! Данный индикатор был разработан для мелких таймфреймов M1,M5,M15. Идея в том, что на таких Таймфреймах увеличение количества тиков говорит об увеличении количество сделок, увеличения интереса к цен
Swing Master Indicator
Elias Mtwenge
5 (1)
Dear Traders this is my another tool called " Swing Master Indicator ". As the name above the indicator is designed to help you in swing trading by capturing the low and highs of the price. You may us this tool with any trading strategy and style from scalping to position trading. It is made for level of traders including newbies and advanced traders even prop-firms, hedge funds and banks to help them make sold market analysis. I create tools for serious traders who want to make a difference in
Boba Binary
Anthonius Soruh
5 (1)
Result look on  https://t.me/BonosuProBinary Pair : All Forex Pairs Time Frame : M1 Expaired : 1-2 Minutes Trade Time Once Time a Day Backtester, Alert Avaliable Average Signals Generate 5 - 20 Signals All Pair A Day Broker Time Zone GMT+3 Default Setting [Example Broker GMT+3 : Alpari, FBS, XM] Support Broker : Deriv, IQOption, Alpari, Binomo, Olymtrade, Qoutex, GCoption, etc Support Auto Trading : MT2 Trading, Binary Bot, Intrade Bot, Binomo Bot, Olymptrad Bot, MX2 trading, Price Pro, etc Ind
Cota Binary
Anthonius Soruh
5 (2)
Result look on  https://t.me/BonosuProBinary Pair : All Forex Pairs Time Frame : M1 Expaired : 1-2 Minutes Trade Time Once Time a Day Backtester, Alert Avaliable Average Signals Generate 5 - 20 Signals All Pair A Day Broker Time Zone GMT+3 Default Setting [Example Broker GMT+3 : Alpari, FBS, XM] Support Broker : Deriv, IQOption, Alpari, Binomo, Olymtrade, Qoutex, GCoption, etc Support Auto Trading : MT2 Trading, Binary Bot, Intrade Bot, Binomo Bot, Olymptrad Bot, MX2 trading, Price Pro, etc Ind
Bomb Bank Signal
Igor Pereira Calil
5 (1)
炸彈銀行訊號:您對 MetaTrader 4 的信心指標 Bomb Bank Signal 是 MetaTrader 4 的一個強大指標,旨在識別金融市場中最相關的趨勢。如果您正在尋找一種能夠準確預測運動的工具,那麼炸彈庫就是您需要的盟友。 運作原理: 該指標結合了三種不同的方法——成交量分析、蠟燭收盤價和對稱趨勢——來偵測和發出買賣機會訊號。當炸彈銀行識別出買入機會時,它就像一顆「炸彈」;當它偵測到賣出訊號時,它就像一個「頭骨」。 為什麼炸彈銀行不一樣? 完全可靠性:炸彈庫訊號不會刪除訊號。訊號一旦發出,就會一直存在,確保您不會錯過任何機會。 極為準確:炸彈庫不會發出錯誤訊號。它會即時更新您的訊息,隨著市場的變化進行調整,但保持先前訊號的透明度。 即時更新:訊號被即時識別並在必要時更新,使您能夠快速響應市場變化。 最大化您的結果: 炸彈銀行訊號是識別趨勢持續走勢的理想選擇。例如,如果您已經做空並且指標在 M15 發出買入訊號,那麼現在就是平倉或部分下單的最佳時機,反之亦然。 此外,經過仔細分析,我們建議您遵循M30、H1和H4上的訊號,停損僅50點。這使
Candles Master
Montoya Fernandes Martins Bani Antonio Fernando
发现我们创新的MetaTrader 4专家顾问——Candles Master 这款强大的机器人使用先进的机器学习算法、神经网络和日本蜡烛图形模式,为您提供对您首选时间框架的市场走势的准确预测。 非常重要的是,在策略测试仪和模拟账户上测试此策略,以分析其性能并根据您的需求进行调整。 突出特点: 基于机器学习、神经网络和日本蜡烛图形的策略。 可自定义的交易时间,以适应您的方便。 通过禁用多货币选项并将其附加到图表,即使它并非专为此功能而设计,也可以交易多种货币对。 适用于所有时间框架,最佳关注M1。 直观且可自定义的设置,可根据您的喜好调整专家顾问。 在初始资金为10,000美元的标准账户上进行测试,并使用0.01手的初始仓位。 风险和支持: 我们的策略经过严格的模拟和真实账户测试,以提供最佳的性能。然而,请注意,设置的微小调整可能会显著影响您的交易。了解涉及的风险非常重要,永远不要投入超出您愿意承受的资金。 我们在这里为您提供设置和解答您的问题的支持。祝您在使用Candles Master进行交易时取得巨大成功!
The King of Forex Trend Cloud Indicator is a trend following indicator based on moving averages. The Indicator is meant to Capture both the beginning and the end of a trend. This indicator can be used to predict both short and long terms market trends.  The king of Forex Trend Cloud if paired together with the King of Forex Trend Indicator can give a broad picture in market analysis and forecasts. I have attached images for both the  The king of Forex Trend Cloud on its own and  The king of Fore
This indicator prepared by using 311,1298 days Haskaya Trend Bandse and Calculates the strand ADX.    This system can be used for 5M time frame.     This system is for Long term and profitable.    Signals are shown as arrows. as an optional,    you can set a voice alarm or email notification    You can fins our other products from link : https://www.mql5.com/en/users/drbastem/seller    Also, you can ask all your questins from email : haskayafx@gmail.com or mobile : +90 530 867 5076 or @Meh

Al in one level
Kundan Kumar Srivastava
5 (1)
This indicator is collection of important dynamic support and resistance giving a trader crystal clear idea , where to sell and where to buy. it completely complements trend lines, support, resistance, and sideways market and allow a trader to make sustainable profits. The thickness of lines suggests its strengths, the thicker the dynamic line, the stronger is rejection or pullback allowing a trader to make multi-fold profit, as they can clearly see them. Introducing Your Ultimate Trading Edge
Arbitrage Thief Index
Philip Pankaj Suthagar
4.35 (23)
"It's not about how much you do, but how much love you put into what you do that counts." - Mother Teresa Unlock the ultimate trading advantage today with the Arbitrage Thief Index. Throughout my successful trading career, this powerful indicator has been my secret weapon for securing perfect entry and exit points, ensuring consistent and safe profits. Now, I'm excited to share this revolutionary strategy with you. Top fund managers diversify their trades across multiple instruments to build a
Some informations on the chart with the single attachment. RangeBorder Buy Sell (RBBS) Non Repaint Indicator will provide trend line, buy sell arrows,reversal arrows, range channel, order exit area,high average price line and low average price line.All arrows and lines don't repaint and not lagging. Once candle closed it won't  repaint. Reading Indicator: 1. Small Stars , Indicates oversold and overbought with certain logic and price may reverse when this small star triggers. Useful to identif
Impulse fractals indicator - is counter-trend oriented complex market fractal pattern.  Market creates bull/bear impulse, trend starts, fractals on impulsed wave are an agressive pullback signals. Buy arrow is plotted when market is bearish and it's impulse showed up-side fractal, and sell arrow is plotted when market is bullish and it's impulse showed dn-side fractal. Main indicator's adjustable inputs : impulsePeriod - main period of impulse histogram  filterPeriod  - smoothes impulse accordi
使用此交易工具,您可以同时扫描 15 个市场。 介绍新的交易指标 2024: ️ 仪表板多货币多时间框架随机。 我创建这个交易工具至少有两个原因: 首先,我厌倦了只观察一个市场。 其次,我不想失去进入另一个市场的时机。 这就是为什么我想同时了解其他市场状况。 因此,我需要一台可以同时扫描多个市场状况的扫描仪。 我经常寻找随机主线>(或<=)随机信号线从M1到H4(或只是M1到M30)的市场。 如果您同意我的分析,那么这就是您一直在寻找的交易指标。 不要错过市场状况满足上述要求的时刻。 这是一个随机扫描仪或仪表板,具有许多出色的功能: 可显示随机主线数据 可显示随机信号线数据 可以显示随机主线和信号线的位置(信号线上方主线或信号线下方主线) 可以显示随机主线和信号线的数据水平(看涨、看跌、趋势向上、趋势向下、超买但仍向上、超卖但仍向下) 可显示从M1到MN1的实时数据 可显示15种货币对的数据(多币种外汇/商品/加密货币/股票) 可定制参数 可定制颜色 OBOS 级别 漂亮的20仪表板配色方案 配备开/关货币对转换器 配备蜡烛高时间框架 配
Garuda Empire
Ellan Dirgantara Tholkhah
The Garuda Empire - Binary Options Experience the epitome of trading synthesis where the time-honored Ichimoku methodology seamlessly intertwines with revered Western indicators. It's a harmonious blend—Europe shaking hands with Japan, a true testament to the power of global financial collaboration. With years of dedicated observation and analysis, I've come to one conclusion: Mastery is achieved through specialization. My journey with the EURJPY has been transformative, leading to the birth of
Trend Ranger XO
Aleksandr Martynov
Аттракцион невиданной щедрости - треть цены! Индикатор отображает на графике другой популярный индикатор XO, представленный на рисунке в подвале. Важно! Сигнальным является 0 бар - не перекрашивается!  Параметры индикатора: Zone Range (Pips)   - размер зоны в пипсах без учета количества знаков; Line or Histogram Width   - ширина линий или гистограммы;    Zone Draw Type  - способ отрисовки зон: в виде гистограммы или линий на графике; Up Zone Color   -  цвет зоны BUY; Down Zone Color   - цвет з
This indicator is created by considering volume divergence with price that is outcome of Bollinger band and Envolpes indicators crossing. It won’t repaint.  It is providing 1 market and three pending orders.  If it is followed with patient, it is providing remarkable profit at the end.  This indicator will be on sale soon on expert advisor. Target is calculated for buy orders as follow 1. 50 pips standard 2. Top Bollinger band 3. Sell Signal Target is calculated for buy orders as follow 1. 50
介绍二元智能系统:您的终极交易伴侣 二元智能系统不仅仅是一个指标,它是一个精心设计的复杂交易工具,为交易者提供精确的交易信号和市场洞察。该系统建立在先进的算法和广泛的技术指标基础上,是您解锁交易成功的关键。 指标组件: 移动平均百分比(MAP):   该组件计算多个移动平均线的加权平均值,为趋势识别提供强大的基础。MAP会根据市场条件动态调整,提供有关当前趋势方向的见解。 商品通道指标(CCI):   CCI通过分析价格偏离平均值来衡量超买和超卖情况。二元智能系统的CCI集成确保了从整体上识别潜在的反转点。 移动平均线收敛/发散(MACD):   系统中的MACD组件超越了简单的价格交叉。它评估MACD线和信号线的收敛和发散,揭示隐藏的交易机会并确认趋势强度。 平均方向指数(ADX):   使用ADX,二元智能系统量化趋势动量。它可以准确地识别强劲的趋势并帮助您避免弱势、不确定的市场阶段,从而增强您的交易决策。 多空力量:   通过这些指标,可以利用多空情绪的综合力量。这对市场情绪的全面了解有助于进行明智的交易入场。 随机指标:   二元智能系统中的随机指标有助于识别超买和超卖情况,并
Smart Awesome Volume
Thushara Dissanayake
5 (1)
Smart Awesome Volume 技术指标旨在通过组合蜡烛图交易量数据并用平均值对其进行过滤以提供准确信号来衡量市场动能。它着重于“量确定价”的概念,使交易者能够轻松识别市场势头以及每根蜡烛内买卖双方之间的战斗。凭借其快速警报系统,交易者可以掌握有价值的交易事件,绝不会错过重要的市场动向。 使用实际交易量信息改进策略的一种方法是使用买家和卖家的交易量来确认突破。这有助于交易者验证潜在的突破机会并做出更明智的交易决策。另一个策略增强是使用交易量信息来确认整体趋势。通过分析交易量数据,交易者可以获得对当前趋势方向的额外信心。最后,交易量信息可用于识别市场的潜在逆转,为交易者提供潜在趋势变化的早期信号。 飞碟策略由 Smart Awesome Volume 指标支持。对于买入条目,指标会寻找特定条件,例如 Awesome Oscillator 位于零线上方、连续的红色直方图,第二个比第一个短,以及紧随其后的绿色直方图。然后,交易者可以在第四根烛台上建立买入头寸。同样,对于卖出条目,指标寻找零线下方的真棒震荡指标、连续的绿色直方图,第二个比第一个短,然后是红色直方图。交易者可以在第四根
Channel Arg Control
Vitalii Zakharuk
The Channel Arg Control indicator, in addition to lines, reflects entry signals in the form of arrows. But how to do that? At first glance, this is not an easy task. But not for the Channel Arg Control indicator, this indicator will tell you whether you have configured the indicator correctly, while you can specify the history interval in the bars that interests you. And yet, how does the indicator tell you? Look at the numbers on the chart near the arrows! This is exactly what you thought, the
This indicator works on MT4 and is very easy to use. When you receive a signal from it, you wait for that candle with the signal to close and you enter your trade at the beginning of the next new candle . A red arrow means sell and a green arrow means buy. All arrows comes with Alert  like for easy identification of trade signal. Are you okay with that? 1 minute candle 1 minute expire
ADX Shark Scalper
Maxwell Ndzoyiya
ADX Shark Scalper – The Ultimate Hybrid Indicator for Precision Scalping Dive into the markets with the ADX Shark Scalper , a powerful and versatile tool designed for traders who seek precision in every trade. This cutting-edge indicator seamlessly combines multiple advanced technical signals into one streamlined system, allowing you to spot good buy and sell opportunities with ease. At its core, the ADX Shark Scalper leverages the power of trend and momentum detection through the integration of
Moving Pivot Average    The pivot indicator compares the selected period with its counterpart from the previous period. The indicator uses very flexible algorithm for pivot value calculating. It allows you to allocate in days a certain time intervals (custom bars) and calculate the average pivot value based on High, Low and Close prices of these bars. How many custom bars will be taken into account is determined by the "Days" setting. The pivot line can be considered an average trend line and us
MR Trend Corrections 4
Sergey Khramchenkov
We publish the indicator as a useful tool in trading and call this indicator the "Swiss Army Knife" because it provides many possibilities and combinations to help understand the material on the "Masters of Risk" trading system. The indicator itself is not part of the tools used in the "Masters of Risk" trading system. The indicator consists of 3 separate multi-timeframe indicators, which in combination with each other help to reduce the "noise" of false signals. The first of the indicators ar
SmartScalper
Oleg Borisov
5 (2)
The easy-to-use trading system SmartScalper generates the following signals: BUY SELL close BUY close SEEL SmartScalper works on the М15 timeframe and is optimized to work on GBPUSD, XAUUSD, GBPJPY, EURJPY, EURUSD. 12 different sets of trading algorithms are designed for trading (6 buy and 6 sell trades), which can be quickly selected by the trader using buttons in the indicator window, or are set in the input dialog. The efficiency of the trading algorithms chosen by the trader is measured in r
Signal M5
Umar Ismail
trading is not a game. trading is business. and the main thing to consider in business is to limit losses. Stop Loss is the lowest price limit set to limit losses. When price movements touch this value, the system will automatically close the order or position. For most traders, the decision to put this stop loss is an uncomfortable choice. Why? because that means they have received the loss. However, every trader has the right to decide for himself which trading model is the most suitable for
Advanced Stochastic Scalper
Evgeny Belyaev
4.53 (15)
Advanced Stochastic Scalper - is a professional indicator based on the popular Stochastic Oscillator. Advanced Stochastic Scalper is an oscillator with dynamic overbought and oversold levels, while in the standard Stochastic Oscillator, these levels are static and do not change. This allows Advanced Stochastic Scalper to adapt to the ever-changing market. When a buy or a sell signal appears, an arrow is drawn on the chart and an alert is triggered allowing you to open a position in a timely mann
Limitless MT4
Dmitriy Kashevich
Limitless MT4 is a universal indicator suitable for every beginner and experienced trader. works on all currency pairs, cryptocurrencies, raw stocks Limitless MT4 - already configured and does not require additional configuration And now the main thing Why Limitless MT4? 1 complete lack of redrawing 2 two years of testing by the best specialists in trading 3 the accuracy of correct signals exceeds 80% 4 performed well in trading during news releases Trading rules 1 buy signa
NOTE: PRICE WILL RISE VERY SOON. DON'T SKIP THIS OFFER! Dear traders I am glad to introduce the " Market Swing Scanner Board" indicator to you. This indicator was made mainly to be used in combination with the Market Swing Index Indicator. You use the  "Market Swing Scanner Board"  indicator to scan for trading opportunities on the  Market Swing Index Indicator . This tool is designed for serious traders who have decided to make a difference through trading. Be the next person to witness this st
MagicIshimoku
Evgeniy Zhdan
The trading robot works on the basis of determining price consolidation zones due to three overlapping Ishimoku indicator readings with different settings according to the Golden Ratio number. This analysis method allows you to predict price movement with high accuracy. Each position has Stop Loss and Take Profit. Each position is controlled by a short trailing stop. Recommended trading tools, 5m: EURUSD, GBPUSD, USDJPY, USDCAD. Settings: MaxRisk - Percentage risk for the calculation of the t
该产品的买家也购买
TrendMaestro
Stefano Frisetti
5 (3)
note: this indicator is for METATRADER4, if you want the version for METATRADER5 this is the link:  https://www.mql5.com/it/market/product/108106 TRENDMAESTRO ver 2.4 TRENDMAESTRO recognizes a new TREND in the bud, he never makes mistakes. The certainty of identifying a new TREND is priceless. DESCRIPTION TRENDMAESTRO identifies a new TREND in the bud, this indicator examines the volatility, volumes and momentum to identify the moment in which there is an explosion of one or more of these data a
Dynamic Forex28 Navigator
Bernhard Schweigert
5 (2)
Dynamic Forex28 Navigator - 下一代外汇交易工具。 当前 49% 折扣。 Dynamic Forex28 Navigator 是我们长期流行的指标的演变,将三种功能合二为一: 高级货币强度 28 指标 (695 条评论)+ 高级货币 IMPULSE 带警报 (520 条评论)+ CS28 组合信号(奖励)。 有关指标的详细信息 https://www.mql5.com/en/blogs/post/758844 下一代强度指标提供什么? 您喜欢的原始指标的一切,现在通过新功能和更高的精度进行了增强。 主要特点: 专有货币强度公式。  所有时间范围内的平滑和准确的强度线。 非常适合识别趋势和精确进入。 动态市场斐波那契水平(市场斐波那契)。  此指标独有的独特功能。 斐波那契应用于货币强度,而不是价格图表。 适应实时市场活动以获得准确的反转区域。 实时市场动量。  第 9 行显示市场是活跃还是被动。 对于定时交易至关重要。 全面的警报和显示。  每种货币最强的买入和卖出动量。 ​​28 对的双重动量买入和卖出。 超买/超卖警告外部范围
目前八折优惠! 对任何新手或专家交易者来说都是最好的解决方案! 这个仪表板软件适用于28种货币对。它基于我们的两个主要指标(高级货币强度28和高级货币冲动)。它对整个外汇市场提供了一个伟大的概述。它显示高级货币强度值,货币运动速度和28个外汇对在所有(9)时间段的信号。想象一下,当你可以使用图表上的单一指标观察整个市场,以确定趋势和或剥头皮的机会时,你的交易将得到改善 我们已经在这个指标中建立了一些功能,使你更容易识别强势和弱势货币,同时识别和确认潜在的交易。该指标以图形方式显示货币的强势或弱势是增加还是减少,以及它在所有时间段的表现。 增加的新功能是动态市场斐波那契水平,它适应当前的市场条件变化,这是一个已经在我们的高级货币强度28和高级货币冲动指标中使用的成熟的加分项。 在交易时,总是将弱势货币和强势货币配对,这个新指标将帮助你做到这一点。 用户手册:点击这里  https://www.mql5.com/en/blogs/post/708783 特点  显示每个时间段的ACS28和GAP-speed(冲动)的货币强度值。 列:颜色代码以7种颜色
TPSpro RFI Levels
Roman Podpora
4.82 (22)
指示       俄罗斯 -        英语   建议 与指示器一起使用     -       TPSpro 趋势专业版 -   MT4版本       交易中的一个关键要素是做出买卖交易工具决定的区域或水平。尽管主要参与者试图隐藏他们在市场中的存在,但他们不可避免地会留下痕迹。我们的任务是学习如何识别这些痕迹并正确解释它们。 主要功能: 向卖家和买家显示活跃区域! 该指标显示所有正确的初始买入和卖出脉冲水平/区域。激活这些水平/区域后,开始寻找切入点,水平会改变颜色并填充特定阴影。此外,还会显示箭头,以便更直观地了解情况。 显示更高时间范围内的级别/区域(MTF 模式) 添加了使用更高时间间隔显示级别/区域的功能。此外,该指标还具有自动趋势检测功能(   TPSproTREND PRO   )。 用于交易的单独专业的逐步算法。 该算法专为日内交易而设计,既可顺势交易,也可逆势交易。每个活动模板均提供详细说明。 适用于多种时间范围 。 TPSpro RFI 水平指标可用于图表上的任何时间范围,从一分钟(M1)开始一直到每月(MN)。 图形和声音警报。 该指标提供图形和声音指示
Connect Indicator
Sukunthakan Ngernbamrung
Connect Indicator is a tool used for connecting indicators between the MQL market and MT4. The connected indicators are made by our group and can be used for other applications, such as sending messages to the Line application or Telegram application. If you have any questions, please don't hesitate to ask us to receive support. Function and indicator buffer Buffer one is the high price of the previous candle. Buffer two is the high price of the previous candle. Usage To connect indicators to fu
Entry Arrow Alerts: Finds market entry opportunities then notifies you via mobile or desktop alerts The key features include: Conservative mode . One entry signal per direction. Ideal for the patient trader looking to capture longer term moves. Aggressive mode . Multiple possible entry signals per direction. Ideal for the active trader looking to capture multiple moves within the same trend. Trigger Line . Price entry line helps cut down on false signals. Display Window . Allows you to instantly
Supply and Demand Dashboard PRO
Bernhard Schweigert
4.8 (20)
目前八折优惠! 这个仪表板是一个非常强大的软件,可用于多个符号和多达9个时间段。 它是基于我们的主要指标(最佳评论:高级供应需求)。 Advanced Supply Demand 该仪表板提供了一个伟大的概述。它显示。   筛选后的供需值,包括区域强度评级。 区间内和区间外的点位距离。 它突出了嵌套的区域。 在所有(9个)时间段内,它对所选符号发出4种警报。 它是高度可配置的,以满足您的个人需求! 您的利益! 对每个交易者来说,最重要的问题是。 什么是入市的最佳水平? 在强大的供应/需求区域内或附近进入你的交易,以获得最佳的成功机会和风险/回报。 我的止损的最佳位置是哪里? 把你的止损放在强势供应/需求区的下方/上方是最安全的。 我的最佳盈利目标是什么? 你的退出策略和你的进入策略一样重要,了解更高的时间框架图可以帮助你。对于买入,使用下一个供应区作为目标,对于卖出,使用下一个需求区作为目标。在回撤到供应区或需求区时进场,以确保有足够的利润空间,达到更高的时间框架的供应和需求,将增加你的利润。 为什么我们要过滤强区和
Apollo Pips PLUS SP
Oleg Rodin
5 (4)
请在购买产品之前阅读下面的信息! Apollo Pips PLUS SP 是一款独特的产品!它适合那些想要获得我的新“APOLLO PIPS”指标以及“超级包”奖金以及访问我所有交易指标的人! 通过购买 Apollo Pips PLUS SP 产品,您实际上购买的是全新版本的 Apollo Pips 指标。此版本的指标具有改进的算法和易于使用的参数,使您有机会在任何市场和任何交易风格中使用该指标。 该产品的购买者还可以免费访问我的所有其他指标,作为我的超级奖励!如果您想获得我所有的交易工具,那么该产品非常适合您!:) 但这还不是全部!:) 该产品的所有购买者也有资格免费获得我的新指标!:) 如果我有一个新的交易指标可用,您将能够在我的特权“SUPER PACK”终身奖金计划中完全免费获得它! 购买后请联系我以获得我的交易提示和超级礼包奖金!
AT Forex Indicator MT4
Marzena Maria Szmit
5 (3)
The AT Forex Indicator MT4 is a sophisticated trading tool designed to provide traders with a comprehensive analysis of multiple currency pairs. This   powerful indicator   simplifies the complex nature of the forex market, making it accessible for both novice and experienced traders. AT Forex Indicator uses   advanced algorithms   to detect trends, patterns and is an essential tool for traders aiming to enhance their forex trading performance. With its robust features, ease of use, and reliabl
SMCpro VIP
Arief
5 (1)
Currently Price 20% OFF ( for unlimited use )   BONUS  AUX VIP Club 2024 : Include  EA Airbag  and  Load Data History  to enhance the performance of this tool to its maximum potential  Click Here to Download Files   ( for users only )   Hello World! Introducing.. SMCpro VIP tool and Indicator for MetaTrader 4, designed to revolutionize your trading experience with the ICT Smart Money Concept. This system is meticulously crafted to empower traders with advanced insights and precision in
Enigmera
Ivan Stefanov
5 (3)
ENIGMERA:市场核心 https://www.enigmera.com 简介 该指标和交易系统是金融市场的一种非凡方法。ENIGMERA 利用分形周期精确计算支撑位和阻力位。它能显示真实的累积阶段,并给出方向和目标。 该系统无论在趋势中还是在修正中都能发挥作用。 它是如何运行的? ENIGMERA 由三条线组成:支撑/阻力线、目标线和偏离线。与一般市场指标将过去的数据推断为现在和未来的情况不同,该系统能提供当前的完整情况。如果你处于支撑位,这意味着真正的支撑;如果你处于阻力位,这意味着真正的阻力。如果突破某一水平,则表示趋势发生变化。没有重绘。 由于市场在不断变化,ENIGMERA 不断调整其评估工具,定期修改策略。  这保证了每种情况都能得到全面评估。这一市场指标的独特性显而易见,其能力不言而喻。  ENIGMERA 为金融分析师和咨询师提供服务,他们需要可靠的见解与客户分享,也为投资者提供服务,他们需要最精确和最可靠的保证。 该系统能够达到最佳精度,使交易者能够自信、清晰地评估他们的选择。 ENIGMERA 将 20 年的交易专长和知识整合到一个综合软件
NAM Order Blocks
NAM TECH GROUP, CORP.
5 (1)
MT4多時限訂單塊檢測指示器。 特徵 -在圖表控制面板上完全可自定義,提供完整的交互。 -隨時隨地隱藏和顯示控制面板。 -在多個時間範圍內檢測OB。 -選擇要顯示的OB數量。 -不同的OB用戶界面。 -OB上的不同過濾器。 -OB接近警報。 -ADR高低線。 -通知服務(屏幕警報|推送通知)。 概括 訂單塊是一種市場行為,它指示從金融機構和銀行收取訂單。著名的金融機構和中央銀行帶動了外匯市場。因此,交易者必須知道他們在市場上正在做什麼。當市場建立訂單塊時,它會像發生大多數投資決策的範圍一樣移動。 訂單建立完成後,市場將朝著上升和縮小的方向發展。訂單大宗交易策略的關鍵術語是它包括機構交易者正在做的事情。由於它們是主要的價格驅動因素,因此包括機構交易在內的任何策略都可以。 您將在任何時間範圍內實時看到訂單塊,使用我們的控制面板,您將能夠在所選的歷史記錄週期內檢測常規,拒收和未大寫的訂單塊。 現在您可以接收到訂單塊接近警報,我們在MT4上顯示屏幕通知,並將通知推送到您的手機!
RelicusRoad Pro
Relicus LLC
4.64 (102)
RelicusRoad 用户手册 + 培训视频 + 访问 Private Discord Group + VIP 身份 一种看待市场的新方式 RelicusRoad 是世界上最强大的外汇、期货、加密货币、股票和指数交易指标,为交易者提供保持盈利所需的所有信息和工具。我们提供技术分析和交易计划,帮助每一位交易者取得成功,从初学者到高级。它是一个关键的交易指标,可以提供足够的信息来预测未来的市场。我们相信一个完整的解决方案,而不是图表上几个没有意义的不同指标。这是一个多合一指标,显示无与伦比且非常准确的信号、箭头 + 价格行为信息。 RelicusRoad 基于强大的人工智能,提供缺失的信息和工具来教育您并使您成为交易专家,成为成功的交易者。 几乎所有技术指标都滞后,这意味着它们只能报告已经发生的事情。因此,他们只确认您过去可以看到的价格已经在哪里。我们相信领先指标可以预测未来价格,而无需重新绘制,也不要过度依赖可能改变并导致重新绘制的滞后指标。如果您根据滞后指标进行交易并建立头寸,您就知道您已经大部分时间在赌博。我们相信,在您考虑建仓之前,您需要了解市场并了解价格变动
The Stochastic Basket Currency Strenght  brings the Stochastic indicator to a new level.  Expanding the boundaries of TimeFrames and mono-currency analysis, the SBCS take the movements of each currency that composes the cross and confront them in the whole basket of 7 crosses.  The indicator works with any combination of AUD, CAD, CHF, EUR, GBP, JPY, NZD, USD pairs and with full automation takes in account every stochastic value (main line) for the selected Time Frame.  After that, the indicator
介绍 ON Trade Waves Patterns Harmonic Elliot Wolfe,这是一款高级指标,旨在使用手动和自动方法检测各种市场模式。以下是它的工作原理: 谐波模式: 该指标可以识别出现在您图表上的谐波模式。这些模式对于练习谐波交易理论的交易者非常重要,正如Scott Carney的书《谐波交易第1卷和第2卷》所描述的那样。无论您是手动绘制它们还是依赖自动检测,ON Trade Waves Patterns都可以胜任。 控制面板: 我们配备了一个用户友好的控制面板,它会保存您的图表和时间帧设置,使您可以轻松切换不同配置。您甚至可以最小化它以最大化图表空间。如果您更喜欢使用其他分析工具,只需单击关闭按钮即可隐藏所有指标数据。 模板保存: 当您自定义设置或添加其他指标,如移动平均线或布林带时,该指标会自动保存您的模板。这意味着您可以随时轻松加载您喜欢的设置。 优化显示: 对于Windows 10用户,我们建议调整您的DPI设置以获得高清设备上的最佳屏幕体验。右键单击MetaTrader图标,选择“兼容性”,然后选择“更改高DPI设置”,将其设置为“系统(增强)”。
Gold Channel XAUUSD
Paulo Rocha
5 (4)
Gold Channel is a volatility-based indicator, developed with a specific timing algorithm for the XAUUSD pair, which consists of finding possible corrections in the market. This indicator shows two outer lines, an inner line (retracement line) and an arrow sign, where the theory of the channel is to help identify overbought and oversold conditions in the market. The market price will generally fall between the boundaries of the channel. If prices touch or move outside the channel it is a tra
(目前 三十% 折扣) 在阅读该指标的描述之前,我只想向您介绍以下概念 移动平均线 - 仅基于一张图表的典型移动平均线。 货币强度线 - 某一货币对的移动平均线,其强度基于 二十八 对。可以说是真正的移动平均线。 移动平均线确实是几乎每个交易者都使用的最受欢迎的指标之一。 货币强度计也是一种基于多种货币的趋势指标。 移动平均货币强度计是一个图表指标,它为您提供带有货币强度计算法的移动平均线。 蓝色线是每个交易者使用的正常移动平均线。而红线是货币强度线。 指标参数 设置 调整时间框架 移动平均时间帧 - 从 M1 到 MN 选择您想要的时间帧 货币行周期 - 货币行的输入周期 *注意:输入“零”表示当前蜡烛。示例:周期为 0 的 D1 表示当前 D1 蜡烛的强度 移动平均线周期 - 移动平均线周期 方法 - 移动平均法 移动平均线移动 - 移动平均线的移动 价格 - 选择要使用的价格类型  点子交叉 - 移动平均线 和 货币强度线 之间的区别,用于判断货币对是趋势还是交叉 显示设置 字体 - 编辑字体 显示或隐藏优势、
Pair Trading Station MT4
Young Ho Seo
3.67 (3)
How to use Pair Trading Station Pair Trading Station is recommended for H1 time frame and you can use it for any currency pairs. To generate buy and sell signal, follow few steps below to apply Pair Trading Station to your MetaTrader terminal. When you load Pair Trading Station on your chart, Pair Trading station will assess available historical data in your MetaTrader platforms for each currency pair. On your chart, the amount of historical data available will be displayed for each currency pai
本指标是实践实战交易完善的波浪自动分析的指标   !  案例... 注: 波浪分级用西方叫法不习惯,因受到缠论(缠中说禅)命名方式习惯的影响,我是将基础波浪命名为 笔 ,将二级波段命名为 段 ,同时具有趋势方向的段命名为 主趋段 (以后笔记中都是这种命名方式,先告知大家),但是算法上和缠论关系不大切勿混淆.反映的是本人分析盘面总结的 千变万化纷繁复杂的运行规律 . 对波段进行了标准化定义,不再是不同人不同的浪  ,   对人为干扰的画法进行了排除,在严格分析进场起到了关键的作用 . 使用这个指标,等于将交易界面提升美感,抛弃最原始的K线交易带你进入新的交易层次.如果不是为了交易,在宣传上也将使客户观感提升层次. 指标内容: 1. 基础波浪 (笔) : 首先我们找出了价格波动过程中的基础波动拐点,当然他的有序性低,为下一步的计算提供基础. 2. 二级波段( 段 ) :在基础波浪的基础上,通过算法分析得到层级更明显的二级波段,二级波段为波浪提供了分析基础 3. 波浪( 浪 ): 有着更清晰的趋势,更清晰直观的方向.分析一个波浪是否延续,需要看二级波段的形态,分析二级的构成,可以
Ultimate Index Advisor 是一款高级工具,旨在精准分析市场走势,并动态识别交易机会。该指标基于针对趋势、修正和反转优化的策略组合提供信号,使其适用于多种交易风格。 借助直观的界面,Ultimate Index Advisor 使用图表上的可见箭头突出显示明确的进场和出场点,消除交易决策中的模糊性。通过利用先进的技术分析策略,该工具适合所有时间框架,为偏好短期或长期操作的交易者提供灵活性。 主要功能: 自动识别趋势和反转。 清晰易读的视觉信号。 适用于各种金融市场和时间框架。 可自定义设置,以匹配您的交易策略。 试试 Ultimate Index Advisor,看看它如何通过清晰的信号和高级分析来支持您的交易决策。
SR arrows liquid lines
Teresinha Moraes Correia
In the fifth update , the indicator now aims to predict the direction of the next candle, issuing a buy or sell arrow precisely when the conditions are met. Since its first version, which showed support and resistance levels on the chart, up to the current version 5, many improvements have been made. One of the key changes is the removal of visual support and resistance levels to prevent memory overload. This is no longer necessary, as arrows are now issued when the price is near or touches t
趋势振荡器:平稳可靠的市场趋势识别 趋势振荡器是一款先进的 MT4 指标,旨在帮助交易者准确识别趋势方向和潜在的反转点。借助直观的视觉呈现,该指标清晰地显示市场处于上升趋势还是下降趋势,从而简化分析并提高图表的可读性。适用于多种市场和时间框架,提供了极大的灵活性以满足不同的交易需求。 趋势振荡器的主要特性和优势 简化的趋势可视化 :趋势振荡器通过颜色变化的线条图形化地展示趋势运动以指示市场方向。蓝色表示上升趋势,黄色表示下降趋势,提供了即时且清晰的趋势读取。 可靠的反转信号 :通过先进算法,指标会生成代表可能反转点的彩色箭头。绿色箭头表示潜在的买入点,而红色箭头表示潜在的卖出点,帮助交易者识别评估进场或出场的关键区域。 适用于任何市场和时间框架 :趋势振荡器在任何市场和不同的时间框架下都能有效运行,提供了适用于所有交易条件的灵活性和多样性。 用户友好,易于使用 :该指标专为易用性而设计,即使是初学者也可以轻松使用。重要信息直接显示在图表上,使得分析更加轻松和即时。 适用于不同的交易风格 :无论您采用的是剥头皮还是短期交易策略,趋势振荡器都能在不同的市场条件下提供支持,适应不同的交易风格
PipTick VSA MT4
Michal Jurnik
1 (2)
The   Volume Spread Analysis indicator   is based on the original Volume Spread Analysis method. It was designed for quick and easy recognition of VSA patterns. Even though this indicator looks very simple, it is the most sophisticated tool we've ever made. It is a really powerful analytical tool that generates very reliable trading signals. Because it is very user-friendly and understandable, it is suitable for every type of trader, regardless of his experience. What is VSA? VSA - Volume Spr
Volume by Price MT4
Brian Collard
4.6 (10)
The Volume by Price Indicator for MetaTrader 4 features Volume Profile and Market Profile TPO (Time Price Opportunity). Volume and TPO histogram bar and line charts. Volume Footprint charts. TPO letter and block marker collapsed and split structure charts. Static, dynamic and flexible range segmentation and compositing methods with relative and absolute visualizations. Session hours filtering and segment concatenation with Market Watch and custom user specifications. Graphical layering, positio
---- Brand New Strategy. Three Month Rent is $30. ONE YEAR RENT ONLY $50. FREE EURUSD VERSION AVAILABLE UNDER << Forecast System Gift >>. NO NEED FOR BACKTEST! Link to the FREE version -->  https://www.mql5.com/en/market/product/110085?source=Site --- This is a simple strategy based on BREAKOUT and FIBONACCI levels. After a breakout, either, the market: - continues the move directly to the 161, 261 and 423 levels, or - retraces to the 50% level (also called a correction) and thereafter continues
System Trend Pro
Aleksandr Makarov
5 (2)
System Trend Pro - This is the best trend trading indicator!!! Black Friday, ask for 20% discount The indicator no repaint!!!   The indicator has   MTF   mode, which adds confidence to trading on the trend (   no repaint   ). How to trade? Everything is very simple, we wait for the first signal (big arrow), then wait for the second signal (small arrow) and enter the market in the direction of the arrow. (See screens 1 and 2.) Exit on the opposite signal or take 20-30 pips, close half of it,
Smart Market Analyser
Elias Mtwenge
5 (1)
REMINDER: Early buyers hot price discount: Price subject to rise after first 20 copies. Starting price $65 and final price will be $1275. Secure your discounted copy Now! Smart Money Analyser Indicator User Manual 1. Introduction Welcome to the   Smart Money Analyser Indicator This powerful tool provides traders with comprehensive market analysis by combining various technical indicators to generate actionable trading signals. Designed to be user-friendly, this indicator helps traders of a
Prometheus Trade Engine is an indicator that combines price action, ratio based indicator with custom indicators& other lagging indicators to create this leading indicator that has a multi-timeframe approach to trading so that you are able to see what other timeframes are doing all in one chart and give you high probability trade setups to assist you to make a prediction on what is MOST likely to happen in the market going foward Chart Features 1. Reversal Zone It is the rectangular box on
POWR Rise Coming
Trade Indicators LLC
This indicator is SO SIMPLE… when the green Rise Coming arrow appears, a price drop may be on the way! Plain and easy profits! As you receive more than one 'Rise Coming' text signal in a downtrend, it means momentum is building larger for a bull run. HOW TO USE 1. When the green "Rise Coming" text appears, a price jump may be on the way! This indicator Never Repaints! To get the best setting it's a matter of tweaking the indicator until it gives you the best results. Our recommendation, and what
ECM Elite Channel is a volatility-based indicator, developed with a specific time algorithm, which consists of finding possible corrections in the market. This indicator shows two outer lines, an inner line (retracement line) and an arrow sign, where the channel theory is to help identify overbought and oversold conditions in the market. The market price will generally fall between the boundaries of the channel. If prices touch or move outside the channel, it's a trading opportunity. The
作者的更多信息
在一个窗口中分析货币对的多个时间范围可能会让您感到困惑。 要分析多个时间范围,您需要可靠的指标。 其中之一是使用 9TF MACD 曲线。 我夜以继日地工作,以创建简单但可靠的代码,并在一个指标中涵盖所有九个时间范围。 让我们看一下该指标的一些优点: 彩色直方图。 每个时间范围内的曲线颜色各不相同。 指示 MACD 主线和信号线交叉的箭头。 (注意:忽略出现的最后一个箭头!) 临界水平线。 实时 9TF 仪表板监视器。 9TF 仪表板监视器计算非常准确,即使您从一个时间范围更改为另一个时间范围也是如此。 监控哪条曲线高于临界水平,哪条曲线低于临界水平。 监控曲线是否主要 MACD 高于信号 MACD,反之亦然。 监控曲线是否有主 MACD 和信号 MACD 之间的交叉。 监视当前信号与先前信号的移动。 在上升或下降的过程中。 (注意:这是剥头皮非常重要的功能!) 一个非常重要的趋势栏功能,用于发现长期趋势。 改变颜色的能力。 能够选择要显示的曲线。 能够选择要显示的直方图。 能够选择显示哪个箭头。 能够将 9TF 仪表板显示器放置在您想要的位置。 只需单击一下按钮
在一个窗口中分析货币对的多个时间范围可能会让您感到困惑。 要分析多个时间范围,您需要可靠的指标。 其中之一是使用 9TF STOCH RSI。 我夜以继日地工作,以创建简单但可靠的代码,并在一个指标中涵盖所有九个时间范围。 让我们看一下该指标的一些优点: 彩色直方图。 每个时间范围内的曲线颜色各不相同。 指示 STOCHASTIC 主线和信号线交叉的箭头。 (注意:忽略出现的最后一个箭头!) OBOS水平线。 实时 9TF 仪表板监视器。 9TF 仪表板监视器计算非常准确,即使您从一个时间范围更改为另一个时间范围也是如此。 监控哪条曲线高于超买水平,哪条曲线低于超卖水平。 监测主 STOCH 是否高于信号 STOCH 的曲线,反之亦然。 监控主 STOCH 和信号 STOCH 之间是否有交叉的曲线。 监视当前信号与先前信号的移动。 在上升或下降的过程中。 (注意:这是剥头皮非常重要的功能!) 监测 RSI 线的运动。 一个非常重要的趋势栏功能,用于发现长期趋势。 改变颜色的能力。 能够选择要显示的曲线。 能够选择要显示的直方图。 能够选择显示哪个箭头。 能够将 9
Analyzing multiple time frames of a currency pair in one window can make you confused. To analyze multiple time frames, you need reliable indicators. One of them is using 9TF RSI MA . I've been working day and night to create code that is simple but reliable and covers all nine time frames in just one indicator .  Let's look at some of the advantages of this indicator: Colorful histogram . The color of the curve in each timeframe is different from one another.  Arrows indicating the crossing of
Analyzing multiple time frames of a currency pair in one window can make you confused. To analyze multiple time frames, you need reliable indicators. One of them is using 9TF MACD Limited Bar . I've been working day and night to create code that is simple but reliable and covers all nine time frames in just one indicator .  Attention! When first installed, the indicator does not look intact. Changing the timeframe will solve the problem. Let's look at some of the advantages of this indicator: C
Analyzing multiple time frames of a currency pair in one window can make you confused. To analyze multiple time frames, you need reliable indicators. One of them is using 9TF STOCH RSI LIMITED BAR . I've been working day and night to create code that is simple but reliable and covers all nine time frames in just one indicator .  Attention! When first installed, the indicator does not look intact. Changing the timeframe will solve the problem. Let's look at some of the advantages of this indicat
在一个窗口中分析货币对的多个时间范围可能会让您感到困惑。 要分析多个时间范围,您需要可靠的指标。 其中之一是使用 9TF Double RSI Double MA。 我夜以继日地工作,以创建简单但可靠的代码,并在一个指标中涵盖所有九个时间范围。 让我们看一下该指标的一些优点: 双 RSI,即 RSI 更快和 RSI 更慢。 双 MA,即更快的 MA 和更慢的 MA。 10 配色方案。 每个时间范围内的曲线颜色各不相同。 RSI 的 OBOS 水平线。 实时 9TF 仪表板监视器。 9TF 仪表板监视器计算非常准确,即使您从一个时间范围更改为另一个时间范围也是如此。 监控哪条 RSI 曲线高于超买水平,哪条低于超卖水平。 监控曲线是否 MA 快线高于 MA 慢线,反之亦然。 监控曲线是否有 MA 快线和 MA 慢线之间的交叉。 监视当前信号与先前信号的移动。 在上升或下降的过程中。 (注意:这是剥头皮非常重要的功能!) 一个非常重要的趋势栏功能,用于发现长期趋势。 改变颜色的能力。 能够选择要显示的曲线。 能够仅显示 RSI、仅 MA、仅显示仪表板等。 能够将 9T
在一个窗口中分析货币对的多个时间范围可能会让您感到困惑。 要分析多个时间范围,您需要可靠的指标。 其中之一是使用 9TF Double CCI Double MA。 我夜以继日地工作,以创建简单但可靠的代码,并在一个指标中涵盖所有九个时间范围。 让我们看一下该指标的一些优点: 双 CCI,即 CCI 更快和 CCI 更慢。 双 MA,即更快的 MA 和更慢的 MA。 10 配色方案。 每个时间范围内的曲线颜色各不相同。 CCI 的 OBOS 水平线。 实时 9TF 仪表板监视器。 9TF 仪表板监视器计算非常准确,即使您从一个时间范围更改为另一个时间范围也是如此。 监控哪条 CCI 曲线高于超买水平,哪条低于超卖水平。 监控曲线是否 MA 快线高于 MA 慢线,反之亦然。 监控曲线是否有 MA 快线和 MA 慢线之间的交叉。 监视当前信号与先前信号的移动。 在上升或下降的过程中。 (注意:这是剥头皮非常重要的功能!) 一个非常重要的趋势栏功能,用于发现长期趋势。 改变颜色的能力。 能够选择要显示的曲线。 能够仅显示 CCI、仅 MA、仅显示仪表板等。 能够将 9T
可以使用准确的 CCI 指标。 仪表板趋势栏智能级别 9TF 双 CCI。 双 CCI,即快速 CCI 和慢速 CCI 为什么需要第二个 CCI? 使用额外的指标将使我们在实时交易中更有说服力 9TF 快速 CCI 曲线 9TF 慢速 CCI 曲线 9TF实时CCI角度 9TF实时CCI值 9TF 实时 CCI 方向/相位 9TF 趋势栏 计算趋势条的新算法 开/关按钮。 只需单击一下即可显示/隐藏指标非常有用 实时 9TF 仪表板监视器 只能显示趋势栏 只能显示 CCI 曲线 只能显示仪表板 能够选择要显示的 CCI 曲线 能够选择趋势的箭头类型 能够选择 obos 线条样式 能够显示/隐藏图例 能够增加/减少栏的数量 能够选择配色方案级别 能够选择多达 10 种仪表板趋势栏配色方案 能够改变 CCI 曲线的颜色 该指标经历了一系列的试验。 编程代码是用心编写的。 使用最好的 DTSL 9TF 双 CCI 交易指标进行自信的输入。 立即获取并像专业人士一样进行交易。 谢谢你。
提供准确的 RSI 指标。 仪表板趋势栏智能级别 9TF 双 RSI。 双 RSI,即快速 RSI 和慢速 RSI 为什么需要第二个 RSI? 使用额外的指标将使我们在实时交易中更有说服力 9TF 快速 RSI 曲线 9TF 慢速 RSI 曲线 9TF实时RSI角度 9TF实时RSI值 9TF 实时 RSI 方向/相位 9TF 趋势栏 计算趋势条的新算法 开/关按钮。 只需单击一下即可显示/隐藏指标非常有用 实时 9TF 仪表板监视器 只能显示趋势栏 只能显示 RSI 曲线 只能显示仪表板 能够选择要显示的 RSI 曲线 能够选择趋势的箭头类型 能够选择 obos 线条样式 能够显示/隐藏图例 能够增加/减少栏的数量 能够选择配色方案级别 能够选择多达 10 种仪表板趋势栏配色方案 能够改变 RSI 曲线的颜色 该指标经历了一系列的试验。 编程代码是用心编写的。 使用最好的 DTSL 9TF 双 RSI 交易指标自信地入场。 立即获取并像专业人士一样进行交易。 谢谢你。
提供准确的 MACD 指标。 仪表盘趋势栏智能级别 9TF 双 MACD。 双 MACD,即快速 (MACD 1) 和慢速 (MACD 2) 为什么需要第二个 MACD? 使用额外的指标将使我们在实时交易中更有说服力 9TF 快速 MACD 1 曲线 9TF 慢 MACD 2 曲线 9TF实时MACD角度 9TF实时MACD值 9TF 实时 MACD 方向提供准确的 MACD 指标。 仪表盘趋势栏智能级别 9TF 双 MACD。 双 MACD,即快速 (MACD 1) 和慢速 (MACD 2) 为什么需要第二个 MACD? 使用额外的指标将使我们在实时交易中更有说服力 9TF 快速 MACD 1 曲线 9TF 慢 MACD 2 曲线 9TF实时MACD角度 9TF实时MACD值 9TF实时MACD方向/相位 9TF 趋势栏 计算趋势条的新算法 开/关按钮。 只需单击一下即可显示/隐藏指标非常有用 实时 9TF 仪表板监视器 只能显示趋势栏 只能显示 MACD 曲线 只能显示仪表板 能够选择要显示的 MACD 曲线 能够选择趋势的箭头类型 能够选择 obos 线条样式 能够显示
提供准确的随机指标。 仪表板趋势栏智能级别 9TF 双随机。 双随机,即快速随机和慢速随机 为什么需要第二个随机指标? 使用额外的指标将使我们在实时交易中更有说服力 9TF 快速随机曲线 9TF 慢速随机曲线 9TF实时随机角度 9TF实时随机值 9TF 实时随机方向/相位 9TF 趋势栏 计算趋势条的新算法 开/关按钮。 只需单击一下即可显示/隐藏指标非常有用 实时 9TF 仪表板监视器 只能显示趋势栏 只能显示随机曲线 只能显示仪表板 能够选择要显示的随机曲线 能够选择趋势的箭头类型 能够选择 obos 线条样式 能够显示/隐藏图例 能够增加/减少栏的数量 能够选择配色方案级别 能够选择多达 10 种仪表板趋势栏配色方案 能够改变随机曲线的颜色 该指标经历了一系列的试验。 编程代码是用心编写的。 使用最好的 DTSL 9TF 双随机交易指标进行自信的入场。 立即获取并像专业人士一样进行交易。 谢谢你。
如果您经常因为只使用一种指标而亏损交易,那么请尝试此交易工具。 该交易工具使用多个指标。 我经常观察只使用 RSI 指标的交易者。 很多时候,市场超卖但仍然下跌,或者市场超买但仍然上涨。 因此,您需要使用多个指标。 隆重推出新版本 V 3.40 MTF PPAAF:多时间框架精确价格行为箭头过滤。 该交易工具使用各种指标来加强市场走势的方向。 该交易工具中使用的第一个指标是双随机指标。 在这里,我使用两种随机指标,即快速随机指标和慢速随机指标。 在快速随机指标中,有一条快速随机指标主线和一条快速随机指标信号线。 同样,在慢随机指标中,有一条慢随机指标主线和一条慢随机指标信号线。 主线和信号线的交叉/交叉将形成向上和向下箭头。 第二个指标是Double RSI,即快速RSI和慢速RSI。 两者相交将形成一个向上和向下的箭头。 第三个指标是Double CCI,即快速CCI和慢速CCI。 两者相交将形成一个向上和向下的箭头。 第四个指标是双MACD。 与双随机指标类似,这里有快速 MACD 和慢速 MACD。 在快速 MACD 中,有一条快速 MACD 主线和一条快速 M
[V 1.00] MTF NRPA 5 RSI RTD 已发布! 非重绘箭头实时仪表板。 如果您厌倦了使用各种 RSI 指标但发现它们不准确,那么试试这个工具。 通常人们只设置 1 个 RSI 来确定一个时间范围内的 OBOS 水平。 坏消息是您无法同时看到不同时间范围内的 OBOS 水平和趋势。 这就是我开发此交易工具的原因。 解释如下: 在这个交易工具上,我使用了五个 RSI。 是的,五个! 默认情况下,我在较大的时间范围内设置 RSI 1 和 RSI 2,即 M30。 RSI 1 和 RSI 2 的交集意味着 M30 时间框架上有趋势变化。 然后我在当前(小)时间范围内设置 RSI 3 和 RSI 4,例如您在 M5 上打开图表。 RSI 3 和 RSI 4 的交集意味着当前时间帧 (M5) 有趋势变化。 然后为了确保趋势运动,我在更高的时间框架 (H1) 上设置了 RSI 5。 当 RSI 5 越过 50 水平(您可以设置时间范围和 OBOS 水平)时,箭头将出现。 这个交易工具有很多令人惊奇的东西: 您可以根据自己的意愿更改五个 RSI 时间范围。
Introducing the advanced trading tools of 2023. MTF PPAAF Model S. This is sub window version of my best trading tool : MTF Precise Price Action Arrow Filtered.  Click here to learn more about MTF PPAAF . This trading tool is equipped with various powerful features : MTF = Multi Time Frame = Time Frame can be changed. On/off button. Non Repaint Arrows.  Customizable parameter, color etc.  Can show all time frame (ATF) crossover arrows of fast stochastic main line & fast stochastic signal line (
If you are curious about the position of the stochastic, RSI, CCI curve, whether it is at the OBOS level or not, then this trading tool is for you. Introducing the advanced trading tools of 2024. ATF Trend Following Trend Bar OBOS. This indicator is similar to MTF PPAAF Model S but have two layers.  Click here to learn more about MTF PPAAFS . This trading tool is equipped with various powerful features : MTF = Multi Time Frame = Time Frame can be changed. On/off button. Customizable parameter,
交易者您好。 介绍我最好的交易工具。 MTF PPAAF T 型。 多时间范围精确价格行为箭头过滤模型 T。  这个交易工具是我多年来制作各种交易工具后最好的作品。 为什么这个交易工具是最好、最可靠的?  1. 该工具使用6个指标:  双倍 CCI = 快 CCI x 慢 CCI 双随机 = 快随机(快随机主线 x 快随机信号线)& 慢随机(慢随机主线 x 慢随机信号线)  双MACD=快速MACD(快速MACD主线x快速MACD信号线)&慢速MACD(慢速MACD主线x慢速MACD信号线) 六条移动平均线 = MA 1 x MA 2 、MA 3 x MA 4 和 MA 5 x MA 6 Dual Double RSI = 快速 DRSI(快速 DRSI 主线 x 快速 DRSI 信号线)& 慢速 DRSI(慢速 DRSI 主线 x 慢速 DRSI 信号线) RSIMA = RSI x MA 2. 实时9TF仪表板监控(第一个仪表板)。 该仪表板将为您提供有关上述 6 个指标数据的实时信息。  主线是在信号线之上还是
使用此交易工具,您可以同时扫描 15 个市场。 介绍新的交易指标 2024: ️ 仪表板多货币多时间框架随机。 我创建这个交易工具至少有两个原因: 首先,我厌倦了只观察一个市场。 其次,我不想失去进入另一个市场的时机。 这就是为什么我想同时了解其他市场状况。 因此,我需要一台可以同时扫描多个市场状况的扫描仪。 我经常寻找随机主线>(或<=)随机信号线从M1到H4(或只是M1到M30)的市场。 如果您同意我的分析,那么这就是您一直在寻找的交易指标。 不要错过市场状况满足上述要求的时刻。 这是一个随机扫描仪或仪表板,具有许多出色的功能: 可显示随机主线数据 可显示随机信号线数据 可以显示随机主线和信号线的位置(信号线上方主线或信号线下方主线) 可以显示随机主线和信号线的数据水平(看涨、看跌、趋势向上、趋势向下、超买但仍向上、超卖但仍向下) 可显示从M1到MN1的实时数据 可显示15种货币对的数据(多币种外汇/商品/加密货币/股票) 可定制参数 可定制颜色 OBOS 级别 漂亮的20仪表板配色方案 配备开/关货币对转换器 配备蜡烛高时间框架 配
使用此交易工具,您可以同時掃描 15 個市場。 介紹新的交易指標 2024: ️ 儀表板多貨幣多時間框架雙 CCI。 我創建這個交易工具至少有兩個原因: 首先,我厭倦了只觀察一個市場。 其次,我不想失去進入另一個市場的機會。 這就是為什麼我想同時了解其他市場狀況。 因此,我需要一台可以同時掃描多個市場狀況的掃描器。 我經常尋找快速 CCI 線 >(或 <=)慢速 CCI 線從 M1 到 H4(或只是 M1 到 M30)的市場。 如果您同意我的分析,那麼這就是您一直在尋找的交易指標。 不要錯過市場狀況滿足上述要求的時刻。 這是一個隨機掃描器或儀表板,具有許多出色的功能: 可顯示快速CCI線數據 可顯示慢速CCI線數據 可顯示快CCI線和慢CCI線的位置(快線在慢線上方或快線在慢線下方) 可顯示快速CCI線和慢速CCI線的數據水準(看漲、看跌、趨勢向上、趨勢向下、超買但仍向上、超賣但仍向下) 可顯示從M1到MN1的即時數據 可顯示15種貨幣對的資料(多幣種外匯/商品/加密貨幣/股票) 可自訂參數 可自訂顏色 OBOS 級別 漂亮的20儀表板配
使用此交易工具,您可以同时扫描 15 个市场。 介绍新的交易指标 2024: ️ 仪表板多货币多时间框架双 RSI。 我创建这个交易工具至少有两个原因: 首先,我厌倦了只观察一个市场。 其次,我不想失去进入另一个市场的机会。 这就是为什么我想同时了解其他市场状况。 因此,我需要一台可以同时扫描多个市场状况的扫描仪。 我经常寻找快速 RSI 线 >(或 <=)慢速 RSI 线从 M1 到 H4(或只是 M1 到 M30)的市场。 我还经常寻找从 M1 到 M30 超卖/超买的市场。 如果您同意我的分析,那么这就是您一直在寻找的交易指标。 不要错过市场状况满足上述要求的时刻。 这是一个随机扫描仪或仪表板,具有许多出色的功能: 可以显示快速RSI线的数据 可以显示慢速RSI线的数据 可以显示快速RSI线和慢速RSI线的位置(快线在慢线上方或快线在慢线下方) 可以显示快速RSI线和慢速RSI线的数据水平(看涨、看跌、趋势向上、趋势向下、超买但仍向上和超卖但仍向下) 可显示从M1到MN1的实时数据 可显示15种货币对的数据(多币种外汇/商品/加
筛选:
无评论
回复评论
版本 1.30 2024.09.03
In this new version V 1.30 :
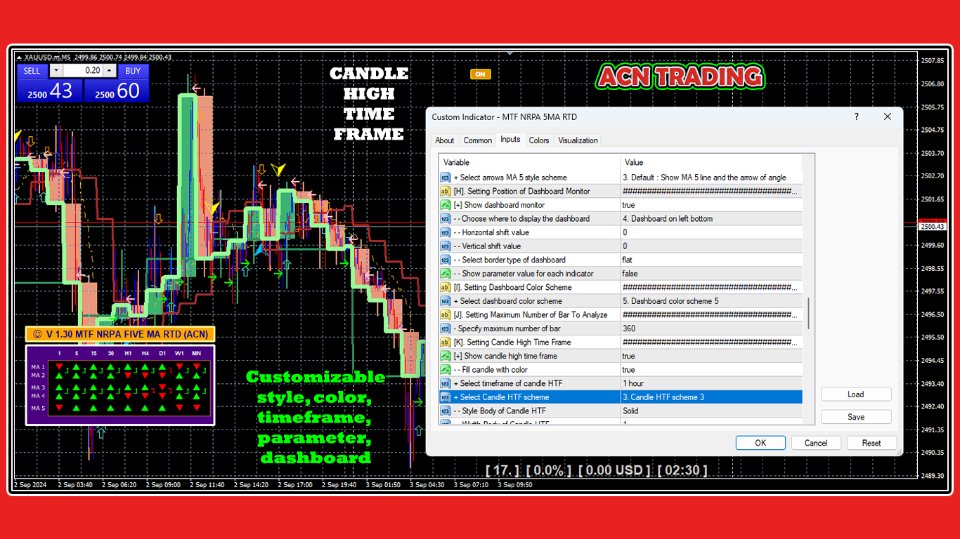
- Adding candle high time frame
- Adding time spread profit info
- Adding time frame scheme
版本 1.20 2023.11.08
In this new version V 1.20 :
- I fixed the on/off button sound
版本 1.10 2023.05.24
In this new Version 1.10, I've fixed a few things :
- Label for arrows