SuperTrend 3 AM
- 指标
- Andriy Matviyevs'kyy
- 版本: 26.0
- 更新: 14 九月 2023
- 激活: 5
SuperTrend 3 AM is an indicator that allows you to open a position at the very beginning of a significant price movement.
The second most important quality of the indicator is the ability to follow the trend as long as possible in order to obtain all potential profits while minimizing potential losses.
The indicator allows you to notify the user about your signals by sending messages to the terminal and e-mail.
This indicator does not repaint or not recalculate.
Free version of this indicator - SuperTrend AM.
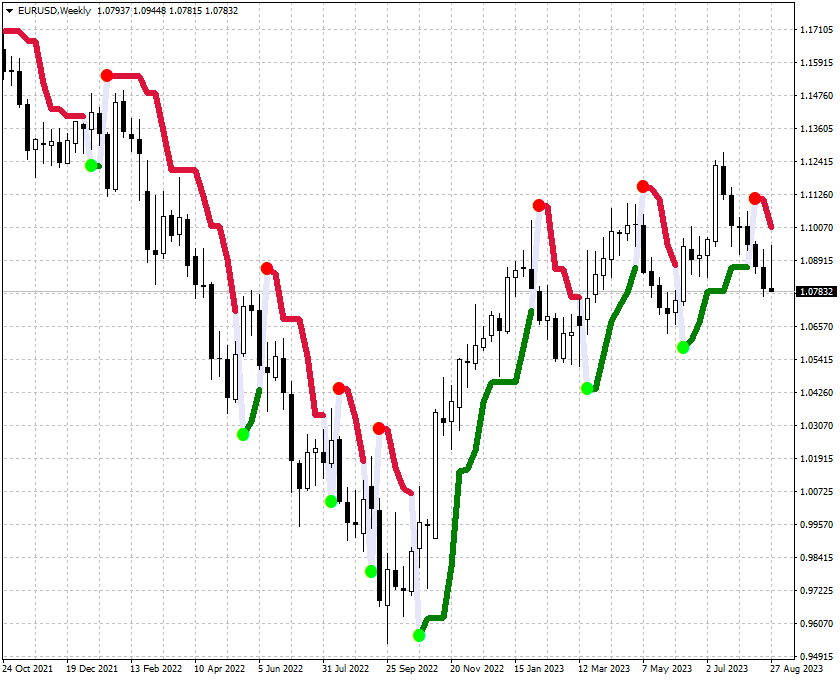
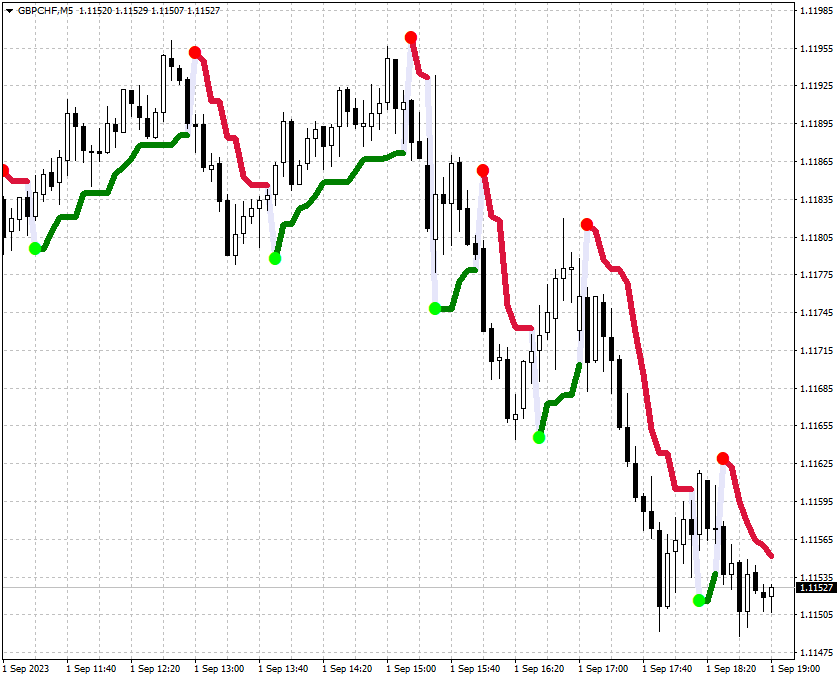
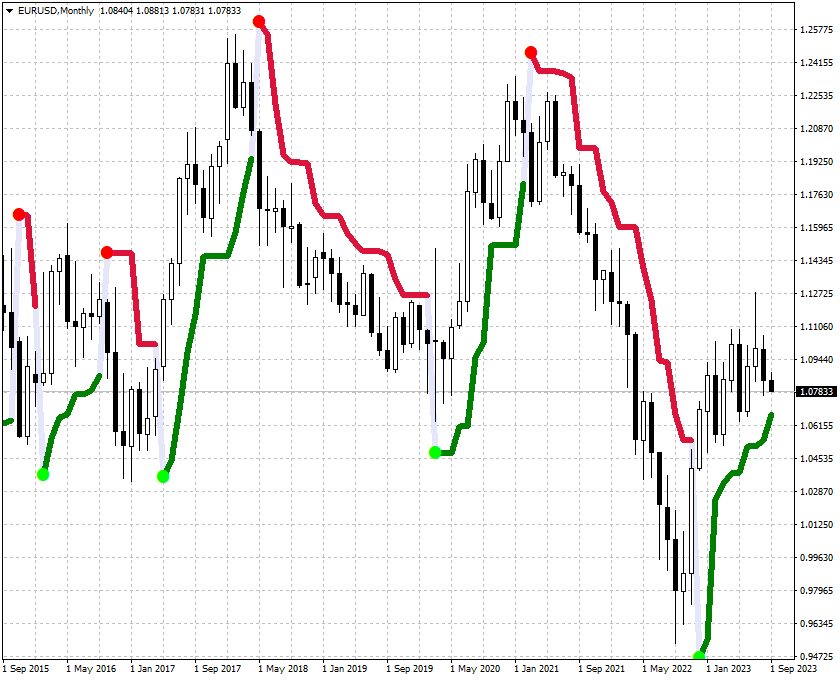
Signal of the indicator:
- red arrow appearing above the price graph - possible start of a downtrend;
- green arrow appearing below the price graph - possible start of an uptrend;
- line - S/R levels.
Terms of use:
1. Option (main):
1.1. When the indicator signal to buy appears, a pending stop order to buy is placed above the bar on which the signal was given.
1.2. The protective stop level is set to the signal point of the indicator.
1.3. When the indicator signal to sell appears, a pending sell stop order is placed below the bar on which the signal was given.
1.4. The protective stop level is set to the signal point of the indicator.
2. Option (dangerous):
2.1. When the high of the bar overcomes the yellow resistance line, a pending stop order is placed to buy above such a bar.
2.2. A protective stop level is set below the low of such a bar.
2.3. When the low of the bar breaks the blue support line, a pending sell stop order is placed below such a bar.
2.4. A protective stop level is set above the high of such a bar.
3. Option (auxiliary, available at high Sensitivity values):
3.1. Provided that the support line is below the price chart, it is allowed to open buy trades.
3.2. Provided that the resistance line is above the price chart, it is allowed to open trades for sale.
- Ind - indicator calculation method;
- Sensitivity (>0) - indicator sensitivity;
- Alerts - show a dialog box;
- Send_Notification - sends push notifications to the mobile terminals, whose MetaQuotes IDs are specified in the "Notifications" tab;
- Send_Mail - sends an email using an address specified on the Email tab of the options window.