UT bot alert
- 指标
- Muhammad Hassaan
- 版本: 1.0
- 激活: 5
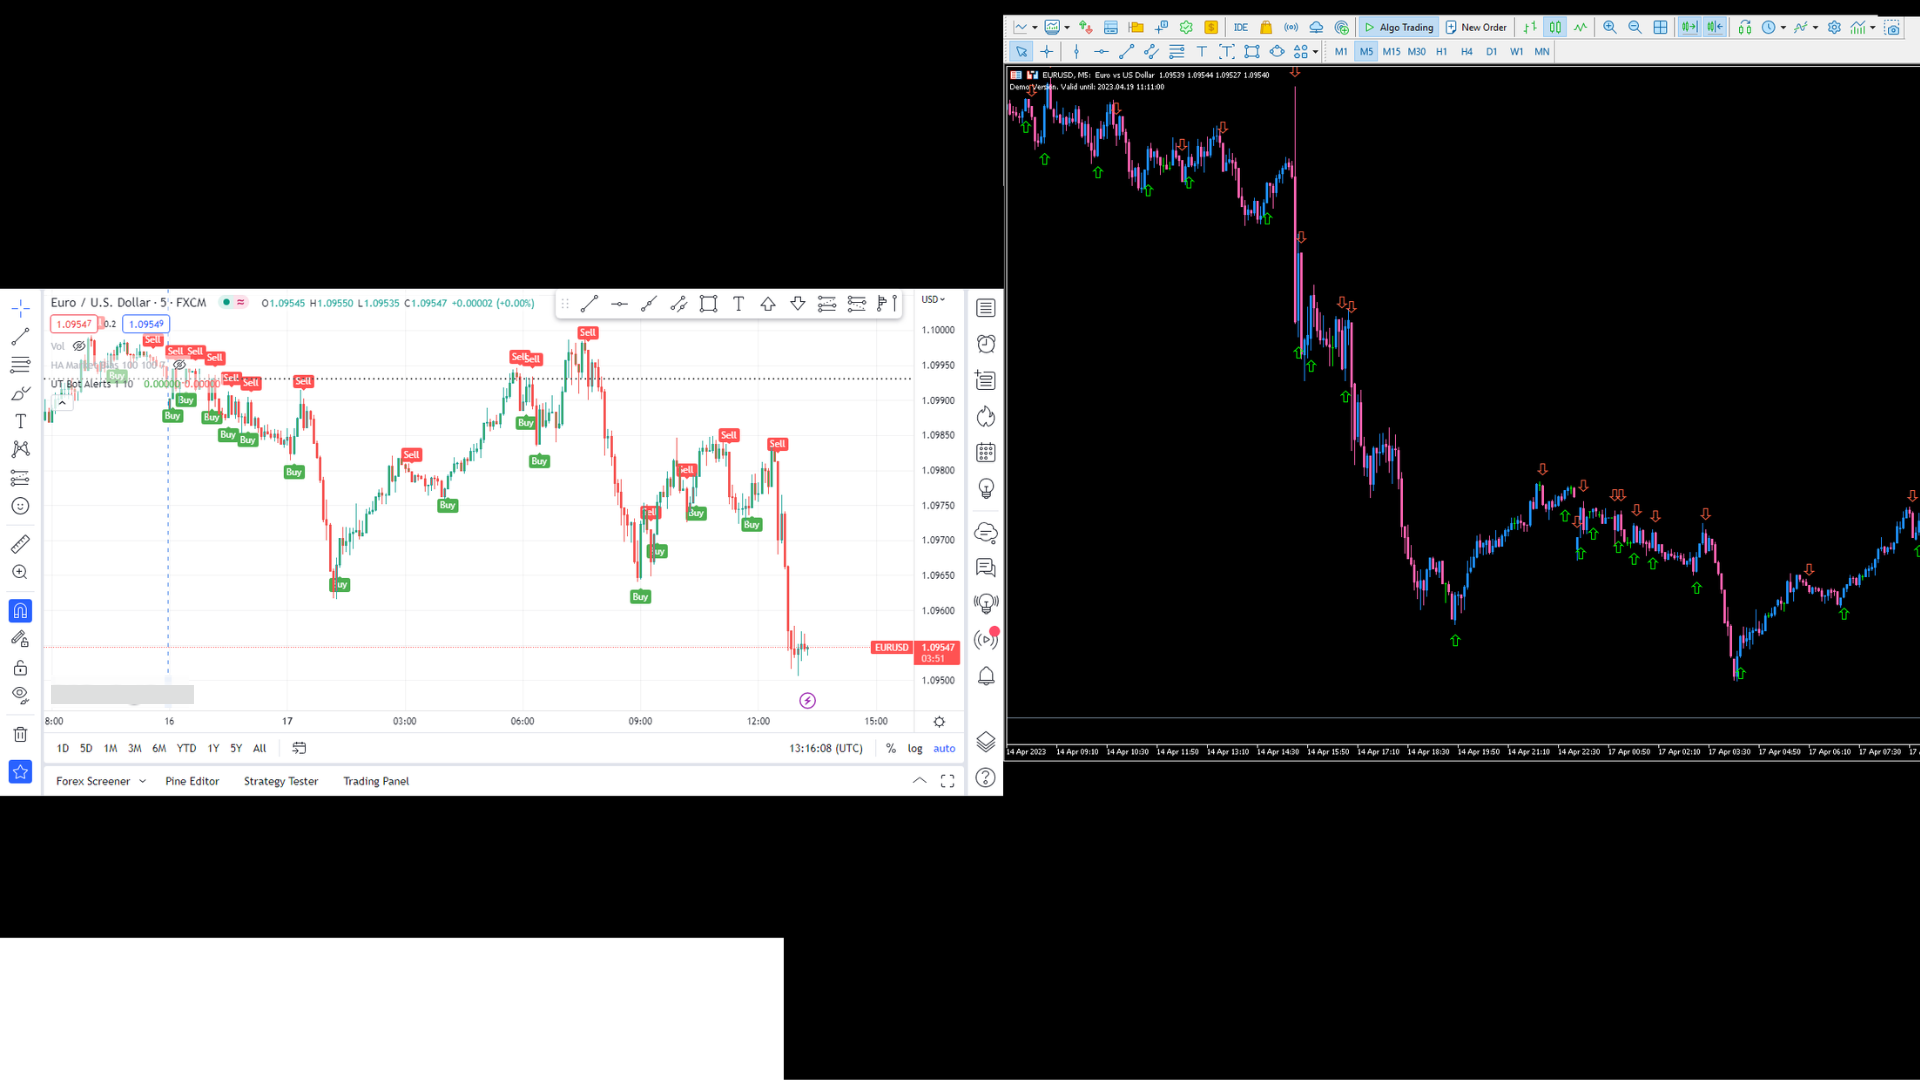
The UT Bot Alert Indicator is an advanced technical analysis tool designed to help traders optimize their trading performance. This innovative indicator is based on the proven UT Bot system, which utilizes multiple indicators to deliver accurate signals that can help traders make better decisions.
The UT Bot Alert Indicator provides a range of features that can help you stay on top of market trends and capitalize on opportunities. Here are some of its key functionalities:
-
Trend Analysis: The UT Bot Alert Indicator uses advanced algorithms to analyze market trends and identify key support and resistance levels. This information can help traders make more informed trading decisions.
-
Signal Alerts: The indicator provides real-time alerts when a trading signal is generated, allowing traders to act quickly and efficiently. The alerts can be customized to fit your trading style and preferences.
-
Multi-Instrument Support: The indicator is compatible with a wide range of financial instruments, including forex, stocks, indices, and commodities.
-
Customizable Settings: The UT Bot Alert Indicator allows traders to customize the settings based on their trading preferences, such as selecting the time frame for analysis, adjusting the sensitivity of the signals, and selecting the types of signals to receive.
-
User-Friendly Interface: The indicator has a simple and user-friendly interface, making it easy to install, use, and navigate.


用户没有留下任何评级信息