BreakOut Consult mt5
- 指标
- Daniel Opoku
- 版本: 3.0
- 更新: 24 四月 2023
- 激活: 5
介绍一下BreakOut Consult,这是一款革命性的工具,将帮助您将交易提升到一个新的水平!我们的尖端算法结合了多种趋势和振荡器,生成准确的买入和卖出信号,是任何交易者的强大工具。
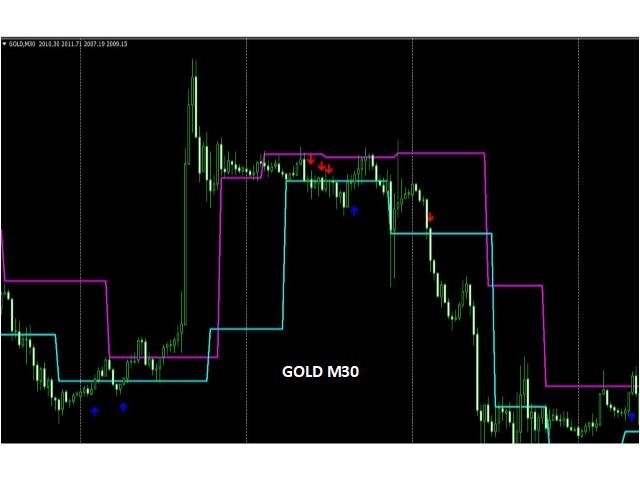
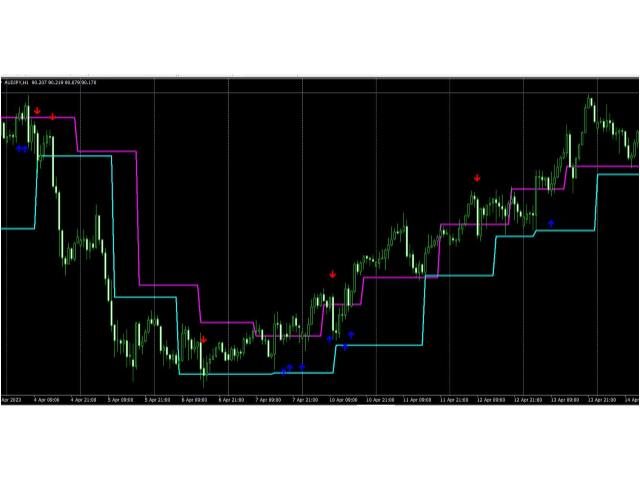
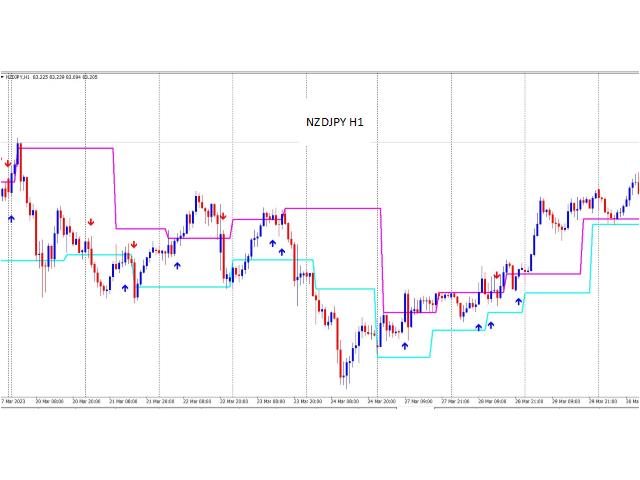
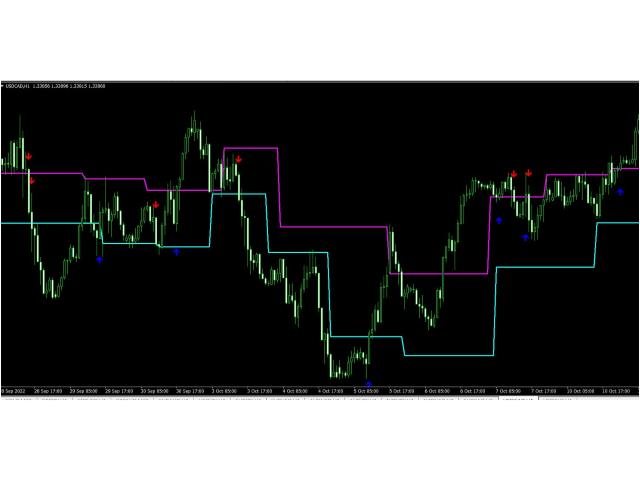
有了BreakOut Consult,您可以轻松地通过我们的动态通道识别市场中的突破,该通道使用支撑和阻力水平来检测突破。我们的算法检测到两种类型的突破,确保您永远不会错过任何一个黄金机会。
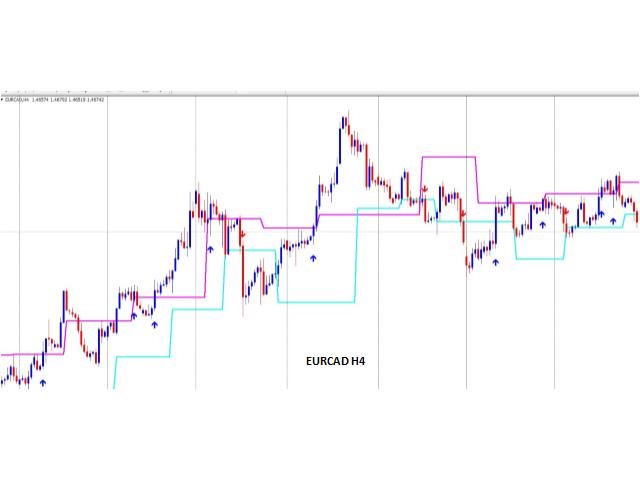
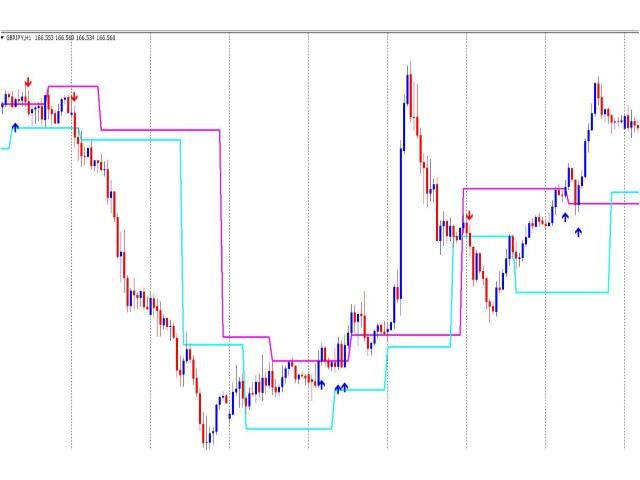
从上方的阻力位突破和从下方的支撑位突破。 从下方的阻力位突破和从上方的支撑位突破。 当发生买入突破时,会出现一个向上的箭头,当发生卖出突破时,会出现一个向下的箭头 - 就是这么简单!
我们的算法被设计为适用于所有市场,包括外汇、商品、股票和加密货币。无论您是短线交易者、波段交易者还是持仓交易者,BreakOut Consult都可以帮助您在任何时间框架上检测突破。
我们了解到虚假突破可能是一个真正的问题,这就是为什么我们的算法使用复杂的过滤器来减少虚假突破,使BreakOut Consult更加可靠和有效。
优缺点: 一旦信号箭头在蜡烛收盘后显示在图表上,它就永远不会消失,因此您可以对自己的交易决策有信心。
尽管BreakOut Consult能够识别导致强劲趋势的高质量突破,但由于算法约束,偶尔会错过机会。
BreakOut Consult确实可以帮助您增加利润,但重要的是要记住它不是圣杯指标。
不要错过下一个重大突破 - 今天就尝试BreakOut Consult,将您的交易提升到一个新的水平!