Versus USD MT5
- 指标
- Vonjinirina Alfred Randrianiaina
- 版本: 1.10
- 更新: 5 五月 2023
- 激活: 10
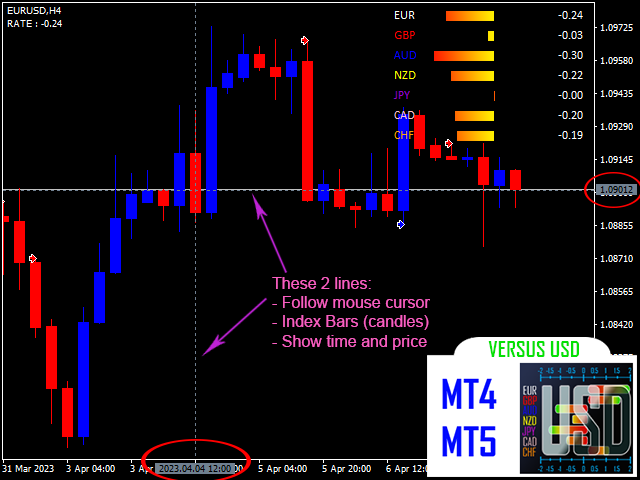
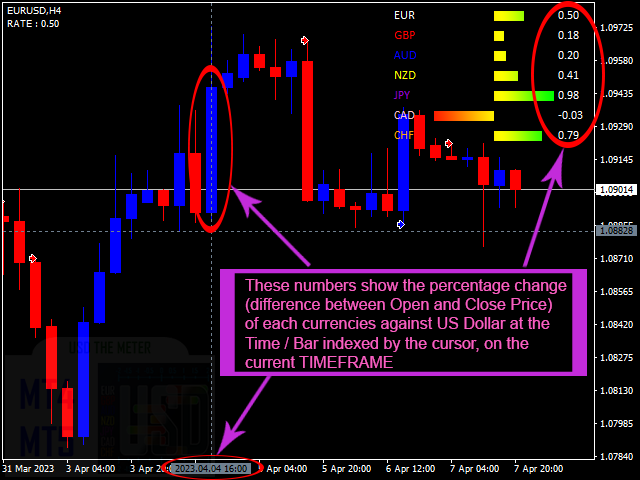
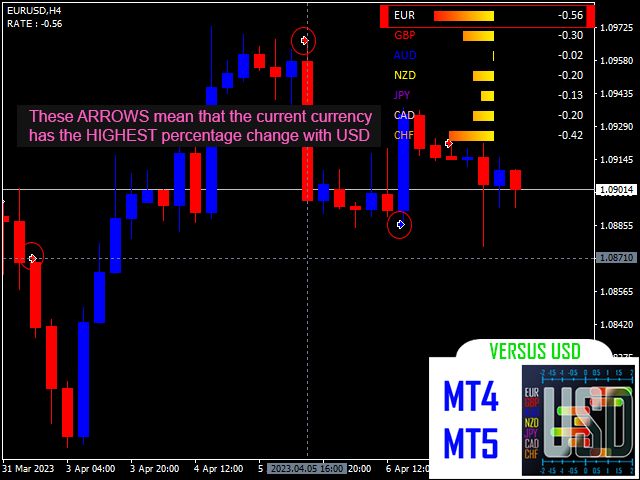
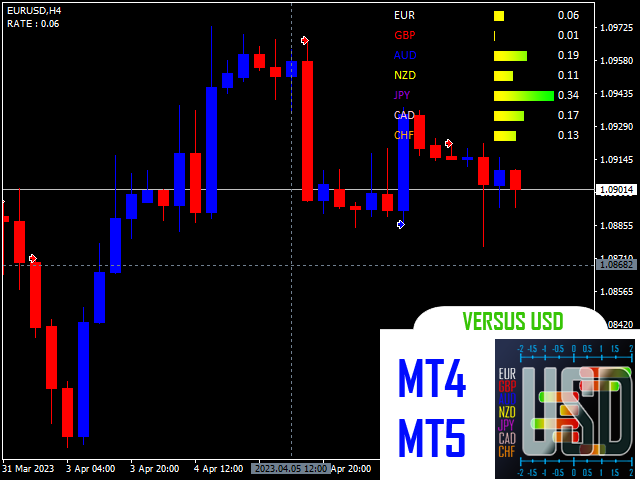
Versus USD calculates the price variation of each major currency against the USD and displays a clear and comparative view of their performance for each period or bar indexed by the cursor in the current Timeframe of the chart with progress bars. Additionally, it marks an arrow on the bar/period where the currency in question experienced the highest or lowest rate of change against the USD compared to other currencies, thus providing a more precise measure of the currency's performance.
The US Dollar is the primary currency used to measure the performance of each major currency in the foreign exchange market as it is the most liquid and widely used currency in international transactions. Additionally, most forex transactions involve the US Dollar as either the base or quote currency, making it easier to compare and evaluate the performance of other currencies.
Regardless of your level of experience in forex trading and your trading style, whether you already have a profitable strategy or not, this indicator can boost your skills in no time. Additionally, it is easy to use because it has the following features:
- Compatible with all 28 major currency pairs
- Works with all Timeframes (M1 - MN)
- No need for configuration, everything is automated
- Available on MT4 and MT5
PREREQUISITES:
1. To use the indicator correctly, the historical data of the seven major pairs must be synchronized and updated, and it is recommended to open the charts of these pairs, even if you are not using the indicator with one of them.
These 7 major pairs are:
- EURUSD
- GBPUSD
- AUDUSD
- NZDUSD
- USDJPY
- USDCAD
- USDCHF
2. It is crucial that the historical data of other symbols used with the indicator are also up-to-date and synchronized with those of the seven major pairs.
RECOMMENDATIONS:
- I strongly recommend users to use the indicator with currency pairs containing JPY as it is much more reliable and accurate with these pairs.
- Wait until the historical data for the 7 major currency pairs (containing USD), as well as the pair with which you will use the indicator, are up to date and synchronized before adding Versus USD to your chart to avoid potential bugs.
- If the indicator encounters a bug, I suggest switching to another timeframe, then returning to the desired timeframe.
Join the Versus USD chat if you have questions or reports or something else about the indicator.
Versus USD MT4 : https://www.mql5.com/fr/market/product/97127