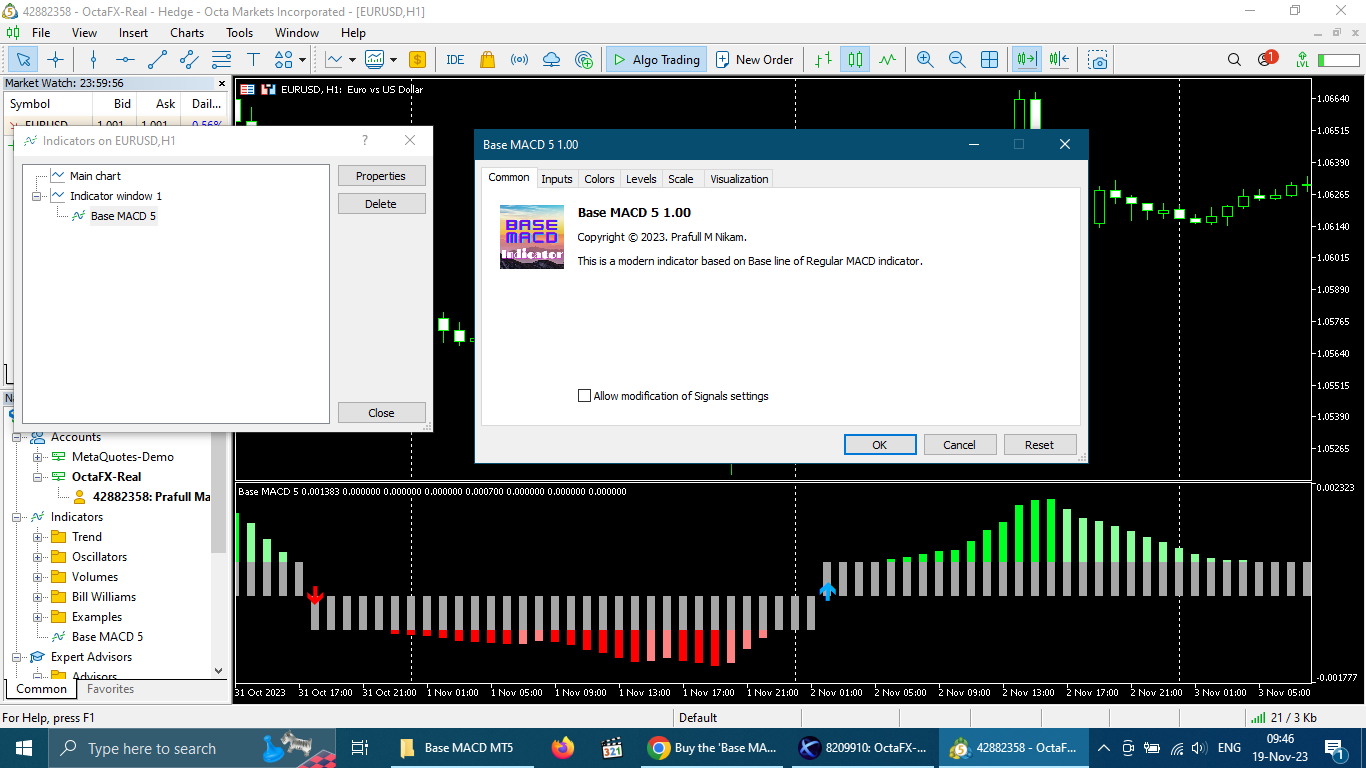
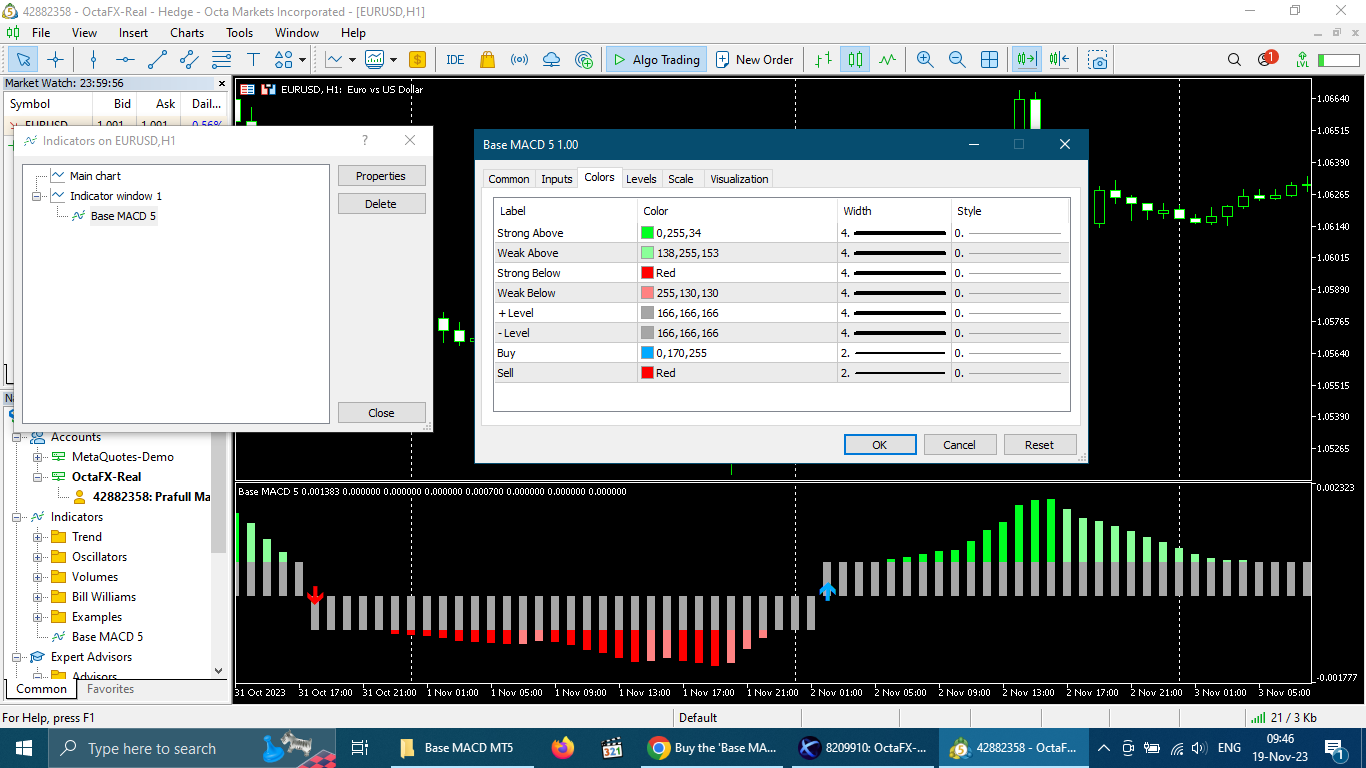
Base MACD 5
- 指标
- Prafull Manohar Nikam
- 版本: 1.0
- 激活: 5
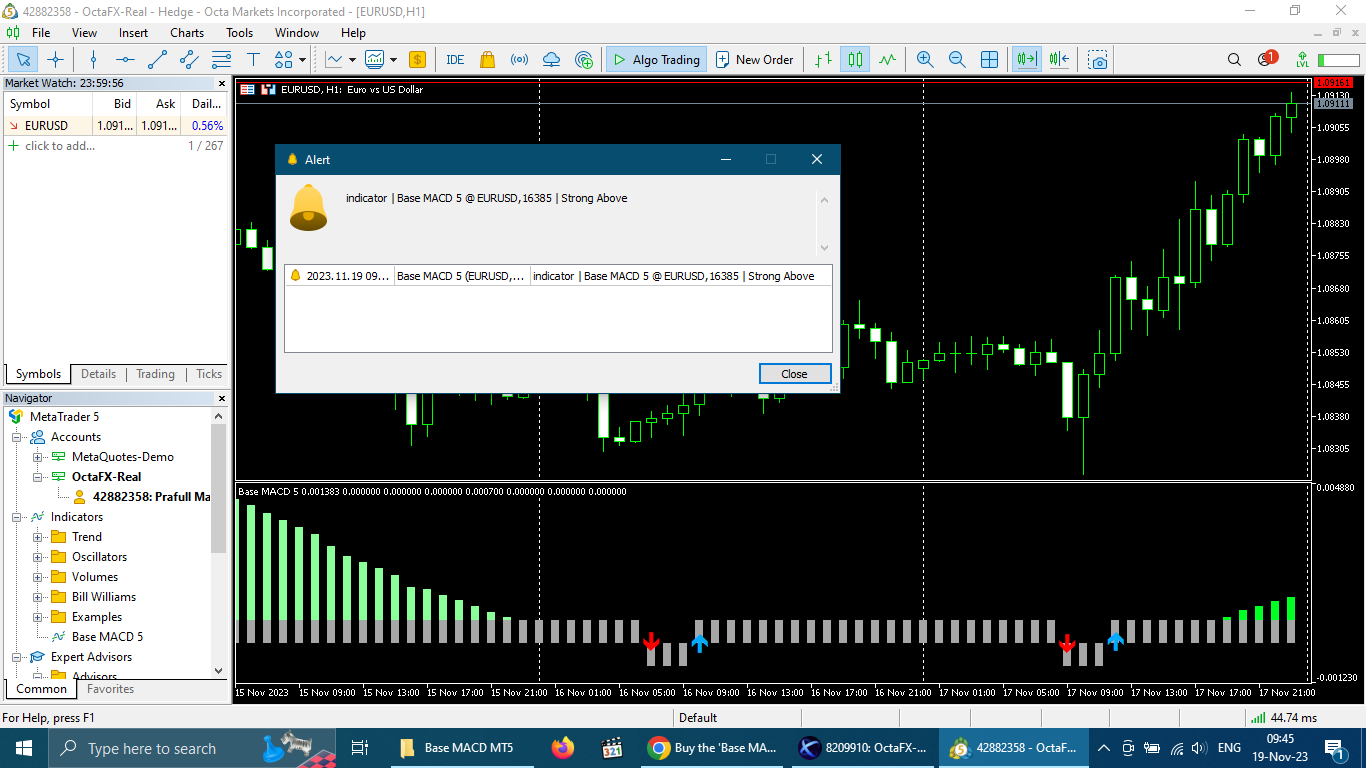
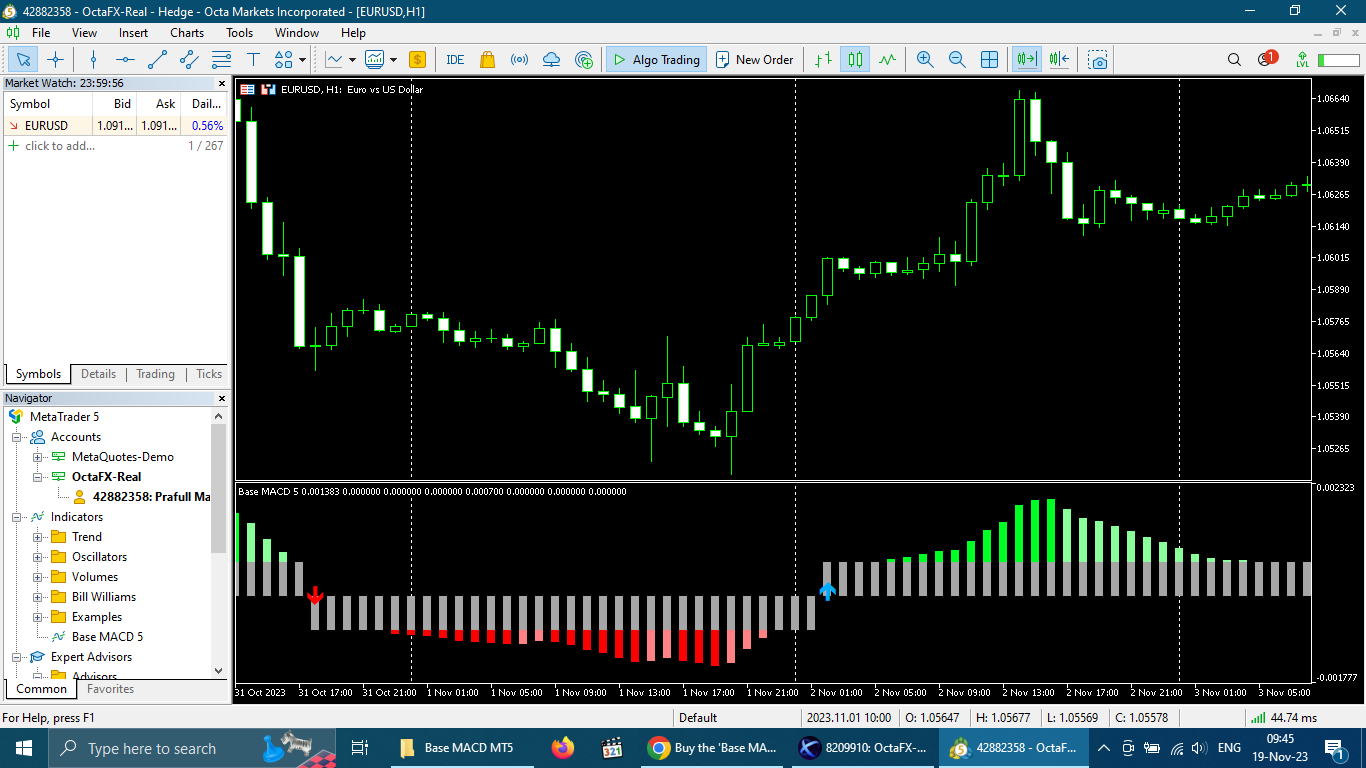
This is a modern MACD indicator based on regular MACD indicator. It also has alert system included. This indicator gives you alerts when base line of MACD indicator crosses above or below Zero level so you can look for Buy or Sell opportunity.
Available Alerts:
1. Audible Alerts on Chart / Trading Terminal window.
2. Alerts on your email.
3. Alerts on your mobile phone.
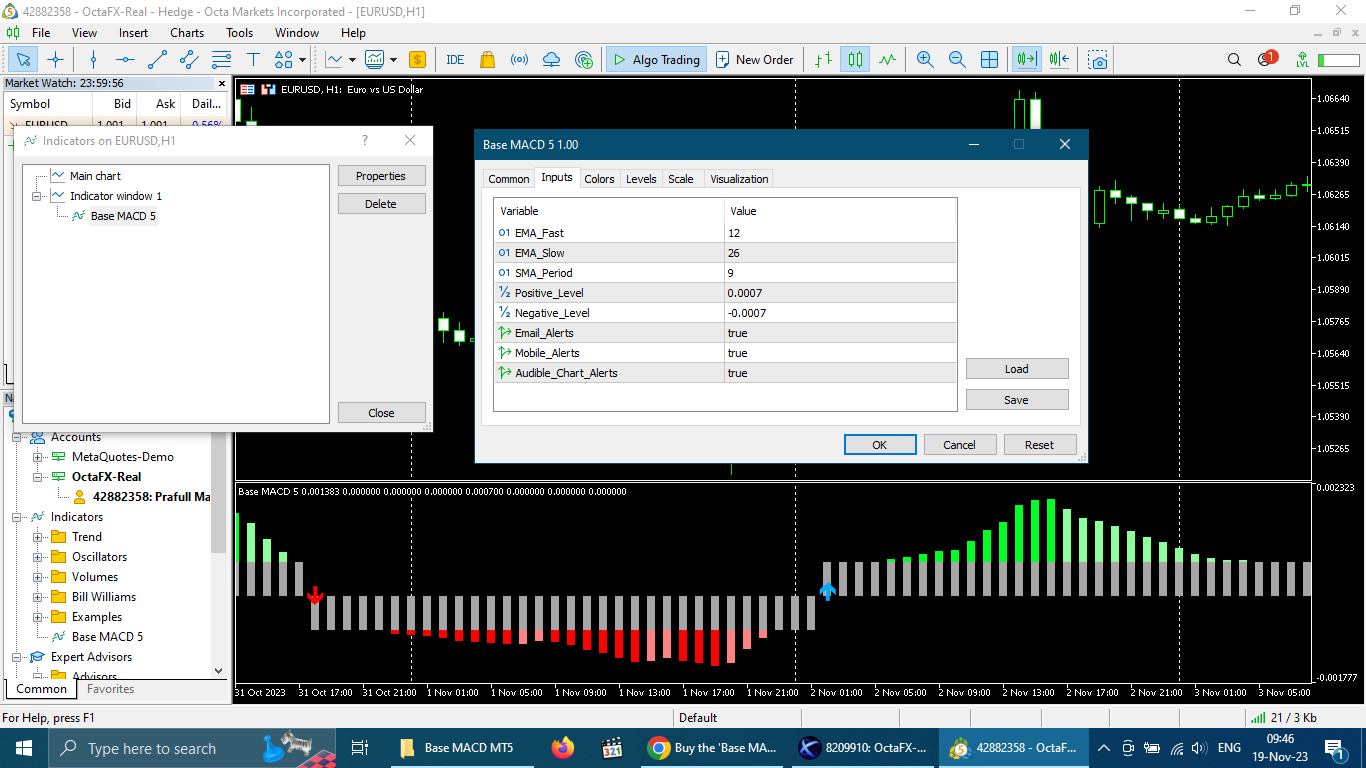
Type of Alerts Explained:
1. Audible_Chart_Alerts - Audible alerts and Popup message on your computer’s trading terminal window.
2. Email_Alerts - Push notifications or alerts on your email (make sure you added and activated email in your computer’s trading terminal settings.)
3. Mobile_Alerts - Push notifications or alerts on your Android and IOS mobile phones (requires MT4 or MT5 app installed on your mobile phone.)