• 概述
  • 评论 (4)
  • 评论 (13)
  • 新特性

High and Low of Day and Week

3.67

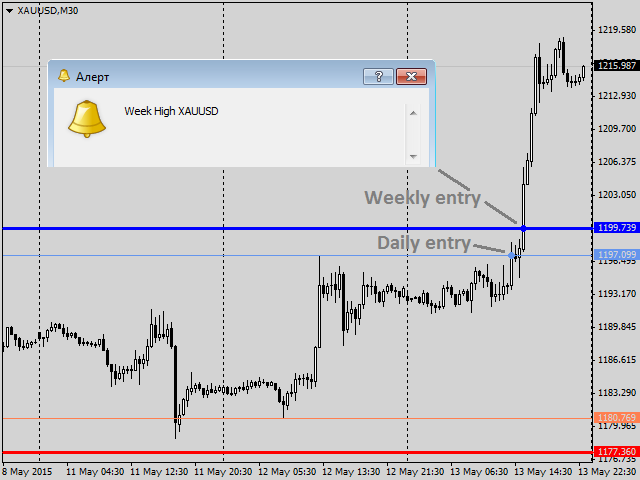
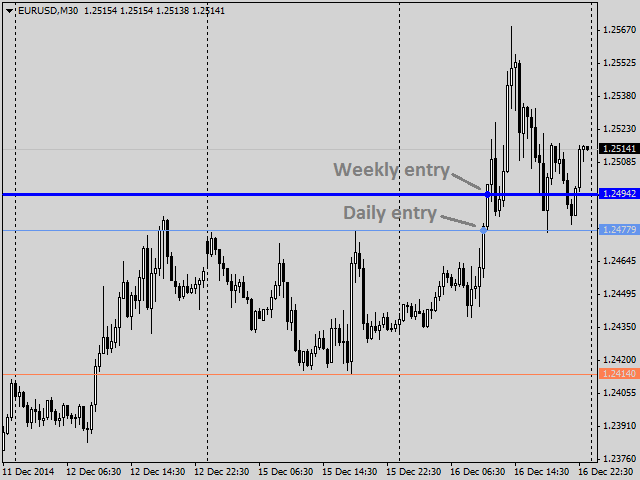
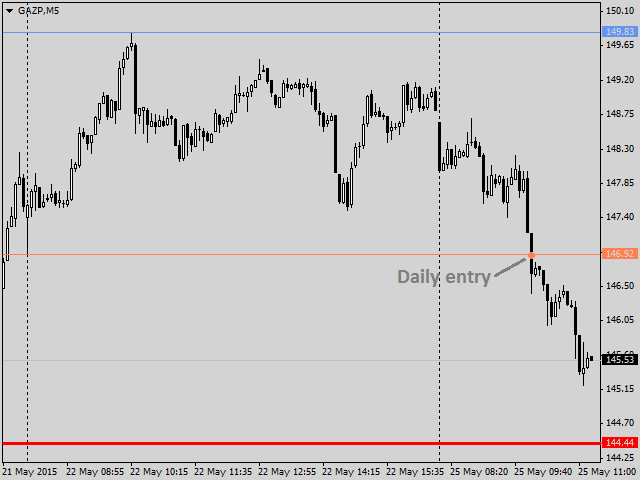
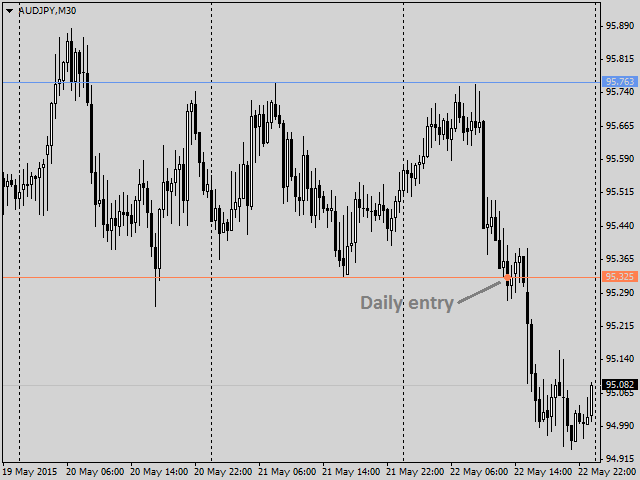
The indicator places levels on the chart: day and week high, day and week low. When the price crosses the high's level upwards or the low's level downwards, the indicator beeps and send a notification (Alert and Push-notification on mobile phone) indicating a direction and an instrument by which crossing has occurred, and also draws arrows.

Visual parameters:

  • Day_Width  - daily level width.
  • Days_Alerts - enabling Alerts.
  • Days_Arrows - enabling drawing arrows.
  • Day_High  - color of daily high level.
  • Day_Low  - color of daily low level.
  • Week_Width  - weekly level width.
  • Week_Alerts - enabling Alerts.
  • Week_Arrows - enabling drawing arrows.
  • Week_High  - color of weekly high level.
  • Week_Low  - color of weekly low level.


评论 4
loh kheng keat
182
loh kheng keat 2020.11.01 14:32 
 

Nice indicator and helpful developer. You can manually on/off for the alert when price break previous day/week high and low range and much more.

Abdul Hakeem
507
Abdul Hakeem 2020.10.04 23:44 
 

Excellent product from a very helpful developer who has made further improvements. Planning to buy the MT5 version.

推荐产品
Arah Trend
Edi Marsel
ARAH TREND is an indicator to detect the current trend, and predict next trend.  Its very simple way to know trend because   the display so clear. Trend changes are indicated by indicator color change. That's great as an entry point.  The advantages of this indicator : - Beautiful Entry Points - No Need Setting - Suitable for all time frames - Geat for GBPUSD and Gold TF H1 - The display is simple and clear It can also be combined with your mainstay indicator so that the entry point is more acc
My Point MT4
Claudia Ramona Angerer
4 (1)
Diagnosis of major and minor pivot Trend detection with many signals Can be used in all symbols Can be used in all time frames Settings: Back Show: The number of candles it displays If you need any adjustments, or have any questions or suggestions, message me How to trade: Blue: sell signal Red: buy signal Blue and red at the same time: no signal Exit signal: Opposite signal
Trend Suffer
Philip Effiong Philip
Alerts you on new trends, with ENTRY and EXIT points. INSTRUCTIONS  Select asset of choice, activate the indicator on the chart and just follow the signals from the arrows. ITS FREE, GIVE ME A GOOD RATING! Platform : Metatrader4 Asset : All Currencies, Gold, BTCUSD, NASDAQ PS : F or newbie and pro traders. Used by more 3,000 traders around the world. Send  a mail for further help and information...........
Big Figure Indicator
Vonjinirina Alfred Randrianiaina
"BIG FIGURE INDICATOR" automatically identifies and draws horizontal lines on price charts at specific levels, such as whole numbers or half-numbers (e.g., 1.0000 or 1.5000 in currency trading). These levels are considered psychologically significant because they represent round numbers that big traders and investors may focus on, leading to potential support or resistance levels. The big figure indicator can help traders identify important price levels and make trading decisions based on these
FREE
Fibo Panda is an indicator that can help you predict the end of daily trends. If the daily price has reached the END L4 or END H4, means the Daily volume is enough. If the daily price has reached the Highest or Lowest, means the price has reached the highest or lowest level. Price must touch the End Hi or End Low Level to complete the price movement of each timeframe. A conclusion can be made whether to buy or sell. If the price is in the High Guard and Low Guard areas it means the price is now
This indicator is meant for Harmonic Traders, it helps them in identifying the formed patterns by analyzing the market past data, looking for Harmonic Patterns. The Patterns that this indicator can detect are: AB=CD Butterfly Gartely Crab Bat The indicator shows the following: The completed pattern, with the critical zone highlighted in Gray box The suggested 3 take profit levels (in green) The Suggested Stop Loss level (in Red) The formed pattern ratios can be checked by hovering the mouse on t
Machine Learning Adaptive SuperTrend - Take Your Trading to the Next Level! Introducing the   Machine Learning Adaptive SuperTrend , an advanced trading indicator designed to adapt to market volatility dynamically using machine learning techniques. This indicator employs k-means clustering to categorize market volatility into high, medium, and low levels, enhancing the traditional SuperTrend strategy. Perfect for traders who want an edge in identifying trend shifts and market condit
MT Scanner
Niravkumar Maganbhai Patel
4 (2)
This indicator helps you to Scan symbols which are in the Market Watch Window  and filter out trends with alerts. It works based on the effective indicator "SUPERTREND" which is used by many traders for trading: When box color changes to " Green " or " Red " color, it indicates you for trend change for long and short entry. And also you will get alerted on screen. When it changes to " Green ", it indicates you that trend is going upwards, and you can take the long entry. If the color changes to
FREE
This indicator is designed to find the difference in RSI price and indicator.  This indicator shows the price and indicator difference on the screen. The user is alerted with the alert sending feature. Our Popular Products Super Oscillator HC Cross Signal Super Cross Trend Strong Trend Super Signal Parameters divergenceDepth -   Depth of 2nd ref. point search RSI_Period -   Second calculation period indAppliedPrice -   Applied price of indicator indMAMethod -   MA calculation method findExtInt
FREE
MoveWave
Andriy Sydoruk
MoveWave - Moving waves are very handy indicators for determining pivot levels. Most Forex traders make decisions based on technical analysis. This type of analysis determines patterns and trends in the market. With the help of complex mathematical equations that are combined and made out in the form of this indicator, the trader will be able to more accurately determine the price reversal levels. Wave theory mathematically represents various behavioral models of the market. It is used as the ba
Silver Bullet MT4
Saksham Solanki
Contact me for any queries or custom orders, if you want to use this in an EA. Key Features: Pattern Recognition : Identifies Fair Value Gaps (FVGs) Spots Break of Structure (BOS) points Detects Change of Character (CHoCH) patterns Versatile Application : Optimized for candlestick charts Compatible with any chart type and financial instrument Real-Time and Historical Analysis : Works seamlessly with both real-time and historical data Allows for backtesting strategies and live market analysis V
FREE
枢轴点斐波那契 RSJ 是一个指标,它使用斐波那契汇率追踪当天的支撑线和阻力线。 这个壮观的指标使用斐波那契汇率通过枢轴点创建多达 7 个支撑位和阻力位。 价格如何尊重该支撑和阻力的每个水平真是太棒了,在那里可以感知操作的可能进入/退出点。 特征 多达 7 个支撑位和 7 个阻力位 单独设置级别的颜色 输入 枢轴类型 Pivot Fibo RSJ1 = Fibo ratio 1 计算 Pivot Fibo RSJ2 = Fibo ratio 2 计算 Pivot Fibo RSJ3 = Fibo ratio 3 计算 Pivot Fibo Classic = 经典枢轴计算 最低枢轴级别 旋转 3 个级别 旋转 4 个级别 旋转 5 个级别 枢轴 6 个级别 旋转 7 个级别 如果您仍有疑问,请通过直接消息与我联系: https://www.mql5.com/zh/users/robsjunqueira/
FREE
Mongol Indicator2
Sumiyabazar Buyanjargal
It's a variation of mid of HH and LL since it compares the higher of HH or LL against a period and twice the number of bars back to avoid whipsaws. I used to display this against lines on a chart, but made a histogram out of it and it looks interesting. It looks good at gauging trend strength and general turns (see image below). The name of the indicator is BAM, which is an acronym for "Below and Above Mid". Ways to use it: 1. To see general trend on longer TFs (more than 30 ba
使用此交易工具,您可以同时扫描 15 个市场。 介绍新的交易指标 2024: ️ 仪表板多货币多时间框架随机。 我创建这个交易工具至少有两个原因: 首先,我厌倦了只观察一个市场。 其次,我不想失去进入另一个市场的时机。 这就是为什么我想同时了解其他市场状况。 因此,我需要一台可以同时扫描多个市场状况的扫描仪。 我经常寻找随机主线>(或<=)随机信号线从M1到H4(或只是M1到M30)的市场。 如果您同意我的分析,那么这就是您一直在寻找的交易指标。 不要错过市场状况满足上述要求的时刻。 这是一个随机扫描仪或仪表板,具有许多出色的功能: 可显示随机主线数据 可显示随机信号线数据 可以显示随机主线和信号线的位置(信号线上方主线或信号线下方主线) 可以显示随机主线和信号线的数据水平(看涨、看跌、趋势向上、趋势向下、超买但仍向上、超卖但仍向下) 可显示从M1到MN1的实时数据 可显示15种货币对的数据(多币种外汇/商品/加密货币/股票) 可定制参数 可定制颜色 OBOS 级别 漂亮的20仪表板配色方案 配备开/关货币对转换器 配备蜡烛高时间框架 配
Super trend is one of the best trend indicators in metatrader 4 (MT4). Triple SuperTrend indicator is an indicator that consist of three super trend indicator that can be aranged. This indicator is built by mql4 language and doesn't provided by MT4 platform. Highly recommended using EMA SuperTrend Strategy Indicator if you want to get better result in here: https://www.mql5.com/en/market/product/91664 This indicator is easy to use, power full and has many benefits, there are: Using three ind
FREE
Rira Renko
Vitor Palmeira Abbehusen
RENKO on Time Chart This indicator is an enhanced Renko, so you can watch the Renko bricks on the chart to understand price movement more clearly the other improvement is automated box size according to ATR (Average True Range) period you can set the ATR number as you want and the box size of Renko changes automatically based on price movement Inputs Mode: Box size is the input to specify the size of the Renko box you want to print on the chart. This input lets you choose the fixed b
Pivot levels Auto V1
Hafis Mohamed Yacine
What Is a Pivot Point? A pivot point is a technical analysis indicator, or calculations, used to determine the overall trend of the market over different time frames. The pivot point itself is simply the average of the intraday high and low, and the closing price from the previous trading day. On the subsequent day, trading above the pivot point is thought to indicate ongoing bullish sentiment, while trading below the pivot point indicates bearish sentimen How to Use Pivot Points The very e
Pivot Points MT4
KEENBASE SOFTWARE SOLUTIONS
KT Pivot Points automatically plots the daily, weekly, and monthly pivot levels on a chart with the precise calculation based on the latest data. Pivot points is a widely used indicator in technical analysis, particularly in the Forex market. Features Send alerts when the price touches the pivot level.  It offers complete customization for each kind of pivot level.   Shows daily, weekly, and monthly pivot levels without any fuss. It uses minimum CPU resources for faster calculation. Compati
The indicator monitors the MACD trend in multiple timeframes for a specific market. No more shifting in between charts to check the trend direction while trading. Key Features Indicator can be used for all markets Monitors every timeframe, from M1 to MN Able to move display label on chart by single click Indicator Usage The dashboard appears to the left and upper part of the chart when attached. The shell encapsulating a timeframe goes red on a down trend, green on an up trend. If the defaul
This system never paints.   This system created by using Envolpes bands and reverse bar count.   This indicator is only working in M5 period.   This system is for long term and profitable.   Signals are shown as arrows. as an optional limit orders.   You can set a voice alarm or email notification.   You can fins our other products from link : https://www.mql5.com/en/users/drbastem/seller   Also, you can ask all your questins from email : haskayafx@gmail.com or mobile : +90 530 867 5076 or @Meh
Market Profile
Artem Titarenko
5 (1)
The "Market Profile" indicator displays the profiles and volumes of periods – weekly, daily, session (8-hour), 4-hour, hour, summary. The VAH/VAL price area is automatically highlighted by a dotted line for each profile (except for the summary). The indicator includes chroma Delta, which colors the profile areas. The areas of prevailing Buys is colored in green, that of Sells - in red. The intensity histogram features blue/red respectively. In the filter mode, the indicator displays the volume a
Free automatic fibonacci
Tonny Obare
4.66 (47)
Free automatic Fibonacci is an indicator that automatically plots a Fibonacci retracement based on the number of bars you select on the BarsToScan setting in the indicator. The Fibonacci is automatically updated in real time as new highest and lowest values appears amongst the selected bars. You can select which level values to be displayed in the indicator settings. You can also select the color of the levels thus enabling the trader to be able to attach the indicator several times with differe
FREE
Bermaui Channel
Muhammad Elbermawi
5 (19)
这是一个价格通道,在图表上显示五个重要的价格水平。这些级别是: 1. 前 x 根柱线的最高价 (HH)。 2. 前 x 根柱线的最高低点 (HL)。 3. 中线。 4. 前 x 根柱线的最低最高价 (LH)。 5. 前 x 根柱线的最低价 (LL)。 如何Bermaui通道捕获 超买 区域 将 HH 和 HL 水平之间的距离视为超买区域。 当价格蜡烛或柱线穿过 HL 向上时,这表明价格正在进入其超买区域。 当价格蜡烛或柱线穿过 HL 向下时,这表明价格正在超出其超买区域。 当价格蜡烛穿过 HH 时,它会创造一个新的高点。这可能表明一个新的上升趋势的开始,该趋势将继续进行,直到价格再次反转下跌方向。 Bermaui Channels 如何捕捉 超卖 区域 将 LL 和 LH 之间的距离视为超卖区域。 当价格蜡烛或柱线穿过 LH 向下时,这表明价格正在进入超卖区域。 当价格蜡烛或柱线穿过 LH 向上时,这表明价格正在超出其超卖区域。 当价格蜡烛穿过 LL 时,它会创造一个新的低点。这可能表明新的下跌趋势的开始,该趋势将继续进行,直到价格反转其方向再次回到上行。
This indicator is designed to find the difference in MACD price and indicator.  This indicator shows the price and indicator difference on the screen. The user is alerted with the alert sending feature. Our Popular Products Super Oscillator HC Cross Signal Super Cross Trend Strong Trend Super Signal Parameters divergenceDepth -  Depth of 2nd ref. point search Fast ema -  Fast ema setting Slow ema - slow ema setting MACD sma - macd sma setting indAppliedPrice -  Applied price of indicator indMA
MQLTA Support Resistance Lines is an indicator that calculates the historical levels of Support and Resistance and display them as Lines on chart. It will also Alert you if the price is in a Safe or Dangerous zone to trade and show you the distance to the next level. The indicator is ideal to be used in other Expert Advisor through the iCustom function. This DEMO only works with AUDNZD, the full product can be found at https://www.mql5.com/en/market/product/26328 How does it work? The indicato
FREE
Pro Support Resistance
Suvashish Halder
4.75 (4)
This is the best Support and Resistance Indicator on the market, and it shows both confirmed Support and Resistance as well as Retests. Support & Resistance: Support marks where buying demand halts price declines, acting as a safety net. Resistance caps price surges, driven by selling pressure. Traders leverage these levels to predict reversals, plan entries, exits, and manage risks, making them trading's fundamental guideposts. You can also find Premium and Discount Levels, Strong High/Low, Wea
FREE
MASi Three Screens
Aleksey Terentev
5 (2)
MASi Three Screens is based on the trading strategy by Dr. Alexander Elder. This indicator is a collection of algorithms. Algorithms are based on the analysis of charts of several timeframes. You can apply any of the provided algorithms. List of versions of algorithms:     ThreeScreens v1.0 - A simple implementation, with analysis of the MACD line;     ThreeScreens v1.1 - A simple implementation, with analysis of the MACD histogram;     ThreeScreens v1.2 - Combines the first two algorithms
FREE
LineBreakMT4
Nattadecha Tangpakinwat
Key Features: Type of Indicator: Line Break Chart Indicator Usage: Identifying trend reversals and potential market turning points. Input Parameters: The primary input parameter is 'Lines_Break,' which represents the number of lines the price needs to move to create a new line in the opposite direction. How it works: The indicator draws green and red histogram bars to represent the line break chart. Green bars indicate an upward trend, and red bars indicate a downward trend. The indicator calcul
FREE
Implement
Vitalii Zakharuk
5 (1)
Implement analyzes market dynamics for pivot points. If you want to learn how to spot the correct reversals for consistently likely profitable trading, buy this indicator. Shows favorable moments of entering the market in stripes. Ready-made trading system. The principle of operation of the indicator is to automatically determine the current state of the market when placed on a chart, analyze historical data based on historical data and display instructions for further actions on the trader's
Trend Lines
Rohlan Samino
This indicator is suitable for seeing trends and determining the time to open a position. It is equipped with a Stop Loss position. Easy to use. Just watch the arrows provided. Indicator parameters Shift - the number of bars used for the indicator shift to Right." Step Point per Period - the number of pips for down or Up trend lines" Time Frame - Calculate @ this Time Frame." Max_Bar - the number of bars used for calcuulate indicators (if '0' then All bars to calcuulate)." Alert_On - On or Off
该产品的买家也购买
Gann Made Easy
Oleg Rodin
4.85 (82)
Gann Made Easy 是一个专业且易于使用的外汇交易系统,它基于使用先生理论的最佳交易原则。 W.D.江恩。该指标提供准确的买入和卖出信号,包括止损和获利水平。您甚至可以使用推送通知在旅途中进行交易。 购买后请联系我!我将免费与您分享我的交易技巧和丰厚的红利指标! 您可能已经多次听说过江恩交易方法。通常 Gann 的理论不仅对于新手交易者而且对于那些已经有一定交易经验的人来说都是非常复杂的东西。这是因为江恩的交易方法在理论上并不那么容易应用。我花了几年时间来完善这些知识,并将最好的原则应用到我的外汇指标中。 该指标非常易于应用。您所需要的只是将其附加到您的图表并遵循简单的交易建议。该指标不断进行市场分析工作并寻找交易机会。当它检测到一个好的入口点时,它会为您提供一个箭头信号。该指标还显示止损和获利水平。 换句话说,当您像先生一样进行交易时,该指标会为您提供最佳江恩建议。江恩亲自告诉你此时此刻该做什么。但最好的部分是您不需要了解任何有关江恩交易原则的知识,因为该指标会为您完成整个市场分析工作。
- Real price is 80$ - 40% Discount ( It is 49$ now ) Contact me for instruction, add group and any questions! Related Product:  Bitcoin Expert , Gold Expert Introduction The breakout and retest strategy is traded support and resistance levels. it involves price breaking through a previous level.  The break and retest strategy is designed to help traders do two main things, the first is to avoid false breakouts. Many false breakouts start with a candlestick that breaks out of a level but ends wi
Gold Stuff
Vasiliy Strukov
4.89 (240)
Gold Stuff 是专为黄金设计的趋势指标,也可用于任何金融工具。 该指标不会重绘,也不会滞后。 推荐时间框架 H1。 在它指标工作全自动专家顾问 EA Gold Stuff。 你可以在我的个人资料中找到它。 重要! 购买后立即与我联系,以获得说明和奖金!   您可以免费收到我们的强力支持和趋势扫描指标的副本,请私信。大部头书! 购买后立即联系我以获得设置和个人奖励!   设置 绘制箭头 - 打开关闭。 在图表上绘制箭头。 警报 - 打开关闭声音警报。 电子邮件通知 - 打开关闭。 电子邮件通知。 Puch-notification - 打开关闭。 推送通知。 接下来,调整色域。 Gold Stuff 是专为黄金设计的趋势指标,也可用于任何金融工具。 该指标不会重绘,也不会滞后。 推荐时间框架 H1。 在它指标工作全自动专家顾问 EA Gold Stuff。 你可以在我的个人资料中找到它。 购买后立即联系我以获得设置和个人奖励!   设置 绘制箭头 - 打开关闭。 在图表上绘制箭头。 警报 - 打开关闭声音警报。 电子邮件通知 - 打开关闭。 电子邮件通
TPSproTREND PrO
Roman Podpora
4.79 (19)
TPSpro TREND PRO 是一个趋势指标,可以自动分析市场并提供有关趋势及其每次变化的信息,并给出进入交易的信号而无需重新绘制! 该指标使用每根蜡烛,分别对其进行分析。指不同的脉冲——向上或向下脉冲。货币、加密货币、金属、股票、指数交易的准确切入点! MT5版本                 指标的完整描述   我们建议将其与 指示器 -   RFI LEVELS 一起使用 主要功能: 准确的输入信号,无需渲染! 如果出现信号,它仍然相关!这是与重提指标的一个重要区别,重提指标可以提供信号然后改变信号,这可能导致存款资金的损失。现在您可以以更高的概率和准确度进入市场。还有一个功能是在箭头出现后为蜡烛着色,直到达到目标(止盈)或出现反转信号。 显示止损/获利区域 为了提高搜索切入点时的视觉清晰度,创建了一个模块,该模块最初显示买入/卖出区域,在该区域中搜索进入市场的最佳点。用于处理止损水平的附加智能逻辑有助于随着时间的推移减小其大小,从而降低进入交易(移动 sl)时的初始风险。 显示较高时间范围内的最小值/最大值(MTF 模式) 添加了一项功能,可以显示较高时间间隔的最小
Scalper Inside PRO
Alexey Minkov
4.73 (56)
An exclusive indicator that utilizes an innovative algorithm to swiftly and accurately determine the market trend. The indicator automatically calculates opening, closing, and profit levels, providing detailed trading statistics. With these features, you can choose the most appropriate trading instrument for the current market conditions. Additionally, you can easily integrate your own arrow indicators into Scalper Inside Pro to quickly evaluate their statistics and profitability. Scalper Inside
Atomic Analyst
Issam Kassas
5 (2)
首先值得强调的是,该交易指标是非重绘、非延迟的指标,这使其成为手动和机器人交易的理想选择。 用户手册:设置、输入和策略。 Atomic Analyst是一种PA价格行动指标,利用价格的力量和动量来寻找市场上更好的机会。配备了高级过滤器,可帮助去除噪音和假信号,并提高交易潜力。使用多层复杂的指标,Atomic Analyst扫描图表,并将复杂的数学计算转化为任何初学者都能理解并用来做出一致交易决策的简单信号和颜色。 “Atomic Analyst”是专为新手和经验丰富的交易者量身定制的综合交易解决方案。它将高级指标和一流功能融合为一体的交易策略,使其成为所有类型交易者的多功能选择。 日内交易和剥头皮策略:专为快速准确的日内交易和短期交易而设计。 日内和摆动交易策略:可用作追求价格大幅波动的日内和摆动交易者的可靠工具。 多货币和市场:凭借其可靠的精度,在不同的工具和市场上运作。 多个时间框架:可在多个时间框架上使用,性能良好。 稳定性:所有指标均不重绘、不重绘和不滞后,确保可靠的信号。 信号清晰度:提供箭头信号,用于清晰的入场和出场点。 实时警报:通过交易入场、SL和TP警报通知交
Trend Punch
Mohamed Hassan
4.95 (19)
This indicator is unstoppable when combined with our other indicator called  Support & Resistance . After purchase, send us a message and you will get it   for  FREE as a BONUS! Introducing Trend Punch , the revolutionary forex trend indicator that will transform the way you trade! Trend Punch is uniquely designed to provide precise buy and sell arrows during strong market trends, making your trading decisions clearer and more confident. Whether you're trading major currency pairs or exotic sym
FX Volume
Daniel Stein
4.58 (33)
通过 mql5 和 Telegram 上 的 " 晨间简报 "获取每日市场更新,包括详细信息和屏幕截图 ! 外汇交易量(FX Volume)是第一个也是唯一一个从经纪商角度真正洞察市场情绪的交易量指标。 直接在您的图表上看到这些信息是真正改变游戏规则和突破性的交易解决方案。 受益于独特的市场数据洞察,如 比率(Ratios )显示货币多头和空头头寸的比率(百分比 比率变化 显示所选时间段内的多头比率及其百分比变化 总交易量 显示货币的总交易量(多头和空头),以手为单位 多头 交易量显示货币所有多头头寸的交易量 空头 交易量显示所有货币空头头寸的交易量 净多头 显示净多头交易量,即所有多头头寸减去所有空头头寸(以手为单位)。 净多头百分比 显示货币净多头交易量的变化 请阅读我们的基本教程 -> "如何使用外汇交易量进行交易 " 获取更多信息,如常见问题、交易技巧和教程视频,请访问我们的 外汇交易量公共信息频道 请 安装并运行 SI Connect 以建立与我们数据中心的持续连接 背景信息 我们都知道,外汇是一个分散的市场。这就是为什么我们必须打破常规思维,开发一个独
TPSpro RFI Levels
Roman Podpora
4.82 (22)
指示       俄罗斯 -        英语   建议 与指示器一起使用     -       TPSpro 趋势专业版 -   MT4版本       交易中的一个关键要素是做出买卖交易工具决定的区域或水平。尽管主要参与者试图隐藏他们在市场中的存在,但他们不可避免地会留下痕迹。我们的任务是学习如何识别这些痕迹并正确解释它们。 主要功能: 向卖家和买家显示活跃区域! 该指标显示所有正确的初始买入和卖出脉冲水平/区域。激活这些水平/区域后,开始寻找切入点,水平会改变颜色并填充特定阴影。此外,还会显示箭头,以便更直观地了解情况。 显示更高时间范围内的级别/区域(MTF 模式) 添加了使用更高时间间隔显示级别/区域的功能。此外,该指标还具有自动趋势检测功能(   TPSproTREND PRO   )。 用于交易的单独专业的逐步算法。 该算法专为日内交易而设计,既可顺势交易,也可逆势交易。每个活动模板均提供详细说明。 适用于多种时间范围 。 TPSpro RFI 水平指标可用于图表上的任何时间范围,从一分钟(M1)开始一直到每月(MN)。 图形和声音警报。 该指标提供图形和声音指示
Apollo Pips PLUS SP
Oleg Rodin
5 (4)
请在购买产品之前阅读下面的信息! Apollo Pips PLUS SP 是一款独特的产品!它适合那些想要获得我的新“APOLLO PIPS”指标以及“超级包”奖金以及访问我所有交易指标的人! 通过购买 Apollo Pips PLUS SP 产品,您实际上购买的是全新版本的 Apollo Pips 指标。此版本的指标具有改进的算法和易于使用的参数,使您有机会在任何市场和任何交易风格中使用该指标。 该产品的购买者还可以免费访问我的所有其他指标,作为我的超级奖励!如果您想获得我所有的交易工具,那么该产品非常适合您!:) 但这还不是全部!:) 该产品的所有购买者也有资格免费获得我的新指标!:) 如果我有一个新的交易指标可用,您将能够在我的特权“SUPER PACK”终身奖金计划中完全免费获得它! 购买后请联系我以获得我的交易提示和超级礼包奖金!
目前八折优惠! 对任何新手或专家交易者来说都是最好的解决方案! 这个仪表板软件适用于28种货币对。它基于我们的两个主要指标(高级货币强度28和高级货币冲动)。它对整个外汇市场提供了一个伟大的概述。它显示高级货币强度值,货币运动速度和28个外汇对在所有(9)时间段的信号。想象一下,当你可以使用图表上的单一指标观察整个市场,以确定趋势和或剥头皮的机会时,你的交易将得到改善 我们已经在这个指标中建立了一些功能,使你更容易识别强势和弱势货币,同时识别和确认潜在的交易。该指标以图形方式显示货币的强势或弱势是增加还是减少,以及它在所有时间段的表现。 增加的新功能是动态市场斐波那契水平,它适应当前的市场条件变化,这是一个已经在我们的高级货币强度28和高级货币冲动指标中使用的成熟的加分项。 在交易时,总是将弱势货币和强势货币配对,这个新指标将帮助你做到这一点。 用户手册:点击这里  https://www.mql5.com/en/blogs/post/708783 特点  显示每个时间段的ACS28和GAP-speed(冲动)的货币强度值。 列:颜色代码以7种颜色
FX Power MT4 NG
Daniel Stein
5 (13)
通过 mql5 和 Telegram 上 的晨间简报获取每日市场更新,包括详细信息和屏幕截图 ! FX Power MT4 NG 是我们长期以来非常受欢迎的货币强度计算器 FX Power 的下一代产品。 这款下一代强度计算器能提供什么?您所喜爱的原版 FX Power 的所有功能 附加功能 黄金/XAU 强度分析 更精确的计算结果 可单独配置的分析周期 可自定义计算限制,以获得更好的性能 为希望查看更多信息的用户提供特殊的多实例设置 无尽的图形设置,可在每个图表中设置您最喜欢的颜色 无数的通知选项,让您再也不会错过任何重要信息 采用 Windows 11 和 macOS 风格的全新圆角设计 神奇的移动指标面板 FX Power 主要功能 所有主要货币的完整强势历史 所有时间框架内的货币强弱历史 所有经纪商和图表的计算结果完全相同 100% 可靠的实时计算 -> 无重绘 可通过下拉列表选择分析时段 通过自定义模式单独配置分析时段 可在一个图表中使用多个实例 可移动 FX Power 显示屏(通过拖放) 适用于高分辨率 QHD、UHD 和 4K 显示器 自动终端配置 针对平板电脑
Gold Channel XAUUSD
Paulo Rocha
5 (2)
Gold Channel is a volatility-based indicator, developed with a specific timing algorithm for the XAUUSD pair, which consists of finding possible corrections in the market. This indicator shows two outer lines, an inner line (retracement line) and an arrow sign, where the theory of the channel is to help identify overbought and oversold conditions in the market. The market price will generally fall between the boundaries of the channel. If prices touch or move outside the channel it is a tra
Trend Screener
STE S.S.COMPANY
4.81 (88)
趋势指标,趋势交易和过滤的突破性独特解决方案,所有重要趋势功能都内置在一个工具中! 它是 100% 非重绘多时间框架和多货币指标,可用于所有符号/工具:外汇、商品、加密货币、指数、股票。 限时优惠:支撑和阻力筛选指标仅售 50美元,终身有效。(原价 250 美元)(优惠延长) 趋势筛选器是有效的指标趋势跟踪指标,它在图表中提供带有点的箭头趋势信号。 趋势分析器指标中可用的功能: 1.趋势扫描仪。 2. 具有最大利润分析的趋势线。 3.趋势货币强度计。 4. 带有警报的趋势反转点。 5. 带有警报的强趋势点。 6. 趋势箭头 每日分析示例,每日信号表现...等与我们的趋势筛选指标,可以在这里找到: 点击这里 限时优惠:Trend Screener Indicator 仅售 50 美元且终身可用。原价 125$) 通过访问我们的 MQL5 博客,您可以找到我们所有的高级指标以及分析示例、每日信号表现...等。 : 点击这里 我们的趋势系统由 2 个指标组成: 1. Trend Screener Indicator:显示趋势仪表盘、图表中的趋势线、入场点...等。 2.
Market Reversal Alerts
LEE SAMSON
4.19 (113)
成為突破者,隨著價格反轉,市場結構會改變利潤。 訂單突破者指示器可以識別趨勢或價格走勢何時接近枯竭並準備好逆轉。它會提醒您市場結構的變化,通常會在發生逆轉或重大回調時發生。 該指標使用專有計算來確定突破和價格動能。每當在可能的耗盡點附近形成新的高點時,指標就會繪製最後一個生成該高點的順序塊。然後,它將隨價格移動隨價格跟隨定單。然後,當價格轉向相反方向並突破該訂單塊時,它會提醒您,從而創建新的市場結構並開始趨勢或重大回調的可能逆轉。 訂單塊是在創建高/低之前的最後一個相反的彩色蠟燭,並且當價格跌破這些關鍵區域以下時,這表明趨勢可能會發生短期或長期反轉。 特徵 提醒您關鍵耗盡點的市場結構變化 價格接近耗盡水平時自動提取訂單塊 在一個方向繼續移動時,在價格後面跟踪定單,以提醒您最佳的反轉輸入 將顏色更改為純色塊,以顯示何時發生市場結構中斷。 適用於所有交易品種和時間範圍 內置集成的彈出窗口和電子郵件警報 策略和如何與定單破壞者指標進行交易 當斷路器塊發生時,您有兩個選擇。 看左邊!我們正在尋求供應/需求或支撐/阻力位嗎?市場結構轉變(逆轉)通常發生在價格重新測試舊水平或
首先,值得强调的是,这个交易工具是非重绘、非重画和非滞后的指标,非常适合专业交易。 在线课程,用户手册和演示。 智能价格行动概念指标是一个非常强大的工具,既适用于新手,也适用于经验丰富的交易者。它将超过20个有用的指标合并到一个指标中,结合了高级交易思想,如内圈交易员分析和智能资金概念交易策略。该指标侧重于智能资金概念,提供有关大型机构交易方式的见解,帮助预测它们的动向。 它在流动性分析方面尤其擅长,有助于理解机构的交易方式。它擅长预测市场趋势,并仔细分析价格波动。通过将您的交易与机构策略对齐,您可以更准确地预测市场走向。该指标多才多艺,擅长分析市场结构,识别重要的订单区块,并识别各种模式。 它擅长识别BOS和CHoCH等模式,理解动量的转变,并突出显示供需强劲的关键区域。它还擅长发现强大的不平衡,并分析价格创造更高高点或更低低点的模式。如果您使用斐波那契回撤工具,该指标可以满足您的需求。它还可以识别相等的高点和低点,分析不同的时间框架,并通过仪表板显示数据。 对于使用更高级策略的交易者,该指标提供了工具,如公平价值差指标和优惠和折扣区域的识别。它特别关注高时间框架订单
Currency Strength Exotics
Bernhard Schweigert
4.87 (30)
目前8折优惠! 对任何新手或专家交易者来说都是最好的解决方案! 这个指标是专门用来显示任何符号的货币强度,如异国货币对、商品、指数或期货。它是同类产品中的第一个,任何符号都可以添加到第9行,以显示黄金、白银、石油、DAX、US30、MXN、TRY、CNH等的真实货币强度。这是一个独特的、高质量的、负担得起的交易工具,因为我们已经纳入了一些专有的功能和一个新的公式。想象一下,你的交易将如何改善,因为你能够准确地确定新趋势或剥头皮机会的触发点? 用户手册:点击这里   https://www.mql5.com/en/blogs/post/708876 它适用于所有时间框架。你将很快能够看到TREND! 根据新的基础算法设计,它使识别和确认潜在交易变得更加容易。这是因为它以图形方式显示了8种主要货币和一种符号的强弱。 该指标显示了8种主要货币(澳元加元瑞士法郎欧元英镑日元新西兰美元)的强弱线,再加上一个符号! 该指标显示了符号的真实价值。例如:对于XAUUSD(黄金):价格以美元报价。如果黄金在上涨,你怎么能知道是黄金的强势还是美元的弱势?只有当黄金走强时,我们才会进行
M1 Gold
Abdulkarim Karazon
Enigmera
Ivan Stefanov
5 (3)
ENIGMERA:市场核心 https://www.enigmera.com 简介 该指标和交易系统是金融市场的一种非凡方法。ENIGMERA 利用分形周期精确计算支撑位和阻力位。它能显示真实的累积阶段,并给出方向和目标。 该系统无论在趋势中还是在修正中都能发挥作用。 它是如何运行的? ENIGMERA 由三条线组成:支撑/阻力线、目标线和偏离线。与一般市场指标将过去的数据推断为现在和未来的情况不同,该系统能提供当前的完整情况。如果你处于支撑位,这意味着真正的支撑;如果你处于阻力位,这意味着真正的阻力。如果突破某一水平,则表示趋势发生变化。没有重绘。 由于市场在不断变化,ENIGMERA 不断调整其评估工具,定期修改策略。  这保证了每种情况都能得到全面评估。这一市场指标的独特性显而易见,其能力不言而喻。  ENIGMERA 为金融分析师和咨询师提供服务,他们需要可靠的见解与客户分享,也为投资者提供服务,他们需要最精确和最可靠的保证。 该系统能够达到最佳精度,使交易者能够自信、清晰地评估他们的选择。 ENIGMERA 将 20 年的交易专长和知识整合到一个综合软件
Stratos Pali
Michela Russo
5 (1)
Stratos Pali Indicator   is a revolutionary tool designed to enhance your trading strategy by accurately identifying market trends. This sophisticated indicator uses a unique algorithm to generate a complete histogram, which records when the trend is Long or Short. When a trend reversal occurs, an arrow appears, indicating the new direction of the trend. Important Information Revealed Leave a review and contact me via mql5 message to receive My Top 5 set files for Stratos Pali at no cost! D
此儀表板是與市場結構反轉指標一起使用的警報工具。它的主要目的是提醒您在特定時間範圍內的逆轉機會,以及像指標一樣重新測試警報(確認)。儀表板設計為單獨放置在圖表上,並在後台工作,以向您發送有關您選擇的貨幣對和時間範圍的警報。它是在許多人要求衝刺以同時監控多個貨幣對和時間框架而不是讓市場反轉指標在一個 MT4 中的多個圖表上運行之後開發的。它會在 M5、M15、M30、H1、H4 和 D1 時間範圍內發出警報。當然,與交易中的任何事情一樣,更高的時間框架效果最好。 該儀表板被設計為市場結構反轉指標的附加組件。它將獨立工作,並提醒市場反轉警報指標給出的模式和信號。 在此處獲取市場反轉警報指標: https://www.mql5.com/en/market/product/46295 此儀表板的 MT5 版本可在此處獲得: https://www.mql5.com/en/market/product/65828 此處提供 EA:汽車交易市場反轉警報! https://www.mql5.com/en/market/product/65383 我創建的用於繪製矩形並提醒特定貨幣對的市
ICT, SMC, SMART MONEY CONCEPTS, SMART MONEY, Smart Money Concept, Support and Resistance, Trend Analysis, Price Action, Market Structure, Order Blocks, BOS/CHoCH,   Breaker Blocks ,  Momentum Shift,   Supply&Demand Zone/Order Blocks , Strong Imbalance, HH/LL/HL/LH,    Fair Value Gap, FVG,  Premium  &   Discount   Zones, Fibonacci Retracement, OTE, Buy Side Liquidity, Sell Side Liquidity, BSL/SSL Taken, Equal Highs & Lows, MTF Dashboard, Multiple Time Frame, BigBar, HTF OB, HTF Market Structure, 
MetaBands M4
Vahidreza Heidar Gholami
5 (2)
MetaBands使用强大且独特的算法绘制通道并检测趋势,以便为交易者提供进出交易的潜在点。它是一个通道指标和强大的趋势指标。它包括不同类型的通道,可以通过使用输入参数简单地合并以创建新通道。MetaBands使用所有类型的警报通知用户市场事件。 功能 支持大多数通道算法 强大的趋势检测算法 能够合并不同类型的通道 多时间帧和多货币(信号矩阵) 所有类型的警报功能(声音、屏幕闪烁、推送通知、电子邮件、弹出窗口、箭头) 它永远不会重绘 趋势检测 MetaBands使用在通道内振荡的蓝色线来检测趋势。当该线遇到通道的上界时,表明开始下跌趋势,当它遇到下界时,表明开始上涨趋势。如果蓝线接近中线,则市场处于整理期。 该指标使用独特的方法来检测趋势。一开始可能看起来有些复杂,但如果您观看视频教程,您就会意识到它是多么强大且易于使用。 入场和出场信号 当趋势变化或价格穿过上下通道时,MetaBands会立即通过不同的方法提醒交易者,这些方法可以在指标设置中启用。 信号矩阵 要监视来自不同时间框架的多个符号并在一个地方查看信号,请单击右上角按钮或按键盘上的M键以打开信号矩阵。该矩阵可以
Shepherd Harmonic Pattern
Abdullah Alrai
4.65 (49)
这个指标将检测手动和自动方法在图表上绘制的谐波模式。 您可以从此链接查看用户手册: 添加您的评论并联系我们以获得它 有一个免费版本可以在mt4上尝试此产品。 您可以使用它来检测Gartley和Nenstar模式: https://www.mql5.com/en/market/product/30181 您可以从以下链接购买完整的MT4版本: https://www.mql5.com/en/market/product/15212 注意 指标具有控制面板,并将保存每个(图表和时间框架)设置。 您可以将其最小化以在图表上获得更多空间,并且如果您更喜欢使用其他分析工具,则可以按关闭按钮隐藏所有指标数据 当您使用此指标并更改设置,添加诸如移动平均线或布林带之类的指标时,此指标将自动保存您的模板编辑,并且您可以随时加载它们。 如果您使用的是Windows 10,请右键单击MetaTrader图标>兼容性>更改高DPI设置>系统(增强)以获得最佳屏幕设置(应在高清设备中完成)。 指标只是谐波交易理论的解释,用于检测图表上的谐波模式。 如果您想学习它,可以搜索Scott Carney的书,名为“Ha
Trend Pulse
Mohamed Hassan
5 (4)
Please contact me after purchase to immediately get your PDF strategy + documentation for Trend Pulse !  Introducing Trend Pulse , a unique and robust indicator capable of detecting bullish, bearish, and even ranging trends! Trend Pulse uses a special algorithm to filter out market noise with real precision. If the current symbol is moving sideways, Trend Pulse will send you a ranging signal, letting you know that it's not a good time to enter a trade. This excellent system makes Trend Pulse
Advanced Currency Strength28 Indicator
Bernhard Schweigert
4.9 (651)
目前26%的折扣 任何新手或专家交易者的最佳解决方案! 这个指标是一个独特的、高质量的、可负担得起的交易工具,因为我们纳入了一些专有的功能和一个新的公式。只需一个图表,你就可以读出28个外汇对的货币强度!想象一下,你的交易将如何得到改善,因为你的交易是在你的手中进行的。想象一下,你的交易将如何改善,因为你能够准确地确定新趋势或剥头皮机会的触发点? 用户手册:点击这里  https://www.mql5.com/en/blogs/post/697384 这是第一本,原版的! 不要买一个毫无价值的崇拜者的克隆品。 特别的 子窗口中的箭头显示强劲的货币势头GAP将指导你的交易! 当基础货币或报价货币处于超卖/超买区域(外盘斐波那契水平)时,在个人图表的主窗口中出现警告信号。 当货币力量从外围区间回落时,回撤/反转警报。 十字星模式的特别警报 可选择多个时间框架,以快速查看趋势! 货币强度线在所有的时间框架中都非常平稳,当使用较高的时间框架来识别总体趋势,然后使用较短的时间框架来确定精确的入口时,效果非常好。你可以根据自己的意愿选择任何时间框架。每个时间框架都由其自身进
PRO Renko System
Oleg Rodin
5 (25)
PRO Renko Arrow Based System for trading renko charts.  准确的信号交易任何外汇工具. 另外,我将免费提供系统的附加模块! PRO Renko系统是RENKO图表上高度准确的交易系统。该系统是通用的。 该交易系统可应用于各种交易工具。 该系统有效地中和了所谓的市场噪音,打开了获得准确反转信号的通道。 该指标易于使用,只有一个参数负责产生信号。 您可以很容易地使算法适应您感兴趣的交易工具和renko酒吧的大小。 我很乐意通过提供任何咨询支持来帮助所有客户有效地使用该指标。 祝您交易成功!购买后,立即写信给我! 我将与您分享我的建议和我的renko发电机。 另外,我将免费提供系统的附加模块!
Scalper Vault
Oleg Rodin
5 (27)
Scalper Vault 是一个专业的剥头皮系统,为您提供成功剥头皮所需的一切。该指标是一个完整的交易系统,可供外汇和二元期权交易者使用。推荐的时间范围是 M5。 该系统为您提供趋势方向的准确箭头信号。它还为您提供顶部和底部信号以及江恩市场水平。无论您拥有何种交易经验,该系统都易于使用。您只需要遵循简单的规则并每天重复该过程。 建议将此系统用于主要货币对。感谢您的关注! 请注意,该指标在策略测试器中可能无法正常工作。因此,我建议仅在模拟或真实账户的真实交易条件下使用该系统。 指示器提供所有类型的警报,包括推送通知。 购买指标后请与我联系。我将免费与您分享我的个人交易建议和出色的奖励指标! 祝您交易愉快,盈利!
介绍 ON Trade Waves Patterns Harmonic Elliot Wolfe,这是一款高级指标,旨在使用手动和自动方法检测各种市场模式。以下是它的工作原理: 谐波模式: 该指标可以识别出现在您图表上的谐波模式。这些模式对于练习谐波交易理论的交易者非常重要,正如Scott Carney的书《谐波交易第1卷和第2卷》所描述的那样。无论您是手动绘制它们还是依赖自动检测,ON Trade Waves Patterns都可以胜任。 控制面板: 我们配备了一个用户友好的控制面板,它会保存您的图表和时间帧设置,使您可以轻松切换不同配置。您甚至可以最小化它以最大化图表空间。如果您更喜欢使用其他分析工具,只需单击关闭按钮即可隐藏所有指标数据。 模板保存: 当您自定义设置或添加其他指标,如移动平均线或布林带时,该指标会自动保存您的模板。这意味着您可以随时轻松加载您喜欢的设置。 优化显示: 对于Windows 10用户,我们建议调整您的DPI设置以获得高清设备上的最佳屏幕体验。右键单击MetaTrader图标,选择“兼容性”,然后选择“更改高DPI设置”,将其设置为“系统(增强)”。
Quantum Trend Sniper Indicator MT4
Bogdan Ion Puscasu
4.64 (36)
介绍   量子趋势狙击指标 ,突破性的 MQL5 指标,正在改变您识别和交易趋势反转的方式!由拥有超过13年交易经验的资深交易员团队开发,     量子趋势狙击指标   旨在通过其创新的方式以极高的准确度识别趋势反转,将您的交易之旅推向新的高度。 ***购买量子趋势狙击指标,即可免费获得量子突破指标!*** 当量子突破指标识别出趋势反转时,它会向您发出警报和信号箭头,并建议您三个止盈水平。 它既适合新手交易者,也适合专业交易者。 量子 EA 通道:       点击这里 MT5版本:       点击这里 建议: 时间范围:  所有时间范围。为了获得最佳结果,我们建议在 M15、M30 和 H1 时间范围内使用它。 货币对:欧元兑美元、英镑兑美元、澳元兑美元、欧元兑英镑, EURAUD, XAUUSD 账户类型:ECN、Raw 或 Razor,点差极低 经纪时间:任意 经纪商:IC Markets、Pepperstone with Raw 和 Razor 的点差最低 建议止损:50 点 建议止盈水平:20 点、50 点和 1
作者的更多信息
This is an indicator of trading instruments' correlation. It shows the difference of price values of two symbols. The increase in price divergence and the reduction of price divergence can be seen as signals to transactions. The indicator can be used for hedge strategies. The indicator sends Alerts and Push-notifications to the mobile app about the crossing of the moving averages of Envelopes. The indicator has a simple setup. You need to put him in the window of the traded instrument and choose
This is a full-fledged Price Action trading system based on the searching for entry points at the moment when the price breaks the trend lines. The indicator finds and draws the lines of support, resistance and horizontal levels. When the price crosses these lines, the indicator gives signal Alert and sends a Push notification. You can also draw your own lines, and the indicator will also work with them and give signal Alerts and Push notifications about price crossing all your lines. Your own
筛选:
loh kheng keat
182
loh kheng keat 2020.11.01 14:32 
 

Nice indicator and helpful developer. You can manually on/off for the alert when price break previous day/week high and low range and much more.

Trusow
317
Trusow 2020.10.24 12:44 
 

Do not buy this indicator unless if you want to be alerted several times a day. You cannot turn off alerts for this indicator. Also the programmer needs to set a timer after it touches the line not to alert again for 2 hours or something about the same line. What happens is it’ll cross back and forth and next thing you know you’ll have 5 alerts blowing up your phone telling you the same thing “high of the week” or whatever it may be. Very annoying not being able to turn off the alerts.

Abdul Hakeem
507
Abdul Hakeem 2020.10.04 23:44 
 

Excellent product from a very helpful developer who has made further improvements. Planning to buy the MT5 version.

Juda Mlangeni
297
Juda Mlangeni 2020.03.19 12:01 
 

This indictor doesn't work dnt waste your time its a scam

回复评论
版本 2.2 2020.11.01
Added settings for enabling or disabling Alerts and drawing arrows.
版本 2.1 2020.10.03
Added Push-notifications (to the mobile app) about crossing levels. You can enable it using the MetaQuotes ID.
版本 2.0 2020.09.24
This is a new version completely rewritten and compiled for new build. Also some visual changes.
版本 1.1 2015.06.15
Implemented selection of a window where the indicator will be located