• 概述
  • 评论
  • 评论
  • 新特性

BS Trend Line

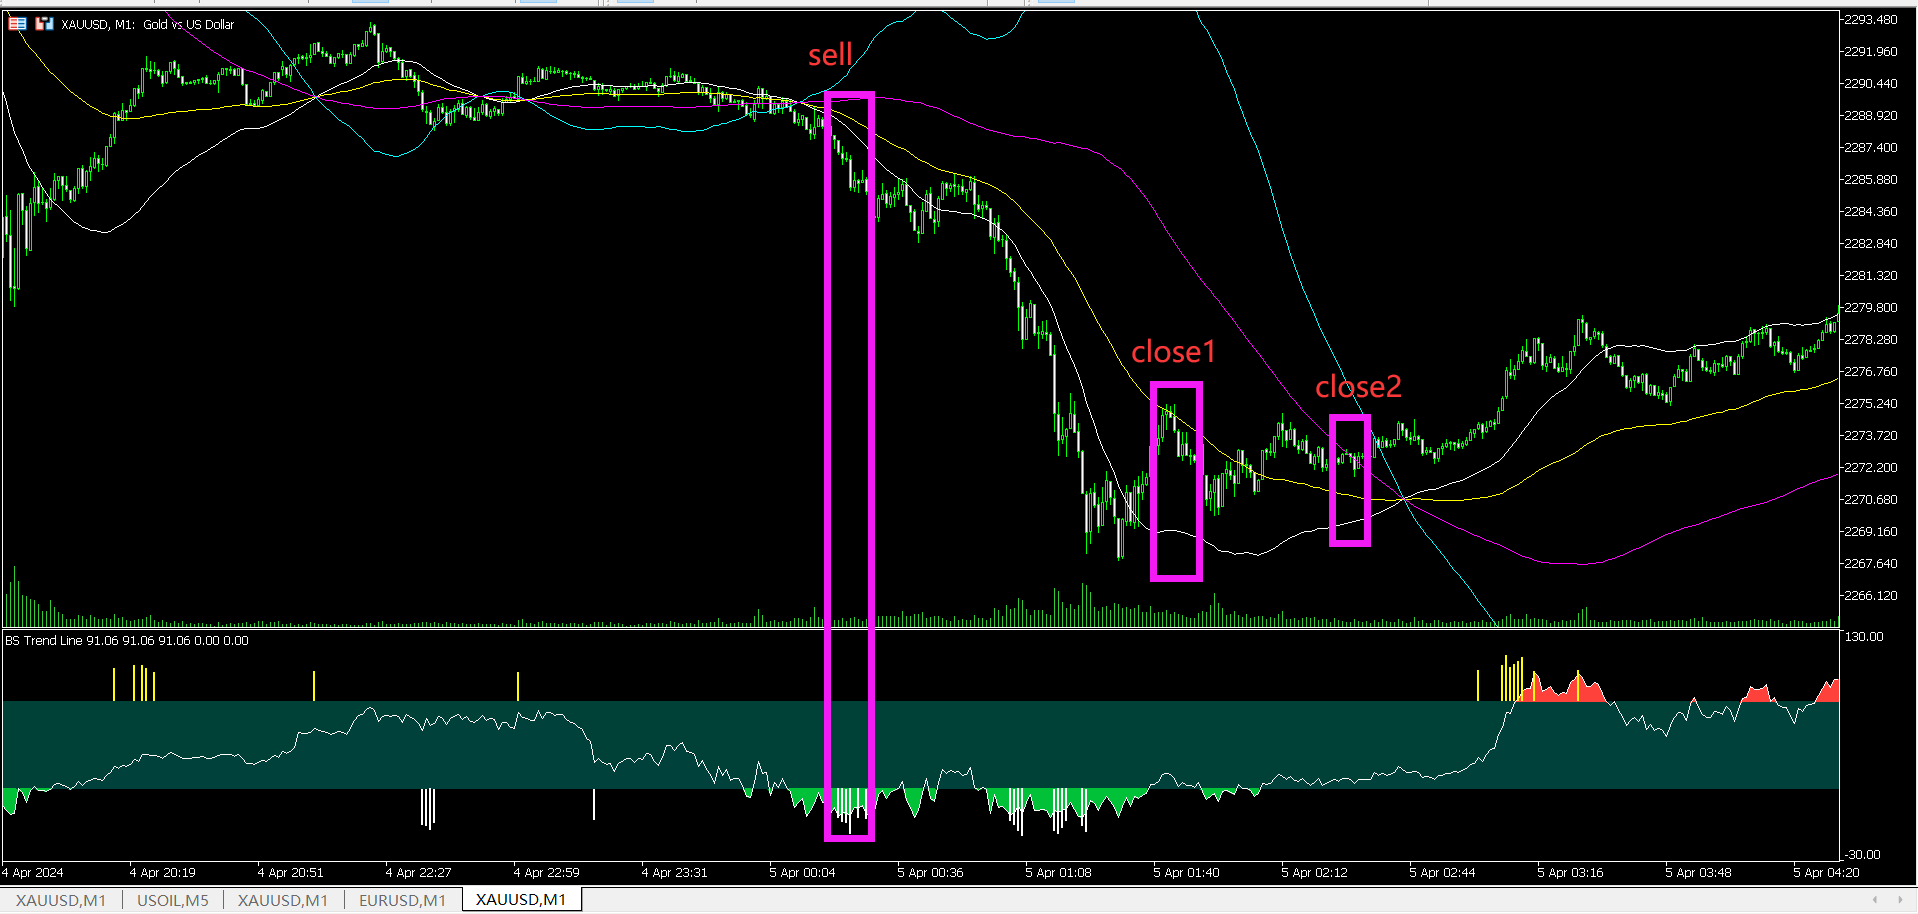
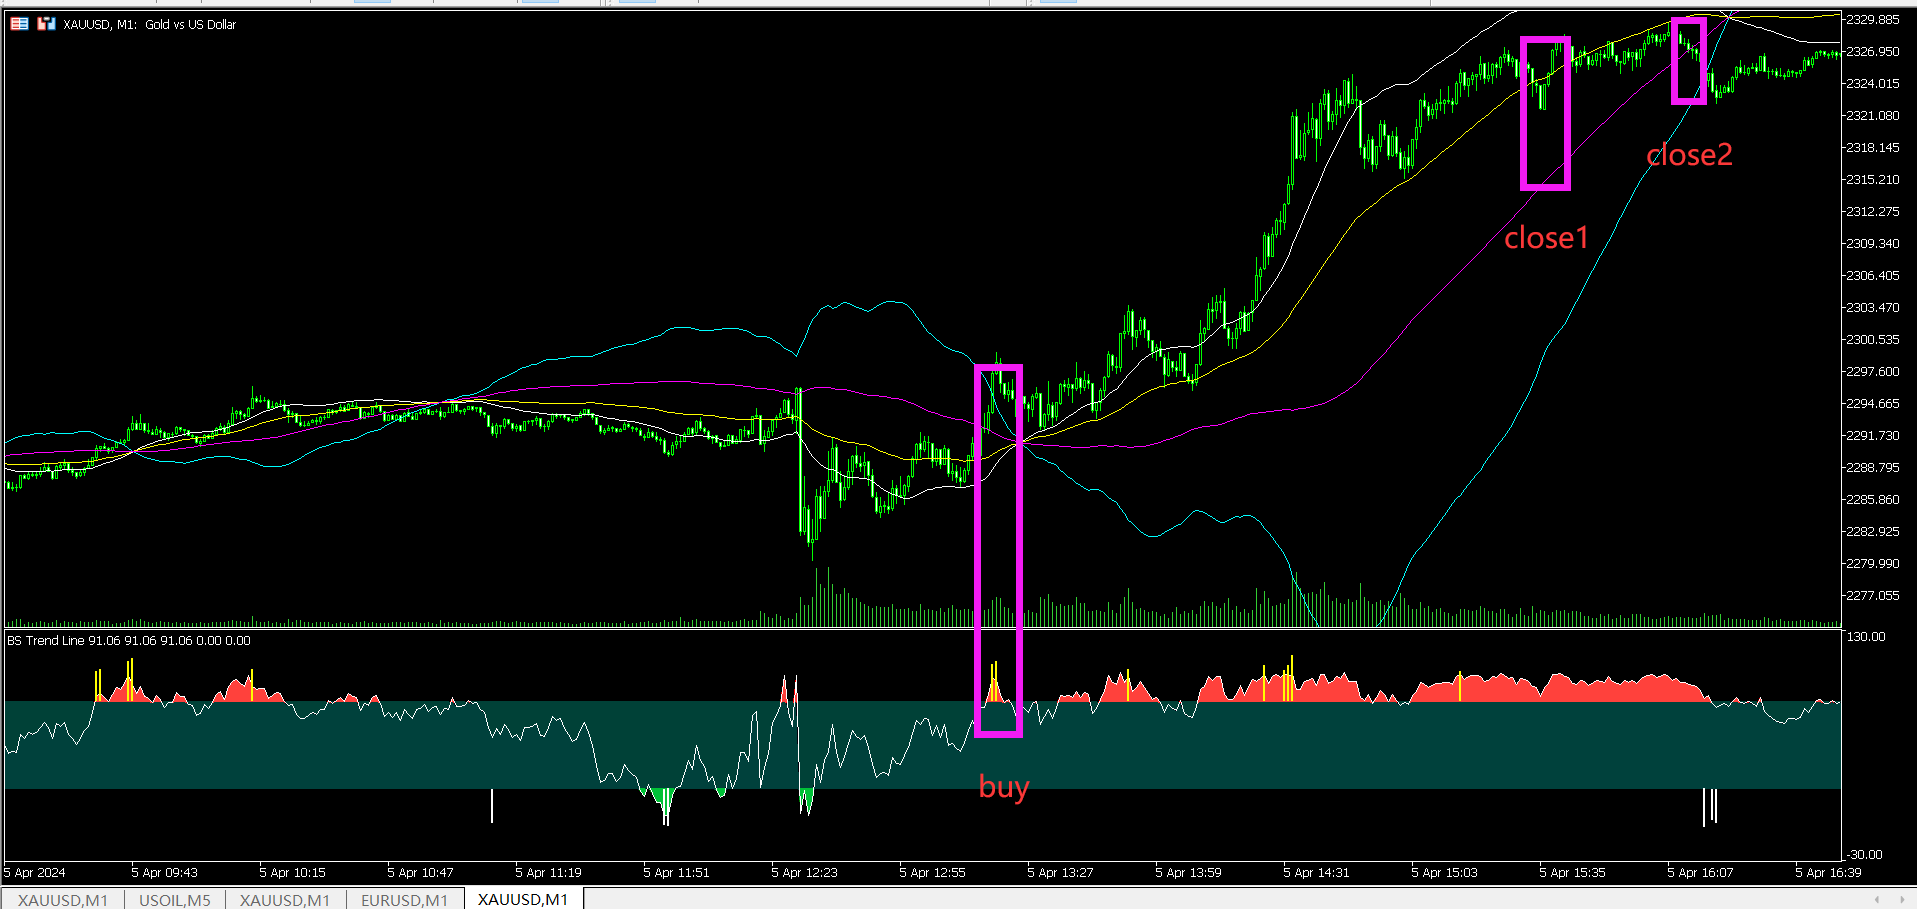
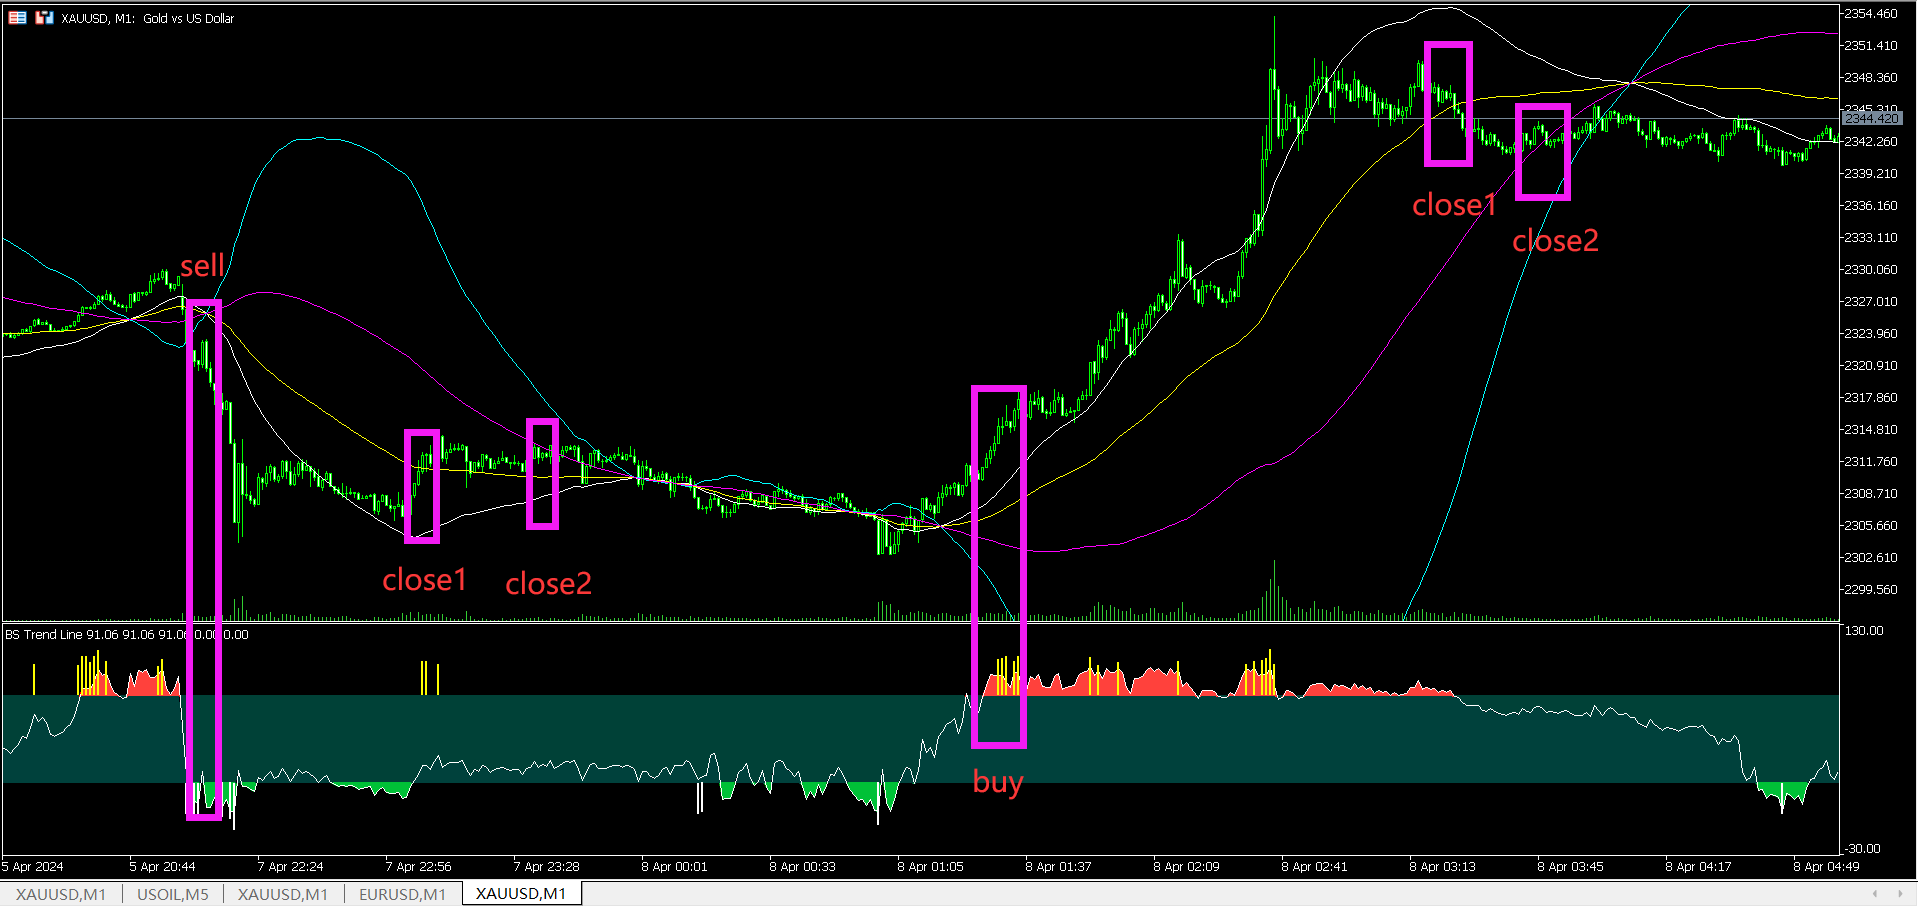
BS Trend Line是一款很好的买卖指示器,不含有未来函数,不会重绘,新版本已经加入了更好的过滤算法,开单成功率有了很大的提高,是一个很好的波段交易提示器,尤其是配合 SourcePoint 会有更明显的效果,它能帮你过滤掉接近70%以上的无效交易信号。

===================参数列表=====================

timeframe:M1

gip:30

sip:6

up line:80

down line:20

===================使用方法=====================

配合 SourcePoint 使用时, SourcePoint 的参数

fastP: 96

slowP:208

avgP:72


推荐产品
Owl Smart Levels MT5
Sergey Ermolov
4.07 (28)
MT4版本  |   FAQ Owl Smart Levels Indicator 是一個完整的交易系統,包含 Bill Williams 的高級分形、構建正確的市場波浪結構的 Valable ZigZag 以及標記準確入場水平的斐波那契水平等流行的市場分析工具 進入市場和地方獲利。 策略的详细说明 指示灯使用说明 顾问-贸易猫头鹰助手助理 私人用户聊天 ->购买后写信给我,我会将您添加到私人聊天中,您可以在那里下载所有奖金 力量在於簡單! Owl Smart Levels 交易系統非常易於使用,因此適合專業人士和剛開始研究市場並為自己選擇交易策略的人。 策略和指標中沒有隱藏的秘密公式和計算方法,所有策略指標都是公開的。 Owl Smart Levels 允許您快速查看進入交易的信號,突出顯示下訂單的水平並向您發送有關已出現信號的通知。 優點很明顯: 清楚地顯示主要和更高時間框架的趨勢方向。 指示儀器信號的出現。 標記開單、止損設置和固定利潤的水平。 沒有多餘的,只有必要的結構! ZigZag 表示全球趨勢的方向,因此也表示貿易方向。 市場反轉點的短線清楚地表明在什麼水平上構建斐波那
PipFinite Trend PRO MT5
Karlo Wilson Vendiola
4.84 (551)
Breakthrough Solution For Trend Trading And Filtering With All Important Features Built Inside One Tool! Trend PRO's smart algorithm detects the trend, filters out market noise and gives entry signals with exit levels. The new features with enhanced rules for statistical calculation improved the overall performance of this indicator. Important Information Revealed Maximize the potential of Trend Pro, please visit www.mql5.com/en/blogs/post/713938 The Powerful Expert Advisor Version Automatin
Trend Catcher with Alert MT5
Issam Kassas
4.71 (78)
趋势捕捉器: 具有警示指标的趋势捕捉器策略是一种多功能的技术分析工具,可帮助交易员识别市场趋势和潜在的进出点。它采用动态趋势捕捉器策略,根据市场条件进行调整,清晰地呈现趋势方向。交易员可以自定义参数,以符合其偏好和风险容忍度。该指标有助于识别趋势,发出潜在的反转信号,充当跟踪止损机制,并提供实时警报,以便及时应对市场。 具有警示指标的趋势捕捉器策略是一种多功能的技术分析工具,可帮助交易员识别市场趋势和潜在的进出点。它采用动态趋势捕捉器策略,根据市场条件进行调整,清晰地呈现趋势方向。交易员可以自定义参数,以符合其偏好和风险容忍度。该指标有助于识别趋势,发出潜在的反转信号,充当跟踪止损机制,并提供实时警报,以便及时应对市场。 特点: 趋势识别:信号牛市趋势和熊市趋势。 趋势反转:当蜡烛颜色从牛市变为熊市,反之亦然时,提醒可能的反转。 实时警报:为新趋势识别生成警报。 建议: 货币和货币对:EURUSD,AUDUSD,XAUUSD... 时间框架:H1。 账户类型:任何ECN,低点差账户。
FREE
Point Black
Ignacio Agustin Mene Franco
Black Card Pack indicator 5/1 point black It has the strategy of professional bollingers where each arrow gives you a different entry signal. It is used to operate in m1 and in d1 It is used for scalping and intraday, modified for forex markets ! suitable for all pairs modified for synthetic index markets suitable for all pairs! Ideal for volatility and jumps!
Maximum Trend Arrows OT MT5
Mulweli Valdaz Makulana
STRICTLY FOR BOOM INDEX ONLY!!!!! Here I bring the Maximum Trend Arrows OT1.0 MT5 indicator. This indicator is made up of a combination of different trend indicators for entries and exits, for entries an orange arrow will paint on the chart below the current market and a red flag for closing of trades and it produces buy arrows only. When the orange arrow appears, it will appear along with it's sound to notify you. The 1H timeframe is recommended, don't use it anywhere else than on the 1H timefr
PZ Penta O MT5
PZ TRADING SLU
The Penta-O is a 6-point retracement harmonacci pattern which usually precedes big market movements. Penta-O patterns can expand and repaint quite a bit. To make things easier this indicator implements a twist: it waits for a donchian breakout in the right direction before signaling the trade. The end result is an otherwise repainting indicator with a very reliable trading signal. The donchian breakout period is entered as an input. [ Installation Guide | Update Guide | Troubleshooting | FAQ | A
Atomic Analyst MT5
Issam Kassas
4.32 (19)
首先值得强调的是,该交易指标是非重绘、非延迟的指标,这使其成为手动和机器人交易的理想选择。 用户手册:设置、输入和策略。 Atomic Analyst是一种PA价格行动指标,利用价格的力量和动量来寻找市场上更好的机会。配备了高级过滤器,可帮助去除噪音和假信号,并提高交易潜力。使用多层复杂的指标,Atomic Analyst扫描图表,并将复杂的数学计算转化为任何初学者都能理解并用来做出一致交易决策的简单信号和颜色。 “Atomic Analyst”是专为新手和经验丰富的交易者量身定制的综合交易解决方案。它将高级指标和一流功能融合为一体的交易策略,使其成为所有类型交易者的多功能选择。 日内交易和剥头皮策略:专为快速准确的日内交易和短期交易而设计。 日内和摆动交易策略:可用作追求价格大幅波动的日内和摆动交易者的可靠工具。 多货币和市场:凭借其可靠的精度,在不同的工具和市场上运作。 多个时间框架:可在多个时间框架上使用,性能良好。 稳定性:所有指标均不重绘、不重绘和不滞后,确保可靠的信号。 信号清晰度:提供箭头信号,用于清晰的入场和出场点。 实时警报:通过交易入场、SL和TP警报通知交易者
Noize Absorption Index
Ekaterina Saltykova
Noize Absorption Index - is the manual trading system that measures the difference of pressure between bears forces and bulls forces. Green line - is a noize free index that showing curent situation. Zero value of index shows totally choppy/flat market.Values above zero level shows how powerfull bullish wave is and values below zero measures bearish forces.Up arrow appears on bearish market when it's ready to reverse, dn arrow appears on weak bullish market, as a result of reverse expectation.
Trend Lines Supports and Resistances is an indicator that analyses the market structure, identifies Pivot Points, displays active Support/Resistance zones and trend levels. Main Features: Defining and displaying Pivot Points. Analyse Pivot Points to build and display trend lines. Setting up visual display of trend lines. Setting up trend lines broken notifications. Analyse Pivot Points to define and display support and resistance levels. Setting up visual display of support and resistance leve
Flow Bookmap
Thalles Nascimento De Carvalho
Flow Bookmap:可视化市场流动并保护您的交易 ️ 想通过准确的买卖信息主宰市场吗? Flow Bookmap 是一款为希望深入了解市场行为的交易者设计的终极工具。它将订单流数据转化为 MT5 图表上的直观界面,突出显示对快速和安全决策至关重要的区域。 如何运作 Flow Bookmap 解释了市场上买家和卖家之间的互动,突出了关键的不平衡区域(imbalances): 当买方占主导地位时,价格往往会下跌,因为卖方在更有利的条件下调整价格。 当卖方占主导地位时,价格往往会上涨,基于相同的平衡逻辑。 此外,指标直接在图表上绘制信息,随着实时数据的收集创建历史。这意味着,随着计算的完成,指标会构建不平衡区和买卖双方的互动,允许动态且精准地可视化市场条件。大宗价格区间充当图表上的防守区域,帮助保护您的交易。 Flow Bookmap 的独特优势 1️⃣ 清晰直观的图形界面 直接在图表上查看: 突出的买卖双方。 不平衡区域(imbalances)使用特定颜色: 绿色:强烈的买方压力。 红色:强烈的卖方压力。 金色(Gold):关键的不平衡区域。 2️⃣ 利用兴
Golden Spike Premium
Kwaku Bondzie Ghartey
Golden Spikes Detector Acknowledgement and Dedications:  The name of this indicator was Inspired by an Original; Mr Grant Koopman; a Knowledgeable and experienced Synthetics trader. I dedicate this indicator to Mr Grant.  Overview:   The Golden Spikes Premium is a groundbreaking trading indicator meticulously crafted for the Boom and Crash indices on the Deriv market. Tailored to meet the needs of discerning traders, this powerful tool operates exclusively on the one-minute timeframe, providing
Renko Gold
Ignacio Agustin Mene Franco
Renko Gold! clearly indicates the floors and ceilings where it goes from 4 lines, the line below that marks the floor in green confirming with the thinnest line clarifies the purchase entry, the same is for sale, the top line marks the ceiling and the thinnest red line marks the sale, This indicator works for all temporalities! For Forex and Synthetic Indices markets! It also works for crypto markets! Good profit! World Investor.
Double HMA MTF for MT5
Pavel Zamoshnikov
4 (4)
This is an advanced multi-timeframe version of the popular Hull Moving Average (HMA) Features Two lines of the Hull indicator of different timeframes on the same chart. The HMA line of the higher timeframe defines the trend, and the HMA line of the current timeframe defines the short-term price movements. A graphical panel with HMA indicator data from all timeframes at the same time . If the HMA switched its direction on any timeframe, the panel displays a question or exclamation mark with a tex
SolarTrade Suite 金融指标:木星市场指标 - 您在金融市场世界中的可靠指南! 这是一个趋势指标,使用特殊的创新和高级算法来计算其值,并且具有令人赏心悦目的设计。 很容易理解此指标的读数:蓝色 - 买入,红色 - 卖出。 在说明底部查看我们来自 SolarTrade Suite 系列的其他产品。 您想自信地驾驭投资和金融市场的世界吗? SolarTrade Suite 金融指标:木星市场指标是一款创新软件,旨在帮助您做出明智的投资决策并增加您的利润。 SolarTrade Suite 金融指标:木星市场指标的优势: - 准确预测:我们的指标使用先进的算法和分析方法来准确预测市场走势。 接收有关买卖资产最佳时机的信号。 - 用户友好界面:直观的界面将使您能够轻松掌握该程序并在安装后立即开始享受其好处。 您可以从设置中更改点的大小和颜色、灵敏度和速度,所有其他设置都是自动完成的。 - 专家支持:我们的专业团队随时准备为您解答任何问题并提供有关使用该程序的建议。 为什么选择 SolarTrade Suite 财务指标:木星市场指标? - 可靠性和准确性:该
关于指标 该指标基于金融工具收盘价的蒙特卡罗模拟。按照定义,蒙特卡罗是一种统计技术,用于通过基于之前观察的结果的随机数来模拟不同结果的概率。 它是如何工作的? 该指标通过基于历史数据模拟随时间变化的随机价格变动,为证券生成多个价格情景。每次模拟试验使用随机变量来有效地模拟未来在给定时间范围内的市场波动,重点在 收盘价 的波动。 蒙特卡罗模拟的优势 - 蒙特卡罗模拟通过在多种可能的未来情景下进行测试,有助于分析不同交易策略的风险。 - 它有助于确定策略在不同市场条件下的表现,包括罕见的极端事件(尾部风险)。 - 与依赖单点预测不同,蒙特卡罗提供了具有相关概率的潜在结果范围。这有助于理解盈利或亏损的可能性。 对于希望基于不同结果的概率而不是绝对预测来管理风险的交易者来说,蒙特卡罗是一个有用的工具。
Trend Master Chart MT5
Frederic Jacques Collomb
Trend Master Chart。 它覆盖图表并使用颜色编码来定义不同的市场趋势/走势。 它使用结合了两个移动平均线和不同振荡器的算法。 这三个元素的周期是可以修改的。 它适用于任何时间范围和任何货币对。 您一眼就能识别出上升或下降趋势以及该趋势的不同切入点。 例如,在明显的上升趋势(浅绿色)期间,该趋势中的不同市场冲动将通过深绿色蜡烛显示。 可配置的警报将使您永远不会错过这些冲动之一。 MT4版本。 输入参数: Period 1: 快速周期移动平均线。 Period 2: 慢周期移动平均线。 Oscillator period :振荡器周期。 Sell/Buy alert: 市场冲动警报、趋势切入点。 Bullish/Bearish: 趋势变化时发出警报。 可以通过弹出/邮件和推送通知方式发出警报。 完全可配置的警报文本。 想要查看其他免费 SPARTACUS 指标, 请点击此处 SPARTACUS2024
Renko System
Marco Montemari
This indicator can be considered as a trading system. It offers a different view to see the currency pair: full timeless indicator, can be used for manual trading or for automatized trading with some expert advisor. When the price reaches a threshold a new block is created according to the set mode. The indicator beside the Renko bars, shows also 3 moving averages. Features renko mode median renko custom median renko 3 moving averages wicks datetime indicator for each block custom notification
Terra Infinity
Ivan Simonika
Terra Infinity is a flat indicator. This improved version of the CalcFlat indicator has three additional lines that significantly increase its effectiveness. Unlike its predecessor with two static levels, Terra Infinity adds three dynamic lines above the main histogram, which are interpreted as follows: base signal line, minimum signal line, maximum signal line. These lines are formed using the additional parameter Avg, which is the average value of the histogram. Averaging produces a line cl
MSnR Lines
Pierre Paul Amoussou
MSnR Lines 是一个自定义指标,旨在在图表上显示支撑和阻力水平。这些水平基于马来西亚支撑和阻力理论,该理论将水平定义为特定的价格水平,而不是区域,这些价格水平是从线图的峰值和谷值中派生出来的。 特点: 三种类型的水平:A-Level,V-Level和间隙水平。 水平的新鲜度指示:新鲜水平比非新鲜水平更重要。新鲜水平指尚未被测试或已经被交易。 可自定义新鲜水平和非新鲜水平的颜色和样式。 仅显示新鲜水平或所有水平的选项。 可调整的回溯期和当前价格上下方水平的数量。 支持多时间框架。 用途: 交易者可以使用MSnR Lines来识别潜在的支撑和阻力水平以做出交易决策。新鲜水平被认为更为重要,并且可能提供更好的交易机会。此外,交易者还可以根据不同时间框架上的水平来进行多时间框架分析,以提高交易决策的准确性和可靠性。
ATrend
Zaha Feiz
4.77 (13)
ATREND: 工作原理及使用方法 工作原理 “ATREND”指标针对MT5平台设计,旨在通过结合多种技术分析方法为交易者提供强有力的买卖信号。该指标主要利用平均真实波幅(ATR)来测量波动性,并结合趋势检测算法来识别潜在的市场动向。 购买后请留言,您将获得特别的赠品。 主要特点: - 动态趋势检测:该指标评估市场趋势并相应调整信号,帮助交易者与当前市场条件对齐策略。 - 波动性测量:通过使用ATR,该指标衡量市场波动性,这对于确定最佳止损(SL)和止盈(TP)水平至关重要。 - 信号可视化:该指标在图表上直观地表示买卖信号,增强交易者的决策能力。 操作步骤 输入和设置: - 时间框架:此输入允许您设置指标计算的主要时间框架,默认值为15分钟。 - 时间框架2:此输入可用于定义额外分析的辅助时间框架,默认值为1分钟。 - 移动:此参数允许您将指标的计算向回移动,默认值为0。 - SLATR:此输入定义用于根据ATR计算止损水平的乘数,默认值为2.56。 - TPATR:此输入定义用于根据ATR计算止盈水平的乘数,默认值也为2.56。 - AlertsOn:启用或禁用交易信号的警报,
Fractal 358 Plus
Renato Fridschtein
Fractal 358 Plus is a predictive indicator that provides the clearest sight of price movements. Identifying graphic patterns such as Caixote (Crate), Pivot and Inside Candle , it shows entries and exits spots, as well as threats to your trades in the markets. It comes ready to use with B3 Mini Index (WIN$ series) and can be adjusted to use with any asset and timeframe. Fractal 358 unravels price movement Based on the Fibonacci sequence, Fractal 358 is a new and different way of reading and und
WanaScalper
Isaac Wanasolo
1 (1)
A scalping indicator based on mathematical patterns, which on average gives signals with relatively small SL, and also occasionally helps to catch big moves in the markets (more information in the video) This indicator has three main types of notifications: The first type warns of a possible/upcoming signal on the next bar The second type indicates the presence of a ready signal to enter the market/open a position The third type is for SL and TP levels - you will be notified every time price re
该指标建立当前报价,可以与历史报价进行比较,并在此基础上进行价格走势预测。指示器有一个文本字段,用于快速导航到所需日期。 选项: 符号 - 选择指标将显示的符号; SymbolPeriod - 选择指标从中获取数据的时段; IndicatorColor - 指示器颜色; HorisontalShift - 由指标绘制的报价移动指定的柱数; Inverse - true 反转引号,false - 原始视图; ChartVerticalShiftStep - 图表垂直移动(键盘上的向上/向下箭头); 接下来是文本字段的设置,您可以在其中输入日期,您可以通过按“回车”立即跳转到该日期。 接下来是文本字段的设置,您可以在其中输入日期,您可以通过按“回车”立即跳转到该日期。
Bullet indicator x
Dorah Zandile Mahesu
The bullet indicator gives accurate direction of the market structure, it will indicate to you the exact direction whether it be the market is in a downtrend or if it's in an uptrend it will give you that information which will inturn benefits you by saving you the time it takes to analyse that structure, this indicator works on a timeframes and it's most favourable on higher timeframes. How it works: -The green arrow will be at the support of the structure indicating buys -The red arrow will b
Introduction to X3 Chart Pattern Scanner X3 Cherart Pattern Scanner is the non-repainting and non-lagging indicator detecting X3 chart patterns including Harmonic pattern, Elliott Wave pattern, X3 patterns, and Japanese Candlestick patterns. Historical patterns match with signal patterns. Hence, you can readily develop the solid trading strategy in your chart. More importantly, this superb pattern scanner can detect the optimal pattern of its kind. In addition, you can switch on and off individu
To download MT4 version please click here . - This is the exact conversion from TradingView: "Trend Direction Force Index - TDFI [wm]" By "causecelebre". - The screenshot shows similar results from tradingview and Metatrader when tested on ICMarkets on both platforms. - This indicator uses multiple levels of averaging to detect trend strength. - You can optimize filter low and filter high levels to achieve best results. - You have access to buffers to use in EAs. - This is a light-load processin
Your Trend Friend
Luigi Nunes Labigalini
5 (1)
The trend is your friend! Look at the color of the indicator and trade on that direction. It does not  repaint. After each candle is closed, that's the color of the trend. You can focus on shorter faster trends or major trends, just test what's most suitable for the symbol and timeframe you trade. Simply change the "Length" parameter and the indicator will automatically adapt. You can also change the color, thickness and style of the lines. Download and give it a try! There are big movements w
PipFinite Exit EDGE MT5
Karlo Wilson Vendiola
4.86 (29)
Did You Have A Profitable Trade But Suddenly Reversed? In a solid strategy, exiting a trade is equally important as entering. Exit EDGE helps maximize your current trade profit and avoid turning winning trades to losers. Never Miss An Exit Signal Again Monitor all pairs and timeframes in just 1 chart www.mql5.com/en/blogs/post/726558 How To Trade You can close your open trades as soon as you receive a signal Close your Buy orders if you receive an Exit Buy Signal. Close your Sell orders if
Introducing   Order Blocks Breaker , a brand-new way to identify and leverage order blocks in your trading strategy. After developing multiple order block tools with unique concepts, I’m proud to present this tool that takes things to the next level. Unlike previous tools,   Order Blocks Breaker   not only identifies order blocks but also highlights   Breaker Order Blocks —key areas where the price is likely to retest after a breakout. MT4 -  https://www.mql5.com/en/market/product/124101/ This t
该产品的买家也购买
Golden Trend Indicator MT5
Noha Mohamed Fathy Younes Badr
4.86 (14)
Golden Trend indicator  is The best indicator for predicting trend movement this indicator never lags and never repaints and never back paints    and give  arrow buy and sell    before the candle appear  and it will help you and  will make your trading decisions clearer its work on all currencies and  gold and crypto and all time frame This unique  indicator uses very secret algorithms to catch the  trends, so you can trade using this indicator and see the trend clear on charts  manual guide and
FX Volume MT5
Daniel Stein
4.82 (17)
FX Volume:从经纪商视角洞察真实市场情绪 简要概述 想要提升您的交易策略? FX Volume 可提供零售交易者和经纪商的持仓实时数据——远早于诸如 COT 之类的延迟报告。不论您希望获得持续稳定的收益,还是想在市场中多一分制胜的砝码, FX Volume 都能帮您识别重大失衡、确认突破以及完善风险管理。立即开启体验,让真实的成交量数据为您的交易决策带来革新! 1. 为什么 FX Volume 对交易者格外有用 极具准确度的早期预警 • 快速捕捉有多少交易者正在买入或卖出某个货币对——比大多数人提前一步。 • FX Volume 是 唯一 能够整合多家零售经纪商真实成交量数据并以简洁方式呈现的工具。 强力风险管理 • 及时识别多头或空头仓位的巨大不平衡,这往往预示着潜在的趋势反转,帮助您更自信地设置止损和目标位。 • 独家而真实的数据让每一次交易决策更具可靠性。 优化进场与出场点 • 发现“过度集中”的交易(大多数交易者都在同一方向),并通过真实成交量来确认突破。 • 避免依赖常见指标可能带来的误导信号,而是利用真实的实时成交量。 适配各种交易策略 • 将 FX
Quantum TrendPulse
Bogdan Ion Puscasu
5 (13)
介绍 Quantum TrendPulse   ,这是一款终极交易工具,它将 SuperTrend   、   RSI 和 Stochastic 的强大功能整合到一个综合指标中,以最大限度地发挥您的交易潜力。该指标专为追求精准和效率的交易者而设计,可帮助您自信地识别市场趋势、动量变化以及最佳进入和退出点。 主要特点: 超级趋势整合: 轻松跟随当前的市场趋势并乘上盈利浪潮。 RSI 精度: 检测超买和超卖水平,非常适合把握市场逆转时机,可用作 SuperTrend 的过滤器 随机精度: 利用随机振荡在波动的市场中寻找隐藏的机会, 用作超级趋势的过滤器 多时间范围分析: 从 M5 到 H1 或 H4,在不同时间范围内关注市场动态。 可定制的警报: 当您的自定义交易条件得到满足时收到通知,这样您就不会错过任何交易。 无论您是新手还是经验丰富的交易员,   Quantum TrendPulse 都能为您提供所需的优势,帮助您增强策略并自信地进行交易。借助这一强大的指标,将洞察力转化为利润 — 掌控您的交易! ***购买 Quantum TrendPulse,即可免费获得 Quantum Tr
TPSpro RFI Levels MT5
Roman Podpora
4.53 (19)
指示       俄罗斯 -        英语   建议 与指示器一起使用     -       TPSpro 趋势专业版 -   MT4版本       交易中的一个关键要素是做出买卖交易工具决定的区域或水平。尽管主要参与者试图隐藏他们在市场中的存在,但他们不可避免地会留下痕迹。我们的任务是学习如何识别这些痕迹并正确解释它们。 主要功能: 向卖家和买家显示活跃区域! 该指标显示所有正确的初始买入和卖出脉冲水平/区域。激活这些水平/区域后,开始寻找切入点,水平会改变颜色并填充特定阴影。此外,还会显示箭头,以便更直观地了解情况。 显示更高时间范围内的级别/区域(MTF 模式) 添加了使用更高时间间隔显示级别/区域的功能。此外,该指标还具有自动趋势检测功能(   TPSproTREND PRO   )。 用于交易的单独专业的逐步算法。 该算法专为日内交易而设计,既可顺势交易,也可逆势交易。每个活动模板均提供详细说明。 适用于多种时间范围 。 TPSpro RFI 水平指标可用于图表上的任何时间范围,从一分钟(M1)开始一直到每月(MN)。 图形和声音警报。 该指标提供图形和声音指示,
RelicusRoad Pro MT5
Relicus LLC
4.78 (18)
现在$ 147(更新后增加到$ 499) - 无限帐户(PC或Mac) RelicusRoad 用户手册 + 培训视频 + 访问 Private Discord Group + VIP 身份 一种看待市场的新方式 RelicusRoad 是世界上最强大的外汇、期货、加密货币、股票和指数交易指标,为交易者提供保持盈利所需的所有信息和工具。我们提供技术分析和交易计划,帮助每一位交易者取得成功,从初学者到高级。它是一个关键的交易指标,可以提供足够的信息来预测未来的市场。我们相信一个完整的解决方案,而不是图表上几个没有意义的不同指标。这是一个多合一指标,显示无与伦比且非常准确的信号、箭头 + 价格行为信息。 RelicusRoad 基于强大的人工智能,提供缺失的信息和工具来教育您并使您成为交易专家,成为成功的交易者。 几乎所有技术指标都滞后,这意味着它们只能报告已经发生的事情。因此,他们只确认您过去可以看到的价格已经在哪里。我们相信领先指标可以预测未来价格,而无需重新绘制,也不要过度依赖可能改变并导致重新绘制的滞后指标。如果您根据滞后指标进行交易并建立头寸,您就知道您已经大部分时间
Bill Williams Advanced
Siarhei Vashchylka
5 (9)
Bill Williams Advanced is designed for automatic chart analysis using Bill Williams' "Profitunity" system. The indicator analyzes four timeframes at once. Manual (Be sure to read before purchasing) Advantages 1. Automatically analyzes the chart using the "Profitunity" system of Bill Williams. The found signals are placed in a table in the corner of the screen. 2. Equipped with a trend filter based on the Alligator indicator. Most of the system signals are recommended to be used only according t
Basic Harmonic Patterns Dashboard MT5
Mehran Sepah Mansoor
4.57 (7)
该仪表盘显示所选符号的最新可用谐波形态,因此您可以节省时间并提高效率 /  MT4 版本 。 免费指标:  Basic Harmonic Pattern 指标列 Symbol:   显示所选符号 Trend:     看涨或看跌 Pattern:    形态类型(Gartley、蝴蝶、蝙蝠、螃蟹、鲨鱼、Cypher 或 ABCD) Entry:     入口价格 SL: 止损价 TP1: 第一止盈价 TP2: 第二次获利价格 TP3: 第三次获利价格 Current price:    当前价格 Age (in bars):   最后绘制的模式的年龄 主要输入 Symbols :   从 "28 种主要货币对 "或 "选定符号 "中选择。 Selected Symbols :   希望监控的符号,用逗号分隔("EURUSD,GBPUSD,XAUUSD")。如果您的经纪商为货币对设置了后缀或前缀,您必须在以下两个参数中添加(货币对前缀或货币对后缀)。 Max Iteration:   调整模式的最大迭代次数(如果该值越小,则模式越少,性能越快;如果该值越大,则模式越多,性能越慢)
Entry Points Pro for MT5
Yury Orlov
4.46 (129)
这款指标用于 MT5,可提供准确的入场交易信号,且无重绘。 它可应用在任何金融资产:外汇、加密货币、贵金属、股票、指数。 它将提供极其精准的评估,并告诉您何时开仓和平仓的最佳时机。 观看 视频 (6:22),其中包含一个仅处理单一信号的示例,该信号即可值回指标购价! 大多数交易者在 Entry Points Pro 指标的帮助下,在第一个交易周内即改善了他们的交易结果。 订阅我们的 Telegram 群 ! Entry Points Pro 指标的益处。 入场信号无重绘 如果信号出现,并得到确认,则它不会再消失;不像是重绘指标,它会导致重大的财产损失,因为它们可以在显示信号后再将其删除。 无差错开仓 指标算法可令您找到入场交易(买入或卖出资产)的理想时机,从而提高每位交易者的成功率。 Entry Points Pro 可操作任何资产 它允许您在 MT5 平台上交易任何经纪商的加密货币、股票、贵金属、指数、大宗商品和货币。 提供任何方向的信号 Entry Points Pro 指标提供针对任意价格走势的入场交易信号 - 上涨、下跌或横盘(横向)。 最大盈利潜力 离场信号
介绍     Quantum Breakout PRO   ,突破性的 MQL5 指标,正在改变您交易突破区域的方式!由拥有超过13年交易经验的资深交易员团队开发,     量子突破 PRO     旨在通过其创新和动态的突破区域策略将您的交易之旅推向新的高度。 量子突破指标将为您提供带有 5 个利润目标区域的突破区域的信号箭头,以及基于突破框的止损建议。 它既适合新手交易者,也适合专业交易者。 量子 EA 通道:       点击这里 重要的!购买后请私信我领取安装手册。 建议: 时间范围:M15 货币对:GBPJPY、EURJPY、USDJPY、NZDUSD、XAUUSD 账户类型:ECN、Raw 或 Razor,点差极低 经纪商时间:GMT +3 经纪商:IC Markets、Pepperstone with Raw 和 Razor 的点差最低 规格: 不重漆! 最多 5 个建议利润目标区域 建议止损水平 可定制的盒子。您可以设置自己的 Box Time Start 和 Box Time End。 接触 如果您有任何疑问或需要帮助,请通过私人消息与我联系。
Royal Scalping Indicator M5
Vahidreza Heidar Gholami
5 (6)
Royal Scalping Indicator is an advanced price adaptive indicator designed to generate high-quality trading signals. Built-in multi-timeframe and multi-currency capabilities make it even more powerful to have configurations based on different symbols and timeframes. This indicator is perfect for scalp trades as well as swing trades. Royal Scalping is not just an indicator, but a trading strategy itself. Features Price Adaptive Trend Detector Algorithm Multi-Timeframe and Multi-Currency Trend Low
可以说,这是您可以为MetaTrader平台找到的最完整的谐波价格形成自动识别指标。它检测19种不同的模式,像您一样认真对待斐波那契投影,显示潜在的反转区域(PRZ),并找到合适的止损和获利水平。 [ 安装指南 | 更新指南 | 故障排除 | 常见问题 | 所有产品 ] 它检测19种不同的谐波价格形态 它绘制了主要,衍生和互补的斐波那契投影(PRZ) 它评估过去的价格走势并显示每个过去的形态 该指标分析其自身的质量和性能 它显示合适的止损和获利水平 它使用突破来表明合适的交易 它在图表上绘制所有样式比率 它实现了电子邮件/声音/视觉警报 受斯科特·M·卡尼(Scott M. Carney)的书的启发,该指标旨在满足最纯粹和最熟练的交易者的需求。但是,它采取了一种使交易更容易的方式:在向交易发出信号之前,它会等待Donchian朝正确方向突破,从而使交易信号非常可靠。 斐波那契投影与向量无关 它实现了电子邮件/声音/推送警报 它绘制了ABCD投影 重要提示: 为了符合 Scott M. Carney先生 的商标申诉,某些图案名称已重命名为不言自明的替代方式, Scott M.
Basic Supply Demand Dashboard MT5
Mehran Sepah Mansoor
5 (1)
该仪表盘可根据您对所选符号的交易策略,以剥头皮和长期模式在图表上发现并显示供需区。此外,仪表盘的扫描模式可帮助您一目了然地检查所有需要的符号,不错过任何合适的仓位/ MT4 版本 免费指标: Basic Supply Demand 功能 允许您查看多个货币对的交易机会,为您提供所有货币对的清晰简明视图,并根据其与供需区的接近程度进行排序 可定制设置,从颜色到检测参数,满足您的特定需求 主要输入 Indicator mode : 选择指标模式或具有新功能的面板模式 Symbols : 从 "28 种主要货币对 "或 "选定符号 "中进行选择 Selected Symbols : 您希望监控的符号,用逗号分隔("EURUSD,GBPUSD,XAUUSD")。如果您的经纪商对货币对有后缀或前缀,您必须在以下两个参数中添加(货币对前缀或货币对后缀) Trading Style : 选择剥头皮或长期模式 Allowed Deviation : 该参数允许修改需求或供应区域的精确度(数值越小,精确度越高) Zone   thickness : 通过该参数可以修改需求和供应区域的厚度。
CONTACT US  after purchase to get the Indicator Manual. Try Now—Limited 50% Discount for First 10 Buyers! Download the  Metatrader 4 Version Due to regulatory restrictions, our service is unavailable in certain countries such as India, Pakistan, and Bangladesh. William Delbert Gann (W.D. Gann) was an exceptional market analyst, whose trading technique was based on a complex blend of mathematics, geometry, astrology, and ancient mathematics which proved to be extremely accurate. A Note from t
Gold Trend 5
Sergei Linskii
5 (1)
黄金趋势 - 这是一个很好的股票技术指标。该指标算法分析资产的价格走势,并反映波动性和潜在进入区。 最佳指标信号: - 卖出 = 红色柱状图 + 红色短指针 + 同方向黄色信号箭头。 - 买入 = 蓝色柱状图 + 蓝色多头指针 + 同方向水蓝色信号箭头。 该指标的优点 1. 该指标生成的信号准确度高。 2. 只有当趋势发生变化时,才能重新绘制已确认的箭头信号。 3. 您可以在任何经纪商的 MetaTrader 5 交易平台上进行交易。 4. 您可以交易任何资产(货币、金属、加密货币、股票、指数等)。 5. 最好在 H1 时间框架(中期交易)上进行交易。 6. 在指标设置中可更改个别参数(TF、颜色等),以便每位交易者都能轻松定制适合自己的指标。 7. 该指标既可作为交易系统的主要补充,也可作为独立的交易系统使用。   注意:交易的入市准确性和盈利能力仅取决于交易者的技能。任何指标都只是交易者的助手,而非行动指南。 MetaTrader 4 黄金趋势指标版本  祝大家交易好运,稳定盈利!
PZ Mean Reversion MT5
PZ TRADING SLU
3 (2)
采用专业和量化方法进行均值回归交易的独特指标。它利用了价格以可预测和可衡量的方式转移并返回均值这一事实,这允许明确的进入和退出规则大大优于非量化交易策略。 [ Installation Guide | Update Guide | Troubleshooting | FAQ | All Products ] 清晰的交易信号 非常容易交易 可定制的颜色和尺寸 实现性能统计 优于大多数交易策略 显示合适的止损和止盈水平 它实现了电子邮件/声音/视觉警报 这个怎么运作 该指标从更高的时间范围测量完全可定制的移动平均线的标准偏差,并使用趋势跟踪方法精确地找到交易。交易是通过深入当前图表的价格行为发现的,并在价格返回到平均价格区间时关闭,根据您选择的更高时间范围计算。由于其编码方式,该指标将远离高波动性和强劲趋势市场,并且仅在可预测的情况下进行交易,在可接受的波动性与方向性比率范围内,回归均值是可行的。 指标剖析 绿线是更高时间范围内的移动平均线(也就是平均值) 虚线区域是移动平均线周围的典型价格区间 蓝线是看涨交易的突破价格 红线是看跌交易的突破价格 交易是针对均值进行的,并在典型的价格
ADR Scalping Indicator MT5
Robert Mathias Bernt Larsson
5 (2)
这很容易成为最容易被忽视的指标,它可以为您提供对价格行为的最大洞察力。这是我自己使用的唯一指标。 该指标可让您深入了解今天的价格走势,以及最有可能朝哪个方向移动。 ADR 代表平均每日范围。如果您在盘中交易或剥头皮,您必须知道价格将移动多少的范围。 假设价格已经移动了当天正常水平的一半,并且处于价格行动的底部,价格更有可能继续下跌,而不是再次一路上涨以达到平均每日范围。价格总是寻求在平均每日范围内移动。 您还将获得动态支撑和阻力。当价格移动到平均范围时,您可以向中间交易。 该指标还将让您知道价格是否可能从趋势线反弹。因此,如果您喜欢使用趋势线进行交易,这就是您的指标! 你会得到 3 种类型的范围。 1. 黑色区间 - 基于当前价格的当前区间,但如果价格波动超过平均水平,则会吸引顶部或底部。当价格移动超过 ADR 的 50% 时,该范围最终将与其他两个范围之一保持一致。 2. 绿色区间 - 如果我们从今天的低点计算,价格平均会移动多远? 3. 红色范围 - 如果我们从今天的高点计算,价格平均会移动多远?
首先,值得强调的是,这个交易系统是一个非重绘、非重画和非滞后的指标,这使得它非常适合手动和机器人交易。 在线课程,手册和下载预设。 “智能趋势交易系统 MT5”是专为新手和经验丰富的交易者量身定制的综合交易解决方案。它结合了超过 10 个优质指标,具有 7 多个强大的交易策略,使其成为适用于各种市场条件的多功能选择。 趋势跟随策略:提供精确的入场和止损管理,以有效地跟随趋势。 反转策略:识别潜在的趋势反转,使交易者能够利用区域市场的机会。 剃头策略:专为快速准确的日内交易和短期交易而设计。 稳定性:所有指标都不会重绘、不会重画和不会滞后,确保可靠的信号。 定制:支持自定义策略,以满足个人交易偏好。超过 7 种策略和组合可帮助您找到最佳策略。 信号清晰度:提供箭头信号,以指示清晰的入场和退出点。 实时警报:通过交易进出警报使交易者保持了解。 深入分析:提供更高时间框架的趋势分析和实时交易监控。 自适应颜色编码:利用蜡烛颜色编码来显示成交量、趋势和反转蜡烛信号。通过蜡烛颜色分析市场方向。 “智能趋势交易系统 MT5”赋予交易者必要的工具,以便在各种市场条件下做出明智和战略性的交易决策。无论
Elliot Waves Analyzer Pro
Viktor Weidenthal
2.67 (3)
Elliot Waves Analyzer Pro calculates Elliot Waves to Help Identify Trend direction and Entry Levels. Mainly for Swing Trading Strategies. Usually one would open a Position in trend direction for Wave 3 or a Correction for Wave C . This Indicator draws Target Levels for the current and next wave. Most important Rules for Elliot Wave Analysis are verified by the Indicator.  The Pro version analyzes Multiple Timeframes and shows the Subwaves and Target-Levels.   For an Overview  " Elliot Waves Anal
Blahtech Supply Demand MT5
Blahtech Limited
4.54 (13)
Was: $299  Now: $149  Supply Demand uses previous price action to identify potential imbalances between buyers and sellers. The key is to identify the better odds zones, not just the untouched ones. Blahtech Supply Demand indicator delivers functionality previously unavailable on any trading platform. This 4-in-1 indicator not only highlights the higher probability zones using a multi-criteria strength engine, but also combines it with multi-timeframe trend analysis, previously confirmed swings
Blahtech Market Profile MT5
Blahtech Limited
5 (10)
Was: $249  Now: $149   Market Profile defines a number of day types that can help the trader to determine market behaviour. A key feature is the Value Area, representing the range of price action where 70% of trading took place. Understanding the Value Area can give traders valuable insight into market direction and establish the higher odds trade. It is an excellent addition to any system you may be using. Inspired by Jim Dalton’s book “Mind Over Markets”, this indicator is designed to suit the
Volume Horizon is a horizontal volume indicator that allows you to observe the density of market participants' volumes across various price and time intervals. Volume histograms can be constructed based on ascending or descending market waves, as well as individual bars. This tool enables more precise determination of entry or exit points, relying on levels of maximum volumes or volume-weighted average prices (VWAP). What makes Volume Horizon unique? 1. Segmentation into ascending and descendi
Identify key turning points with reliable fractal analysis Special Offer: Purchase now to receive free bonuses worth $30! (Read more for details) This indicator examines the price structure of fractals of different periods to determine possible reversal points in the market, providing timing to positional traders that already have a fundamental or technical valuation model. Unlike its younger brother, Reversal Fractals , this indicator won't miss reversals because of the period selected, and w
EMA Scalper Indicator
Yosi Malatta Madsu
EMA Scalper Indicator is an indicator of EMA lines and reversal EMA lines. Each pair of EMA channels area that can be used to make reversal entry. After the EMA lines are widening because of major trend, the area can be used to find profitable entry and exit, especially after EMA reversal. Do the cut loss whenever candle closed outside the area. The A, B, C, D, and E area are colored differently. Solid lines: Normal EMA lines. Dashed lines: Reversal EMA lines.
Quantum Currency Matrix Indicator for MT5
QUANTUM TRADING SOFTWARE LIMITED
5 (1)
Of all the four principle capital markets, the world of foreign exchange trading is the most complex and most difficult to master, unless of course you have the right tools! The reason for this complexity is not hard to understand. First currencies are traded in pairs. Each position is a judgment of the forces driving two independent markets. If the GBP/USD for example is bullish, is this being driven by strength in the pound, or weakness in the US dollar. Imagine if we had to do the same thing
Quantum Trend Sniper
Bogdan Ion Puscasu
4.73 (51)
介绍   量子趋势狙击指标 ,突破性的 MQL5 指标,正在改变您识别和交易趋势反转的方式!由拥有超过13年交易经验的资深交易员团队开发,     量子趋势狙击指标   旨在通过其创新的方式以极高的准确度识别趋势反转,将您的交易之旅推向新的高度。 ***购买量子趋势狙击指标,即可免费获得量子突破指标!*** 当量子突破指标识别出趋势反转时,它会向您发出警报和信号箭头,并建议您三个止盈水平。 它既适合新手交易者,也适合专业交易者。 量子 EA 通道:       点击这里 MT4版本:       点击这里 建议: 时间范围: 所有时间范围。为了获得最佳结果,我们建议在 M15、M30 和 H1 时间范围内使用它。 货币对:欧元兑美元、英镑兑美元、澳元兑美元、欧元兑英镑、, EURAUD,  XAUUSD 账户类型:ECN、Raw 或 Razor,点差极低 经纪时间:任意 经纪商:IC Markets、Pepperstone with Raw 和 Razor 的点差最低 建议止损:50 点 建议止盈水平:20 点、50 点和 100 点 规格: 不重漆! 最
Kecia Footprint Orderflow
Niccolo Filippo Palombi
IF YOU WANT TO TEST IT : private message me ( MT5 demo testing doesn't work ) * UPDATE * VOLUME PROFILE ADDED Designed to help traders gain a deeper understanding of the market’s true order flow dynamics . By visualizing the “ footprints ” left by candles, this indicator reveals how the delta ( the difference between buying and selling pressure ) changes during the candle formation, as well as how volume fluctuates at different price levels. These insights are essential for traders seeking to id
TPA True Price Action indicator reveals the true price action of the market makers through 100% non-repainting signals strictly at the close of a candle! TPA shows entries and re-entries, every time the bulls are definitely stronger than the bears and vice versa. Not to confuse with red/green candles. The shift of power gets confirmed at the earliest stage and is ONE exit strategy of several. There are available now two free parts of the TPA User Guide for our customers. The first "The Basics"
AT Forex Indicator MT5
Marzena Maria Szmit
5 (5)
The AT Forex Indicator MT5 is a sophisticated trading tool designed to provide traders with a comprehensive analysis of multiple currency pairs. This powerful indicator simplifies the complex nature of the forex market, making it accessible for both novice and experienced traders. AT Forex Indicator uses advanced algorithms to detect trends, patterns and is an essential tool for traders aiming to enhance their forex trading performance. With its robust features, ease of use, and reliable signal
True Oversold Overbought MT5
Innovicient Limited
5 (1)
The True Oversold Overbought indicator provides you with ability to swiftly check whether the asset is oversold or overbought.  Other than complementing your trading with True Oversold Overbought, you can use the indicator as your only trading system. It works with all forex instruments and will save you the headache of estimating when the market is due for a reversal or retracement.  When the "Super Charge" feature is enabled, the areas where the price is in oversold/overbought status are ampli
作者的更多信息
SourcePoint是一个很好的中长线交易指示器,他能独立使用,也可以去其他趋势型指标独立使用,可以很明确的给出趋势走向,很好的指出最佳的buy和sell位置,指标不含有未来函数,不会重新绘制,不仅能够应用到自己的手动交易过程中,还能完全可以写入到自己的EA中,如果你需要 MT5版本 可以去( https://www.mql5.com/zh/market/product/101744?source=Site +Market+My+Products+Page#description) 。 (如果你感觉到这个指标能够帮助你进行更准确的交易,请帮忙给个好评,希望我的作品能够帮助更多有需要的人) ===================参数列表===================== fastP: 96 slowP:208 avgP:72 =================参考使用方法=================== 此指标可以适用于任何交易品种,能够用在任何周期。 个人建议:短线交易选择M5,中长线交易选择M15 每次形成一个交点,就是一个交易机会,同时也是一个持仓平仓点位。建议配合
BS Trend Line For MT4是一款很好的买卖指示器,不含有未来函数,不会重绘,新版本已经加入了更好的过滤算法,开单成功率有了很大的提高,是一个很好的波段交易提示器,尤其是配合 SourcePoint For MT4 会有更明显的效果,它能帮你过滤掉接近70%以上的无效交易信号。 ===================参数列表===================== timeframe:M5 gip:30 sip:6 up line:80 down line:20 ===================使用方法===================== 配合 SourcePoint For MT4 使用时, SourcePoint For MT4 的参数 fastP: 96 slowP:208 avgP:72
BestPointOfInitiation是一个很好的短线交易指示器,能与 ShortBS ( https://www.mql5.com/zh/market/product/96796 )完美的配合,可以很好的指出最佳的buy和sell位置,指标不含有未来函数,不会重新绘制,不仅能够应用到自己的手动交易过程中,还能完全可以写入到自己的EA中。(如果你感觉到这个指标能够帮助你进行更准确的交易,请帮忙给个好评,希望我的作品能够帮助更多多有需要的人) ===================参数列表===================== fastPeriod: 9 slowPeriod:30 PassivationCoefficient:5 =================参考使用方法=================== 此指标可以适用于任何交易品种,能够用在任何周期。
TradingDirection是一个针对中长线交易的趋势指标。在图上你能很清晰的看到什么时候是上涨趋势,什么时候是下跌趋势,同时在趋势中,你能看到很明显的补仓位置和减仓位置。同时它与 BestPointOfInitiation( https://www.mql5.com/zh/market/product/96671 )指标可以形成完美的配合,两个指标相互配合更能很好的把握开单时机。 ===================参数列表===================== fastPeriod: 9 slowPeriod:30 PassivationCoefficient:5 =================参考使用方法=================== 此指标可以适用于任何交易品种,能够用在任何周期。
ShortBS
Yan Qi Zhu
ShortBS是一个很好的短线交易指示器,能很好与 BestPointOfInitiation ( https://www.mql5.com/zh/market/product/96671 )配合,能让你找到最合适的buy和sell位置,指标不含有未来函数,不会重新绘制。是一个针对(如果你感觉到这个指标能够帮助你进行更准确的交易,请帮忙给个好评,希望我的作品能够帮助更多有需要的人) ===================参数列表===================== maPeriod: 25 slowPeriod:20 fastPeriod:10 stepPeriod:5 =================参考使用方法=================== 此指标可以适用于任何交易品种,能够用在任何周期。
HighQualityMap是一个很好的中长线交易指示器,这个指标可以单独使用,尤其是用在M30或者大于M30的时间框架下,它能很好的体现出趋势的走向,以及转折点,你可以很快的从这个指示器上寻找到最佳的buy和sell位置,同时也能很好根据指示器去坚守自己的持仓定订单。指标不含有未来函数,不会重新绘制,不仅能够应用到自己的手动交易过程中,还能完全可以写入到自己的EA中。(如果你感觉到这个指标能够帮助你进行更准确的交易,请帮忙给个好评,希望我的作品能够帮助更多有需要的人) ===================参数列表===================== 所有参数均采用默认参数即可,无需更改,若为激进型交易者,可以根据自己的需要来调整参数。 =================参考使用方法=================== 此指标可以适用于任何交易品种,使用周期框架大于M30相对更准确。
SourcePoint是一个很好的中长线交易指示器,他能独立使用,也可以去其他趋势型指标独立使用,可以很好的指出最佳的buy和sell位置,指标不含有未来函数,不会重新绘制,不仅能够应用到自己的手动交易过程中,还能完全可以写入到自己的EA中。建议配合BS TrendLine( https://www.mql5.com/zh/market/product/96476?source=Site+Market+My+Products+Page ) 一起使用。 (如果你感觉到这个指标能够帮助你进行更准确的交易,请帮忙给个好评,希望我的作品能够帮助更多有需要的人) ===================参数列表===================== fastP: 12 slowP:26 avgP:9 =================参考使用方法=================== 此指标可以适用于任何交易品种,能够用在任何周期。 每次形成一个交点,就是一个交易机会,同时也是一个持仓平仓点位。建议配合大小周期一起使用,这样更容易让你找到更精准的入场位置和出场位置
StartPoint
Yan Qi Zhu
StartPoint是一个很好的短线交易指示器,这个指标可以单独使用,但是最好是配合 HighQualityMap 一起使用,适用于任何时间框架,喜欢超短线的朋友可以使用M5时间框架。它能很好的体现出短期趋势的启动点,你可以很快的从这个指示器上寻找到最佳的buy和sell位置,同时也能很好根据指示器去坚守自己的持仓定订单。指标不含有未来函数,不会重新绘制,不仅能够应用到自己的手动交易过程中,还能完全可以写入到自己的EA中。(如果你感觉到这个指标能够帮助你进行更准确的交易,请帮忙给个好评,希望我的作品能够帮助更多有需要的人) ===================参数列表===================== 所有参数均采用默认参数即可,无需更改,若为激进型交易者,可以根据自己的需要来调整参数。 =================参考使用方法=================== 此指标可以适用于任何交易品种。
BS Time Band是一个很好的波段交易指示器,这个指标可以单独使用,但是最好是配合 StartPoint 一起使用效果更好,适用于任何时间框架,非常适合喜欢做波段交易的朋友。它能很好的体现出一个波段的完整信息,你可以很快的从这个指示器上寻找到最佳的预警区域,然后配合 StartPoint 找到最佳的buy位置和最佳的sell位置,也能很好根据指示器去坚守自己的持仓定订单。指标不含有未来函数,不会重新绘制,不仅能够应用到自己的手动交易过程中,还能完全可以写入到自己的EA中。(如果你感觉到这个指标能够帮助你进行更准确的交易,请帮忙给个好评,希望我的作品能够帮助更多有需要的人) =================参考使用方法=================== 此指标可以适用于任何交易品种。 做波段建议参数 timeFame:M5 如果配合 StartPoint 建议 StartPoint 的参数为(240,60)
筛选:
无评论
回复评论
版本 1.60 2024.04.15
1、新版本加入了新的过滤算法,过滤掉了很多无效的交易信号,准确率得到了极大的提升
2、解决了Mac电脑上颜色显示异常的问题
版本 1.50 2024.04.15
修复了部分mac电脑上显示异常的问题
版本 1.40 2024.04.14
1、新版本加入了新的过滤算法,过滤掉了很多无效的交易信号,准确率得到了极大的提升
版本 1.3 2023.04.08
修复了个别电脑无法正常显示正确颜色的问题。
版本 1.2 2023.04.07
修复了断开行情再次连接时,数据一直为0的问题
版本 1.1 2023.04.07
在新版本中加入了TimeFrame选择,你可以在1分钟的时间框架下,查看任意自己想查看的时间框架的指标数据。