Heikin Ashi Dashboard MT5
- 指标
- Taras Slobodyanik
- 版本: 2.50
- 更新: 24 七月 2024
- 激活: 10
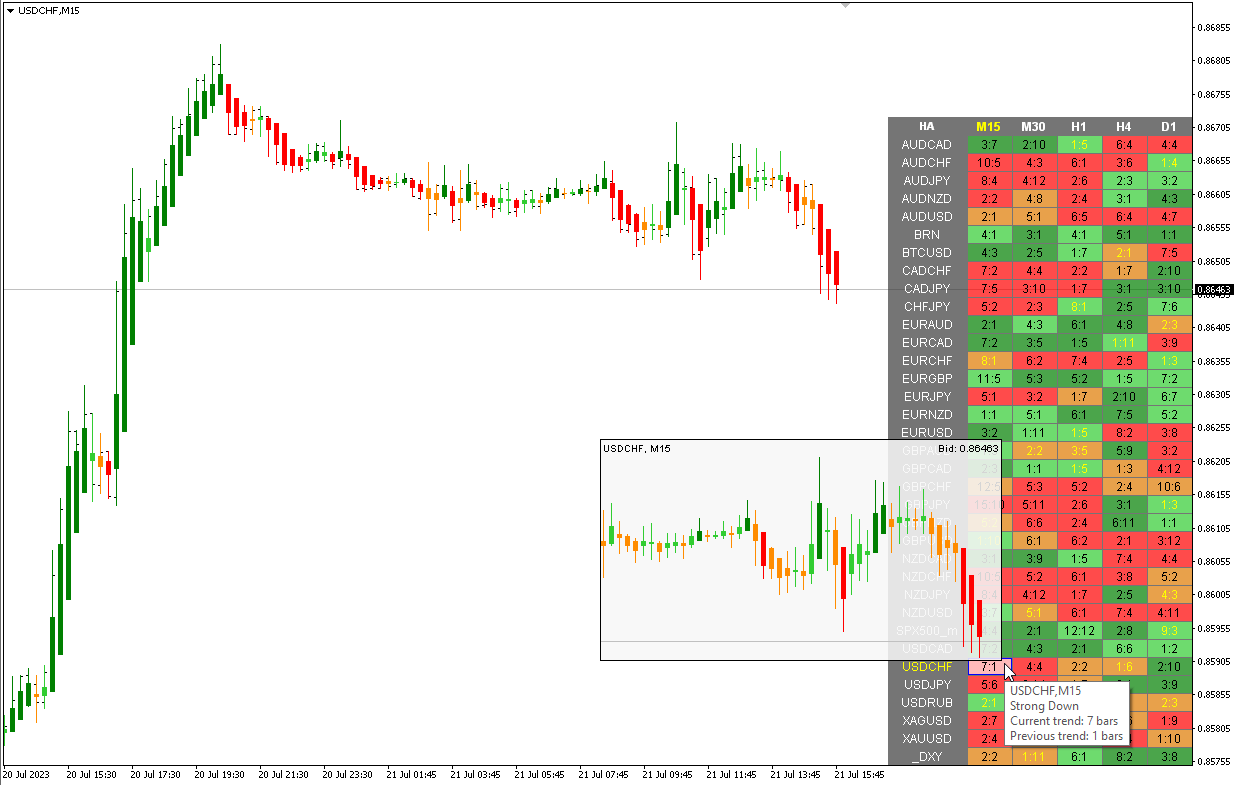
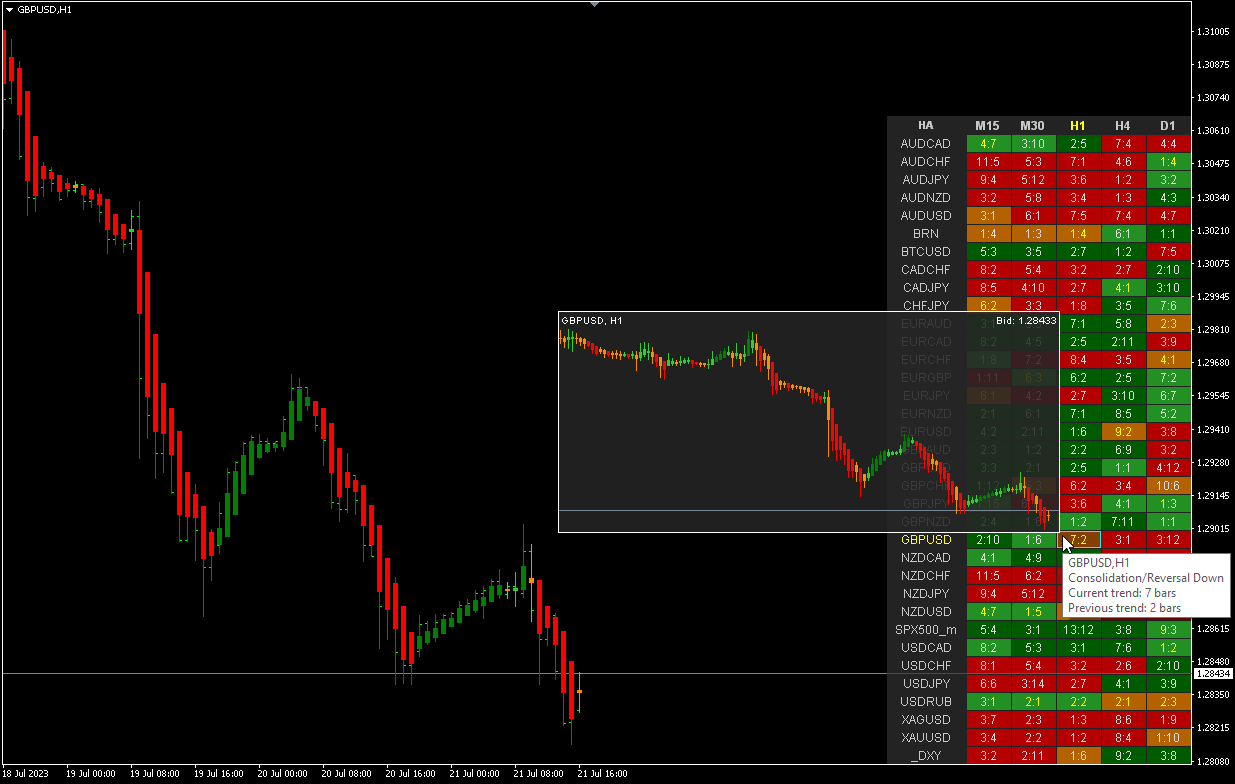
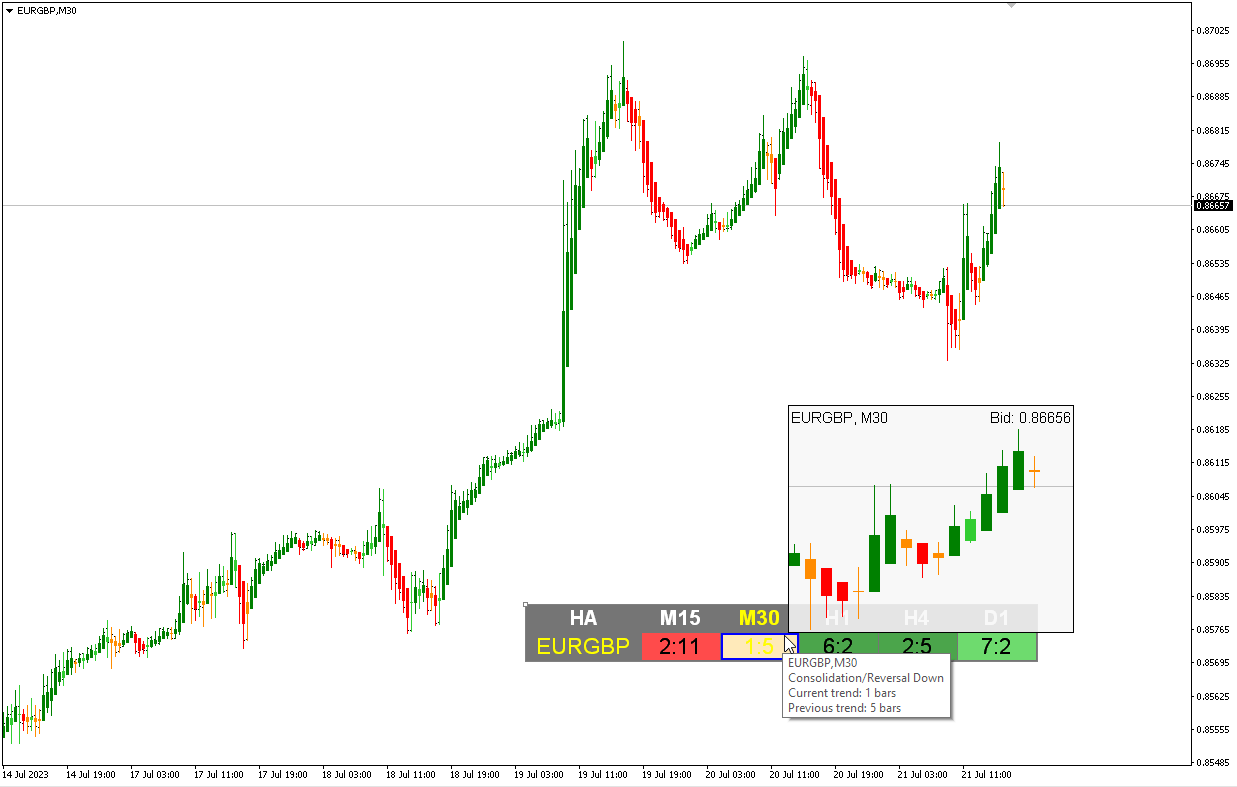
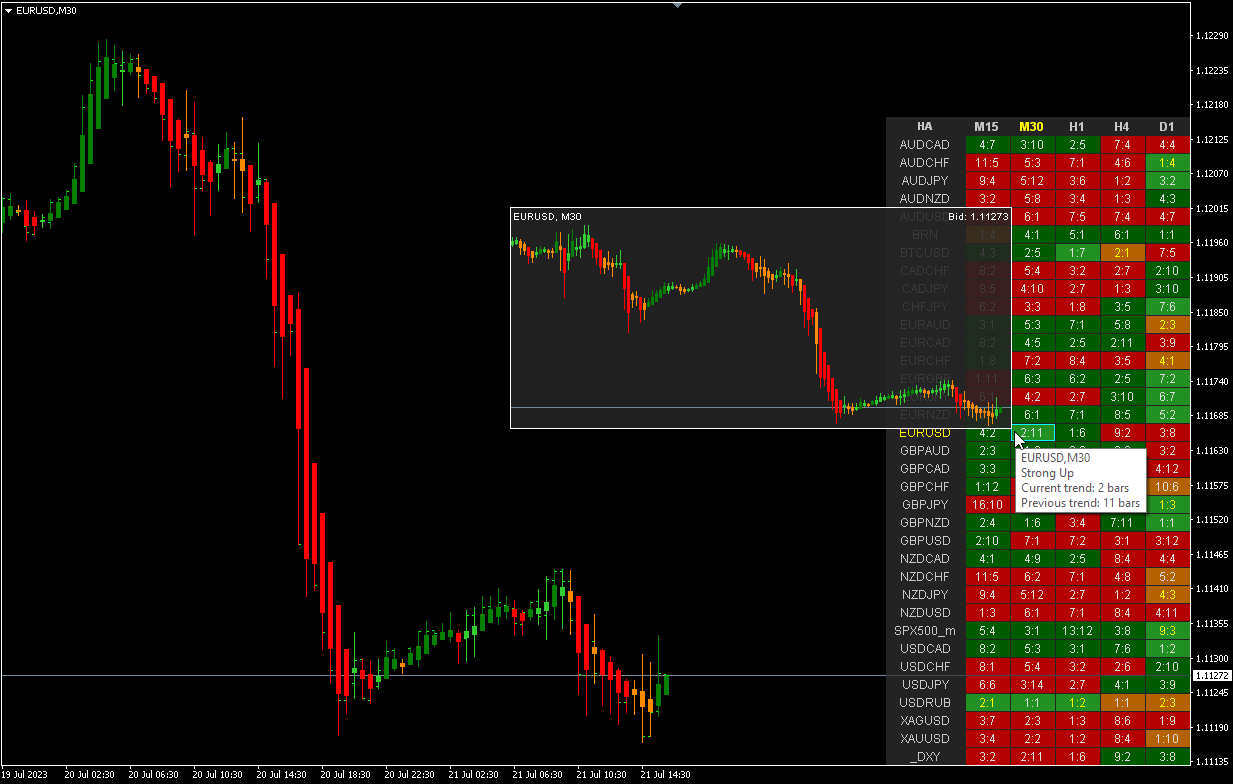
多货币和多时间框架 Heikin Ashi 指标。 显示了当前的市场状况。 在扫描仪面板上,您可以看到当前趋势的方向、强度和条形数量。 盘整/反转蜡烛也用颜色显示。 您可以在参数中指定任何所需的货币和期间。 此外,当趋势发生变化或出现反转和盘整蜡烛(十字星)时,指标可以发送通知。 通过单击单元格,将打开该符号和句点。 这是 MTF 扫描仪。
Heikin-Ashi 是日本的交易指标和金融图表,意思是“平均速度”。 Heikin-Ashi 图表类似于烛台图,但具有更平滑的外观,因为它们跟踪一系列价格变动,而不是像烛台那样跟踪每个价格变动。 Heikin-Ashi 由 Munehisa Homma 在 1700 年代创建,他还创建了烛台图。 交易者和投资者使用这些图表来帮助确定和预测价格变动。
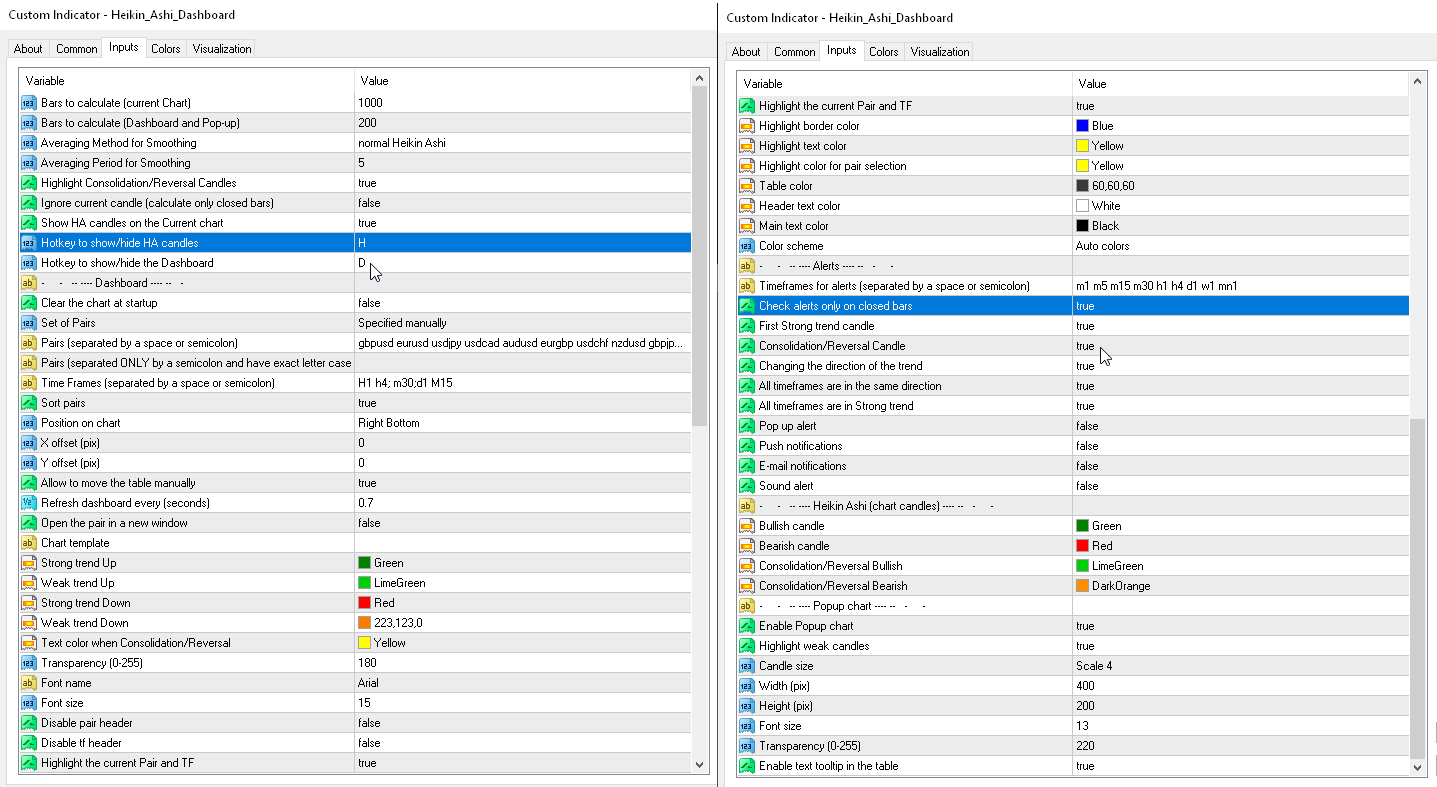
参数
- Averaging Method for Smoothing — 选择平滑蜡烛价格的方法。
— Simple MA — 简单 MA
— Exponential MA — 指数 MA
— Smoothed MA — 平滑 MA
— Linear weighted MA — 线性加权 MA
— normal Heikin Ashi — 正常 Heikin Ashi
- Averaging Period for Smoothing — 选择平滑周期。
- Ignore current candle (calculate only closed bars) — 禁用当前(未关闭的)蜡烛图的显示。
- Show HA candles on the current chart — Heiken Ashi 蜡烛将在当前图表上绘制。
- Show Consolidation/Reversal Candles (Doji) — 显示盘整/反转蜡烛(十字星)。
- Doji. Body length to the Candle length ratio, % (body<=%) — 参数将蜡烛主体的大小设置为相对于整个蜡烛大小的百分比。 身体应该<=这个百分比。
- Doji. Wick length to the Candle length ratio, % (each wick>=%) 参数将上下灯芯的尺寸设置为相对于整个蜡烛尺寸的百分比。 每个灯芯必须 >= 该百分比。
- Hotkey to show/hide HA candles — 显示/隐藏 HA 蜡烛的热键。
- Hotkey to show/hide the Dashboard — 显示/隐藏仪表板的热键。
仪表板
Clear the chart at startup — 启动时清除图表。
Set of Pairs — 符号集
— Market Watch — 来自“市场观察”的配对。— Specified manually — 在参数“Pairs”中手动指定对。— Current pair — 仅显示当前对。
Pairs (separated by a space or semicolon) — 由空格或分号分隔的符号列表。 货币名称的书写方式应与经纪商的名称完全相同,并保留大小写和前缀/后缀。
Time Frames (separated by a space or semicolon) — 由空格或分号分隔的时间范围列表(多个时间范围)。
Sort pairs — 对对列表进行排序。
Position on chart — 在图表上显示面板的角落。
X offset (pix) — 沿 X 轴移动面板;
Y offset (pix) — 沿 Y 轴移动面板;
Refresh dashboard every (seconds) — 所有货币对和时间范围的更新周期。
Open the pair in a new window — 通过单击在新图表窗口中打开交易品种。
Chart template — 图表模板的名称(如果图表在新窗口中打开)。
Strong trend Up — 代表强劲上升趋势的颜色。
Weak trend Up — 弱上升趋势的颜色。
Strong trend Down — 表示强劲下降趋势的颜色。
Weak trend Down — 弱下降趋势的颜色。
Text color when Consolidation/Reversal — 盘整/反转柱的突出显示颜色(以及图表上的蜡烛)。
Transparency (0-255) — 透明度(0-255)。
Font name — 字体名称。
Font size — 字体大小。
警报
Timeframes for alerts (separated by a space or semicolon) — 警报的时间范围(用空格或分号分隔)。
Check alerts only when the candle is closed — 仅当蜡烛关闭时才检查警报。
First Strong trend candle — 警惕第一个强趋势蜡烛。
Consolidation/Reversal Candle — 当盘整/反转蜡烛出现时发出警报。
Changing the direction of the trend — 趋势方向改变时发出警报。
All timeframes are in Strong trend — 这些警报根据仪表板中的最短时间范围每条发送一次。 他们不会查看“警报时间范围”参数。
All timeframes are in the same direction — 这些警报根据仪表板中的最短时间范围每条发送一次。 他们不会查看“警报时间范围”参数。
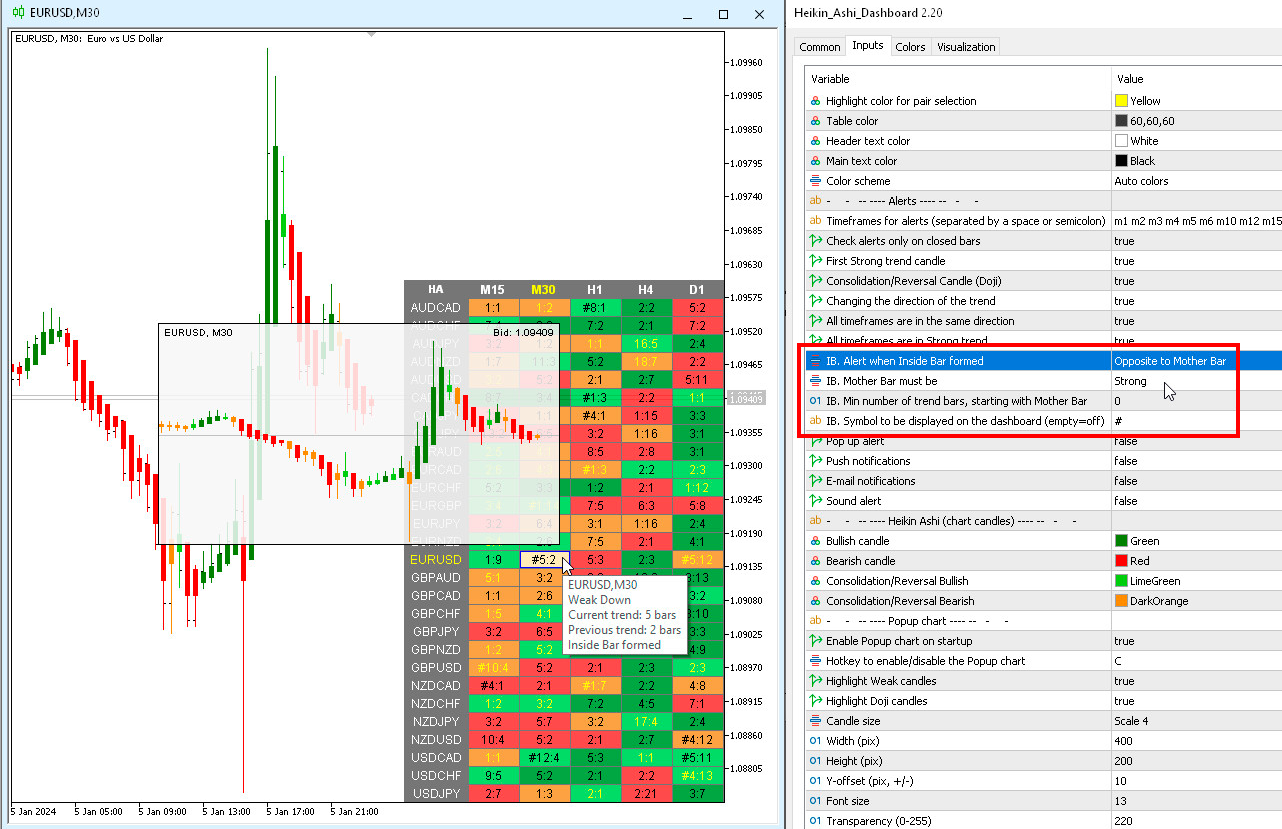
IB. Alert when Inside Bar formed — IB。 当内线形成时发出警报。
IB. Mother Bar must be — IB。 妈妈吧一定是。
IB. Min number of trend bars, starting with Mother Bar — IB。 趋势柱的最小数量,从母柱开始。
IB. Symbol to be displayed on the dashboard (empty=off) — IB。 显示在仪表板上的符号(空=关闭)。
Very, very useful. This is the indicator i was looking for. Also, i had a request and the developer improve it. Very happy with the product. Five stars!