SimSim Line KijunSen Plus MA MT5
- 指标
- Aleksandr Tyunev
- 版本: 2.0
- 更新: 3 八月 2024
- 激活: 7
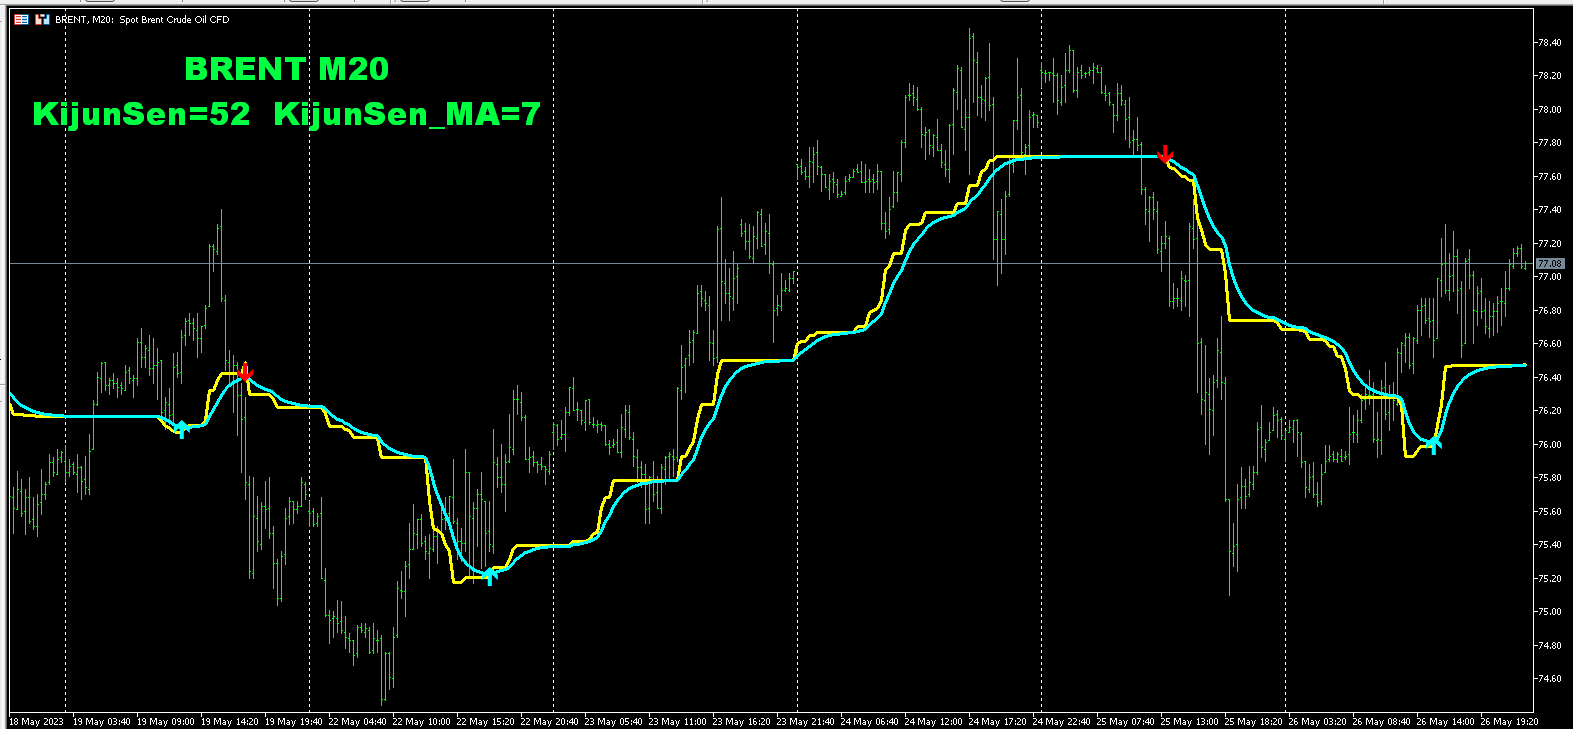
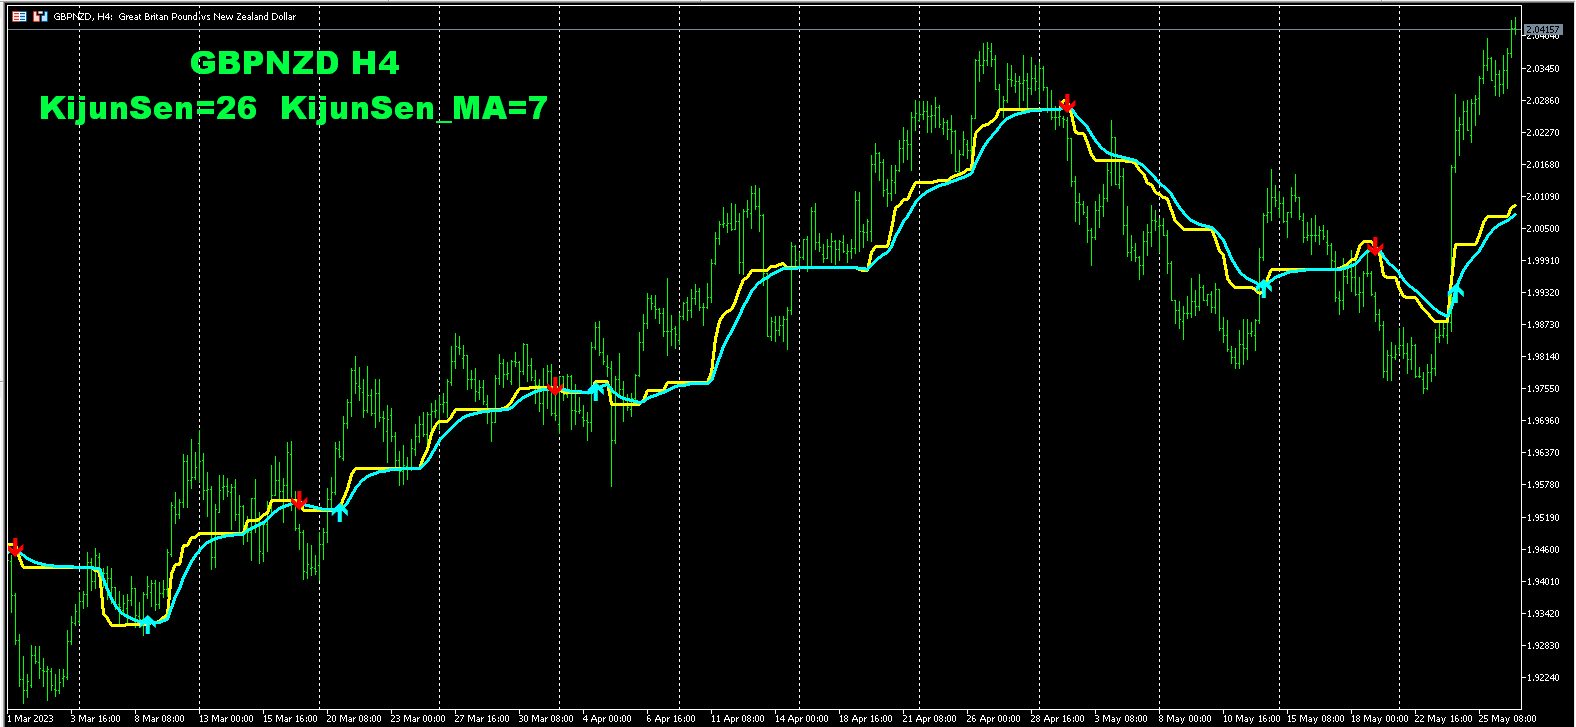
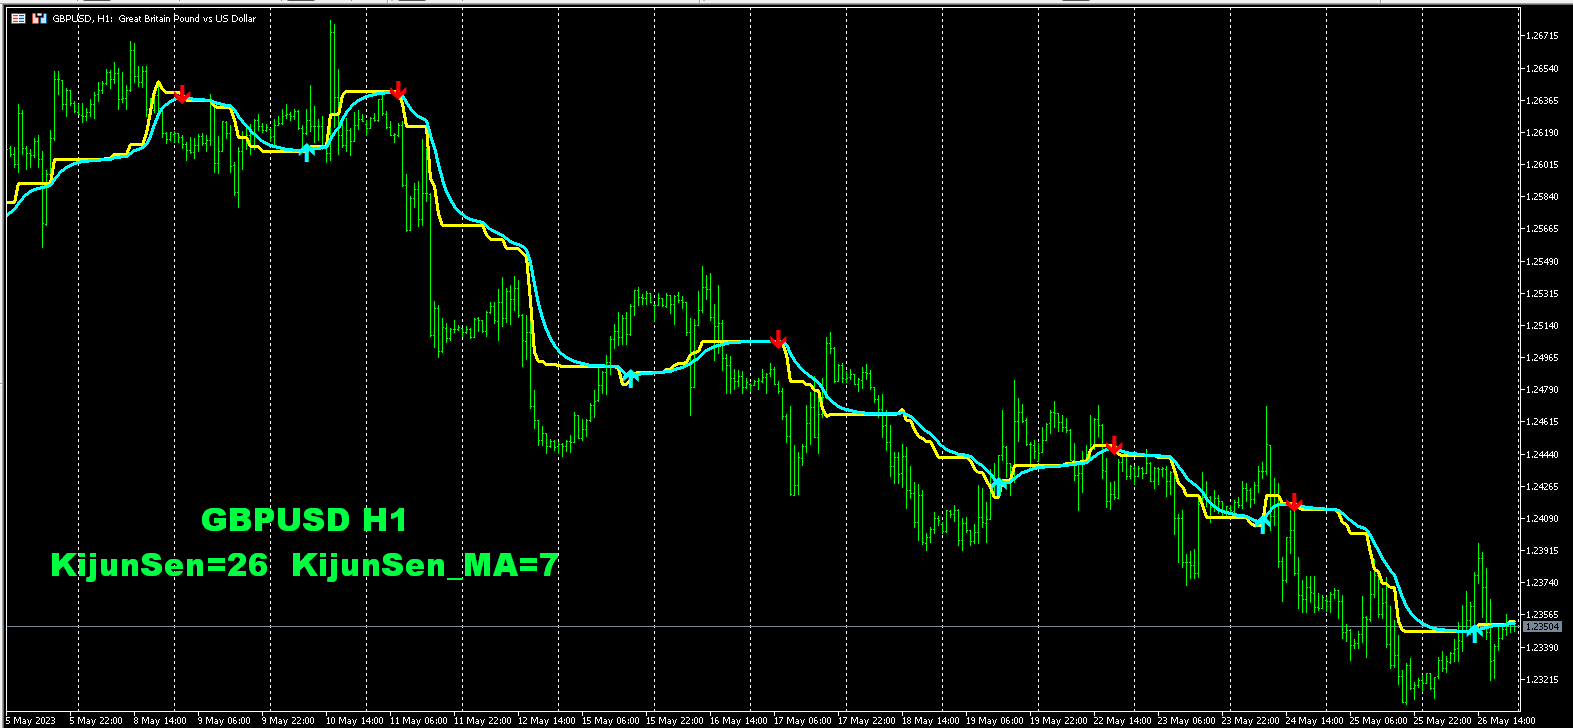
一個非常簡單但有效的指標。
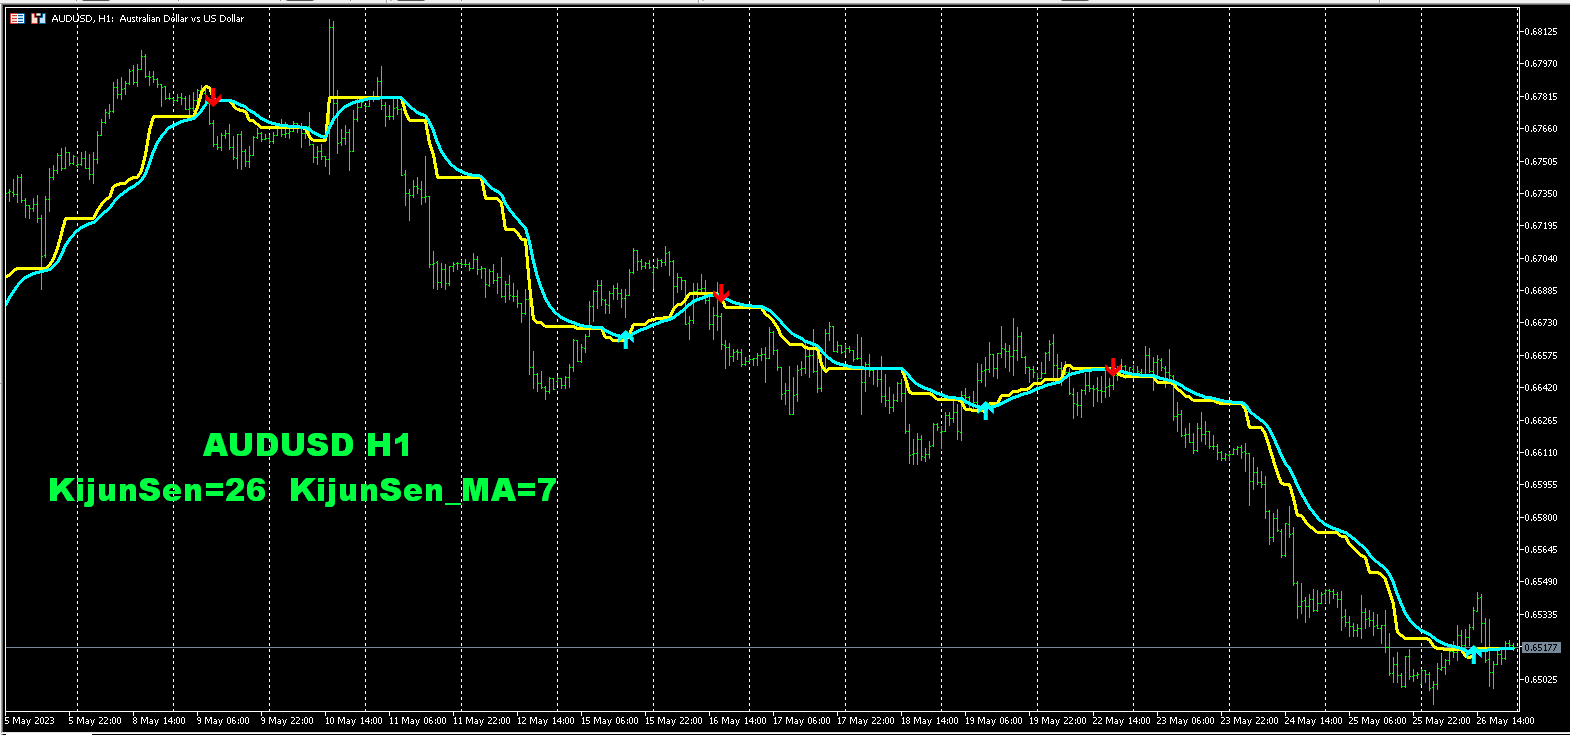
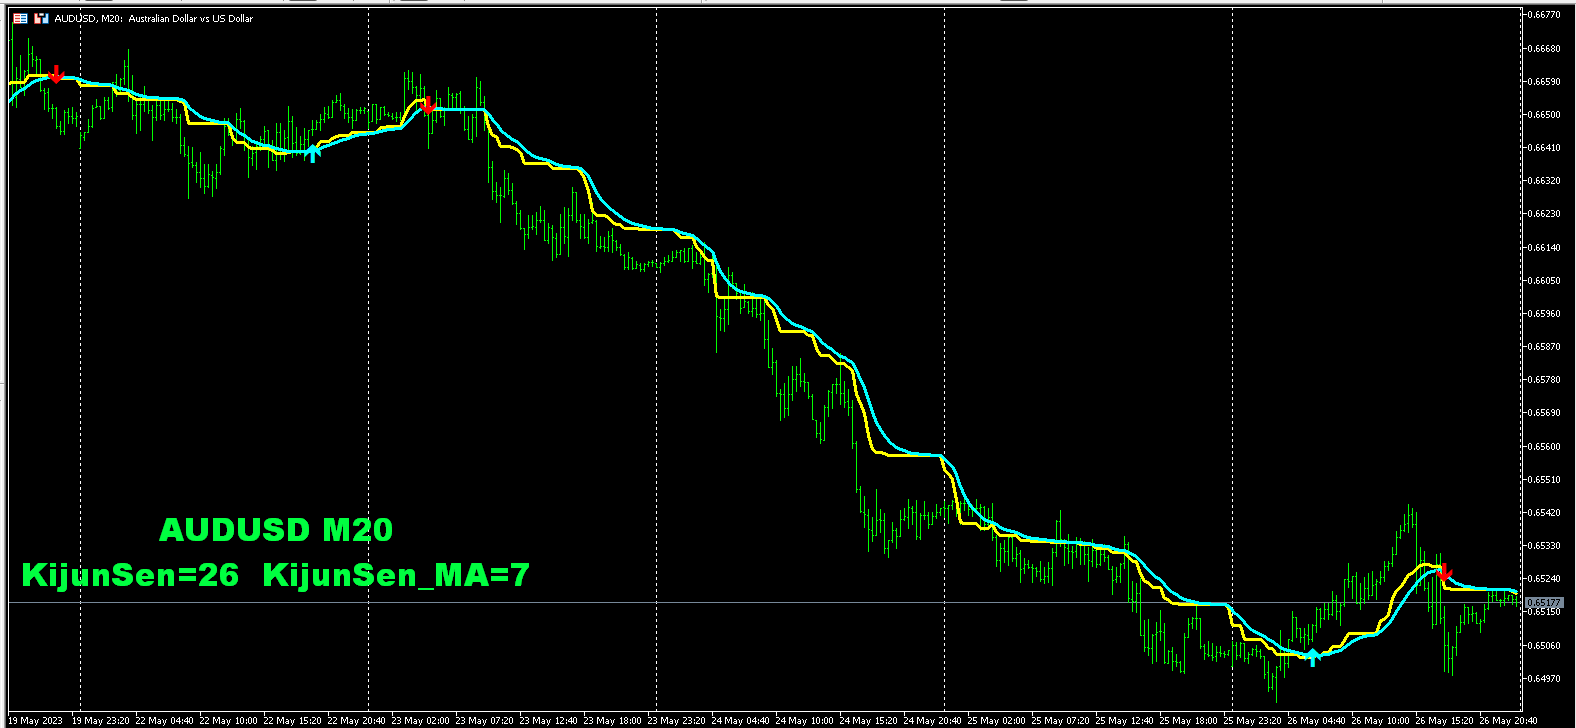
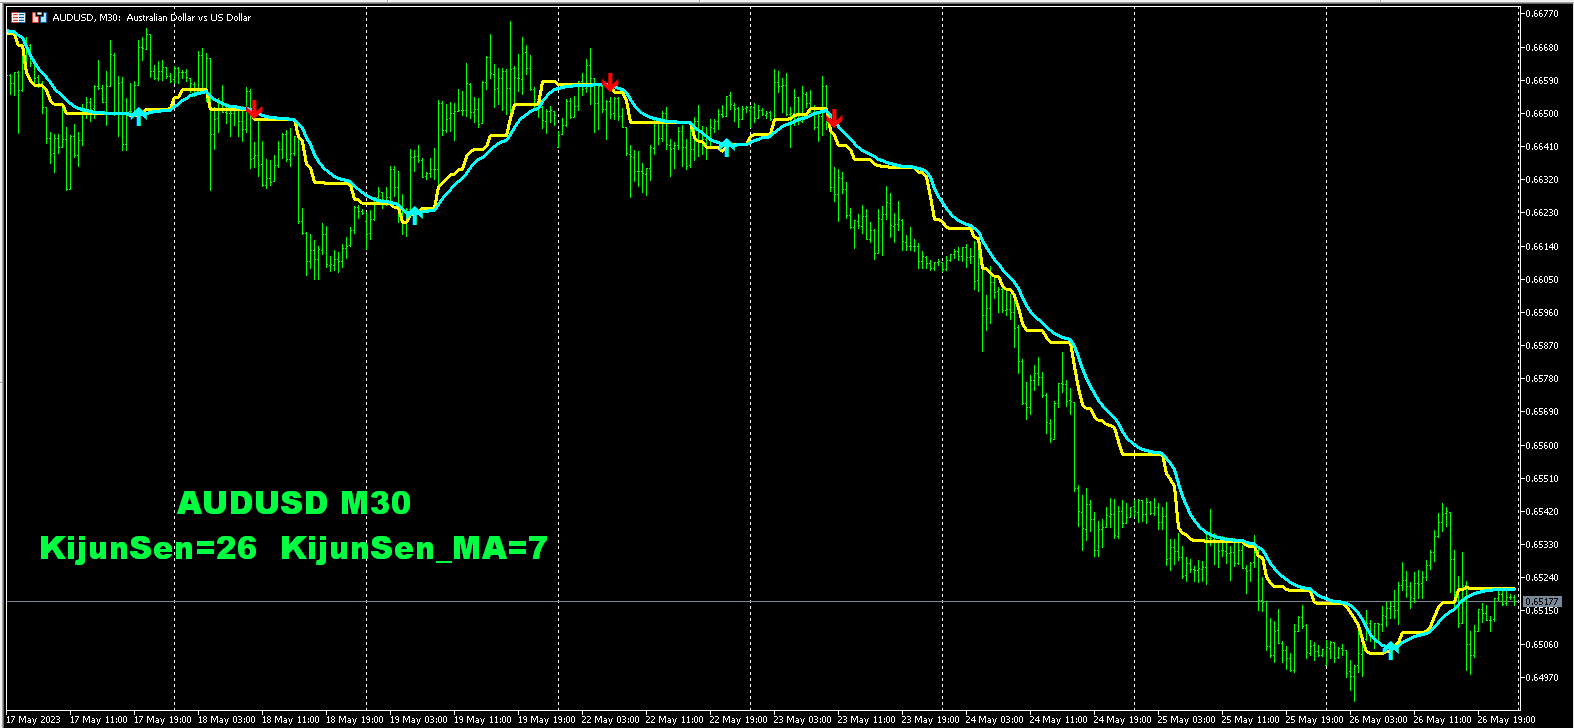
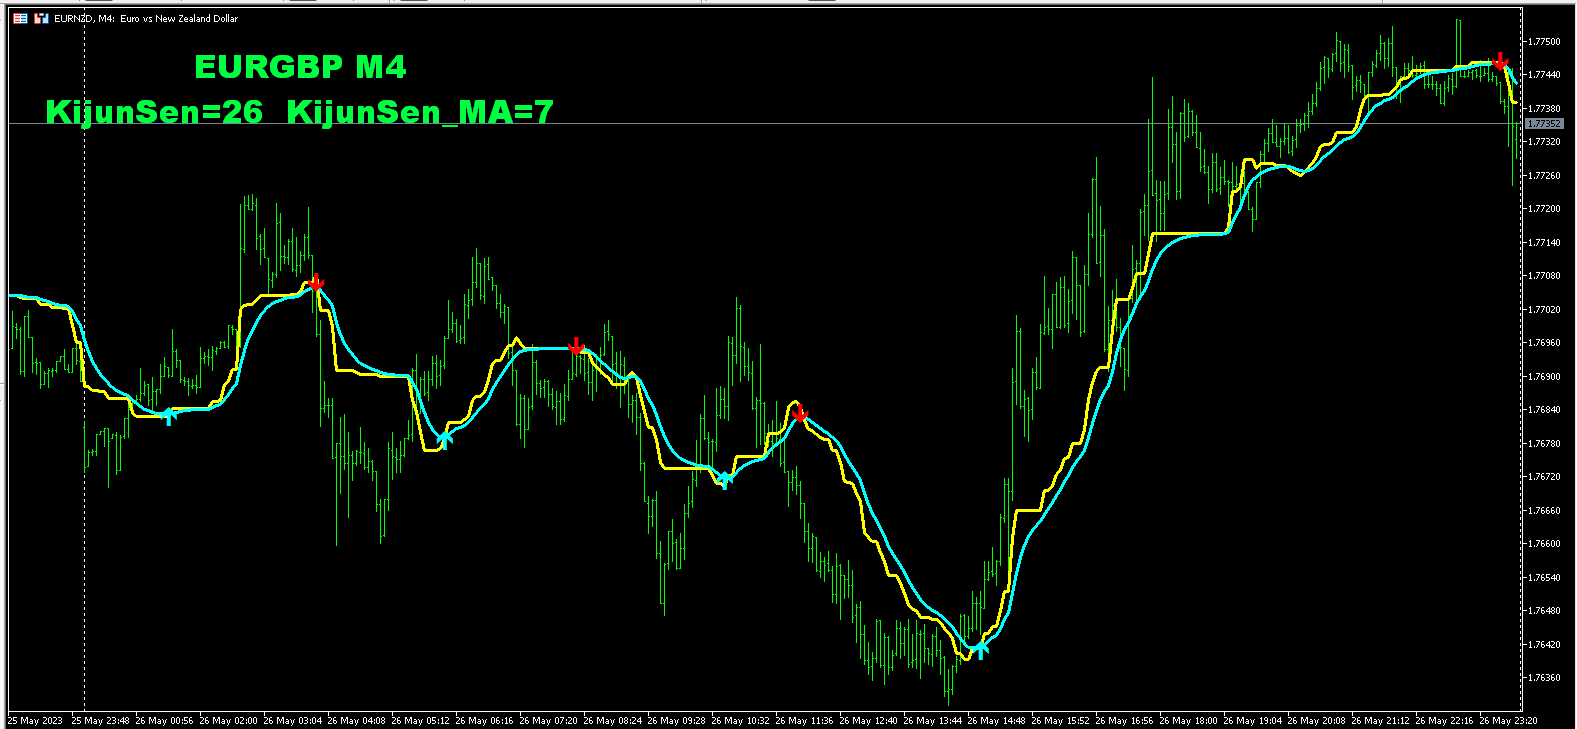
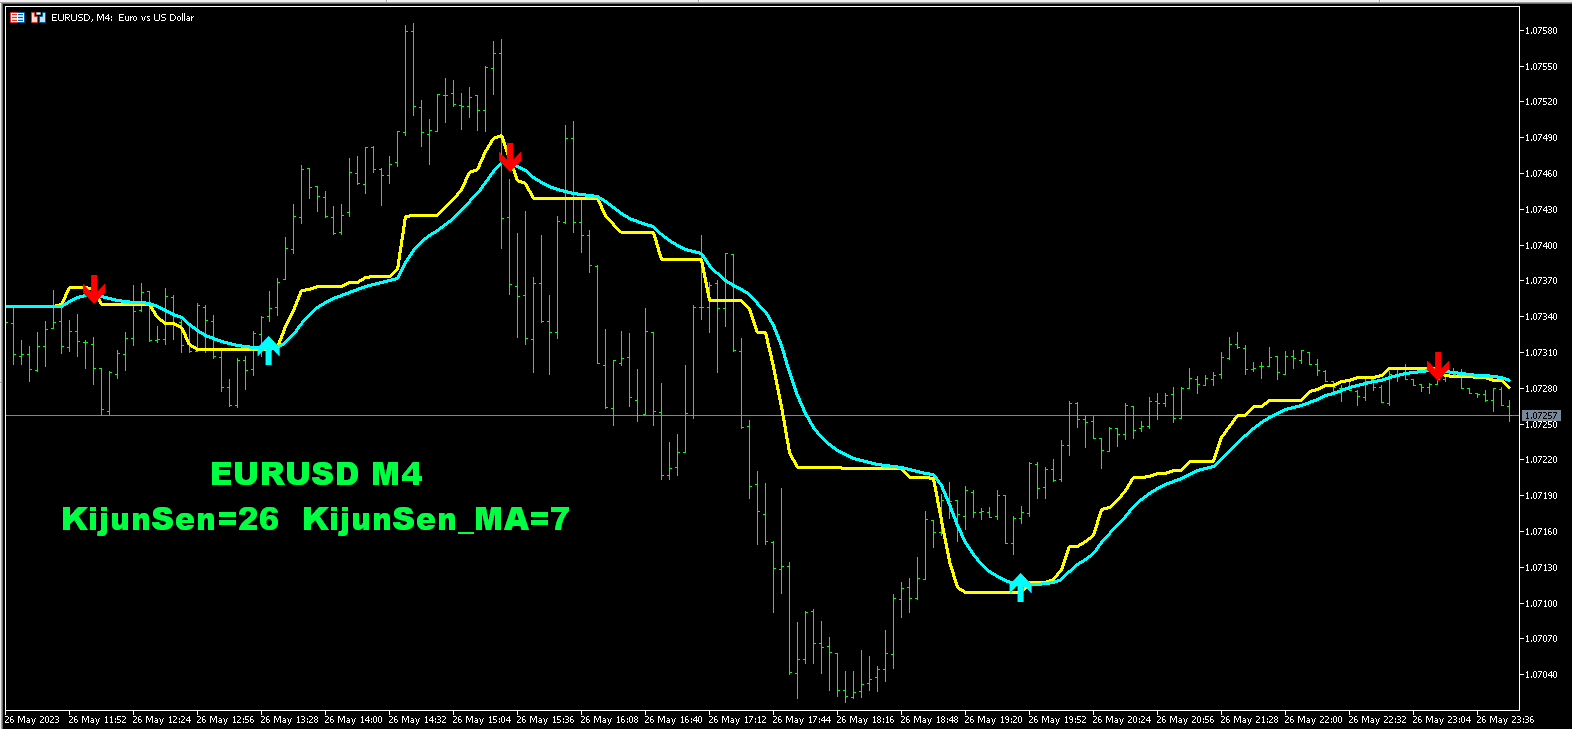
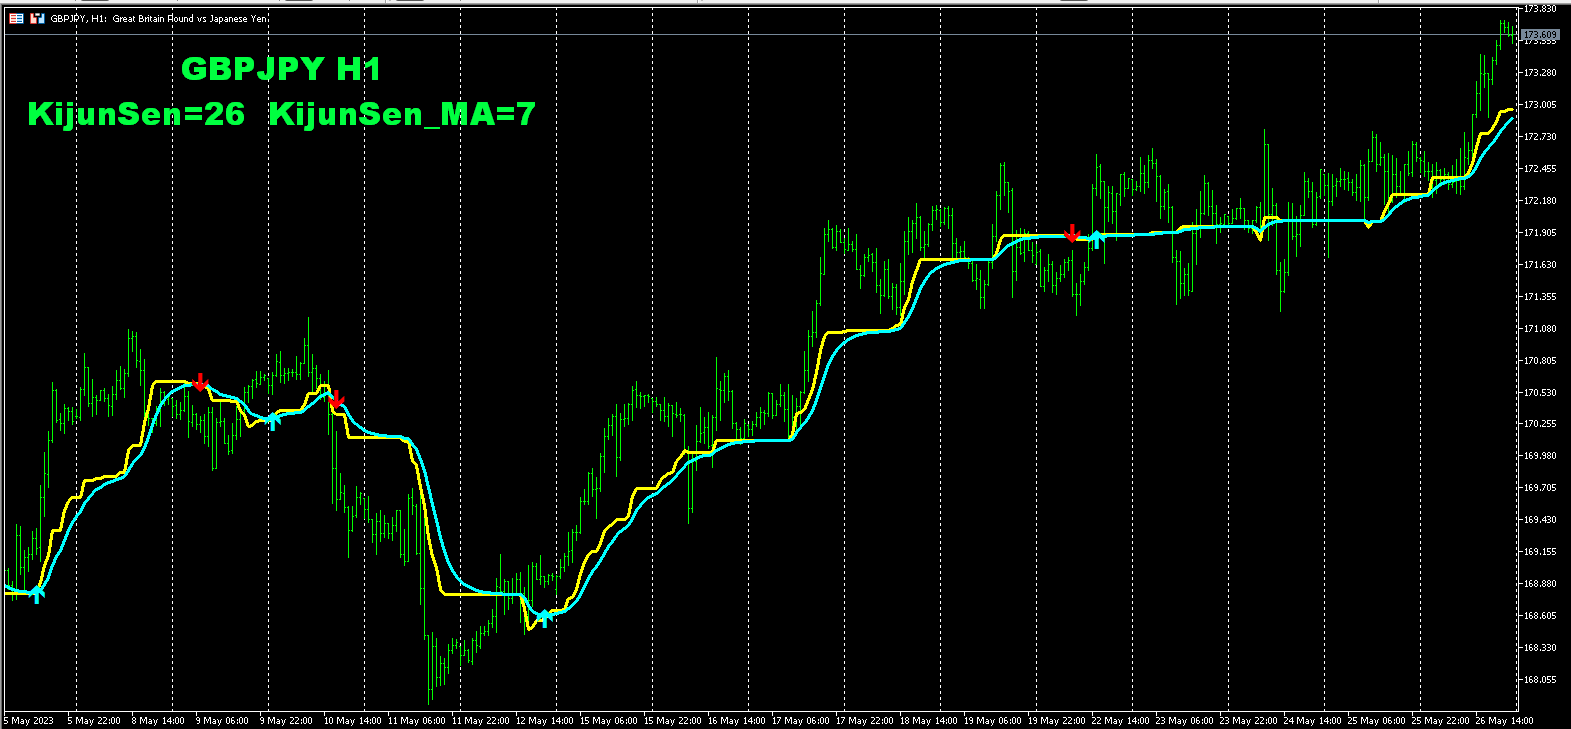
它基於 Ichimoku 指標的 KijunSen 線,並在此基礎上建立移動平均線 MA。當這兩條線交叉時,就會出現買進或賣出的訊號。我經常在交易中使用 KijunSen 指標線:當價格高於該線時,我只專注於買入,而當價格低於該線時,我專注於賣出。
此外,在平均 KijunSen 線並創建 KijunSen 移動平均線後,這些線的主要交點變得重要,提供更明亮、更可靠的交易訊號。這些交叉點不僅預示著機會,而且可以作為在市場上做出明智決策的催化劑,使交易者能夠清晰而自信地感知變化。如此一來,KijunSen不僅成為了一個工具,也成為了金融波動海洋中的指路明燈。
MT4 版本指標的連結:
https://www.mql5.com/ru/market/product/96120
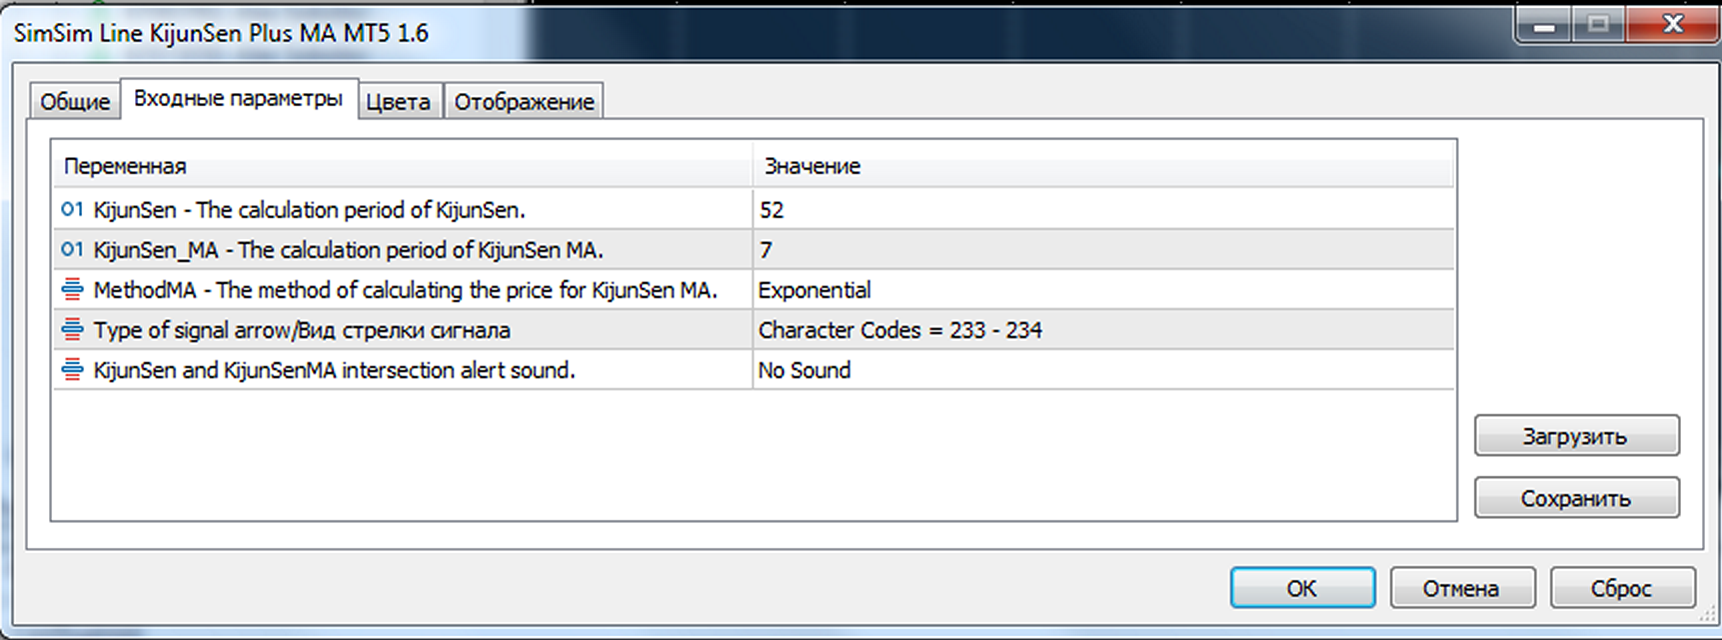
指標參數:
KijunSen - KijunSen 的計算週期。
KijunSen_MA - KijunSen MA 的計算週期。
MethodMA - KijunSen MA 價格的計算方法。
ArroyBuySell - 訊號箭頭類型
聲音 - 聲音通知。
用於與顧問溝通的指標緩衝區。
緩衝區編號 0 - KijunSen 指標線。 緩衝器編號0 是指標的 Kijun Sen 線。
緩衝區 1 - KijunSen 指標的 MA 線。緩衝器編號1 是指標的 Kijun Sen MA 線。
2 號緩衝區 - 緩衝區不為空 = 購買。 緩衝區不為空=買入。
3 號緩衝區 - 緩衝區不為空 = 出售。 緩衝區不為空=賣出。
它基於 Ichimoku 指標的 KijunSen 線,並在此基礎上建立移動平均線 MA。當這兩條線交叉時,就會出現買進或賣出的訊號。我經常在交易中使用 KijunSen 指標線:當價格高於該線時,我只專注於買入,而當價格低於該線時,我專注於賣出。
此外,在平均 KijunSen 線並創建 KijunSen 移動平均線後,這些線的主要交點變得重要,提供更明亮、更可靠的交易訊號。這些交叉點不僅預示著機會,而且可以作為在市場上做出明智決策的催化劑,使交易者能夠清晰而自信地感知變化。如此一來,KijunSen不僅成為了一個工具,也成為了金融波動海洋中的指路明燈。
MT4 版本指標的連結:
https://www.mql5.com/ru/market/product/96120
指標參數:
KijunSen - KijunSen 的計算週期。
KijunSen_MA - KijunSen MA 的計算週期。
MethodMA - KijunSen MA 價格的計算方法。
ArroyBuySell - 訊號箭頭類型
聲音 - 聲音通知。
用於與顧問溝通的指標緩衝區。
緩衝區編號 0 - KijunSen 指標線。 緩衝器編號0 是指標的 Kijun Sen 線。
緩衝區 1 - KijunSen 指標的 MA 線。緩衝器編號1 是指標的 Kijun Sen MA 線。
2 號緩衝區 - 緩衝區不為空 = 購買。 緩衝區不為空=買入。
3 號緩衝區 - 緩衝區不為空 = 出售。 緩衝區不為空=賣出。

Good indicator and simple idea.