• 概述
  • 评论
  • 评论
  • 新特性

ICT Breakers MT5

MT4 Version Order Blocks ICT Kill Zones SMT Divergences

ICT Breakers

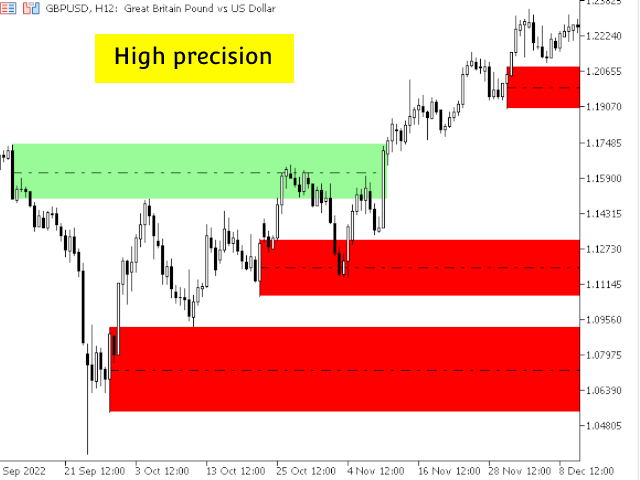
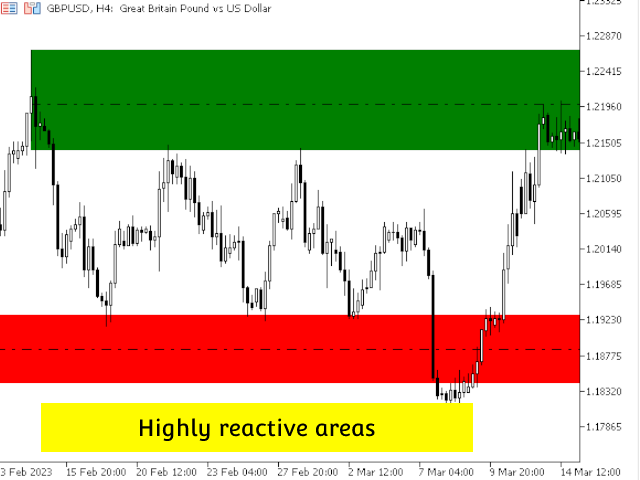
The ICT Breakers indicator is a powerful tool for traders looking to gain an edge in the market. This indicator is based on the order flow and volume analysis, which allows traders to see the buying and selling pressure behind the price action. This information can be extremely valuable in identifying key levels of support and resistance, as well as potential turning points in the market.

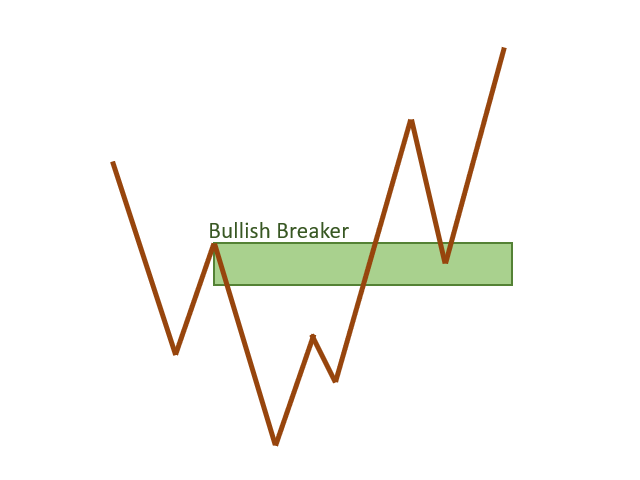
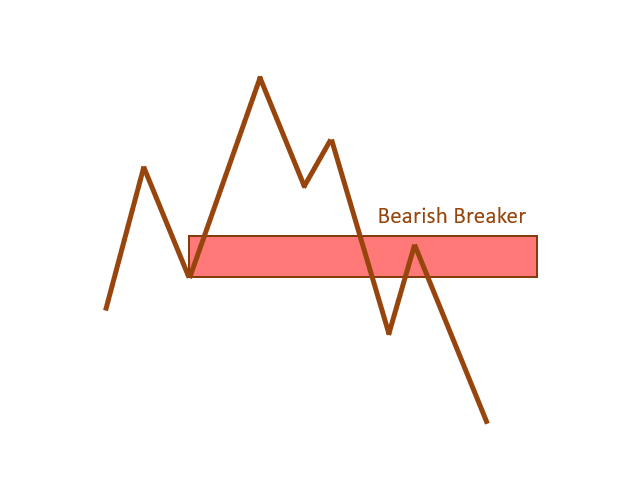
Breaker blocks are areas where institutions look to mitigate their losses and make the price target new price levels. Bullish Breaker Blocks are bullish ranges in the most recent swing high prior to a liquidity grab in an old low. The sellers that sold this low and see the swing high violated will look to mitigate the loss. Bearish Breaker Blocks are bearish ranges in the most recent swing low prior to a liquidity grab in an old high. The buyers that sold this high and see the swing low violated will look to mitigate the loss.

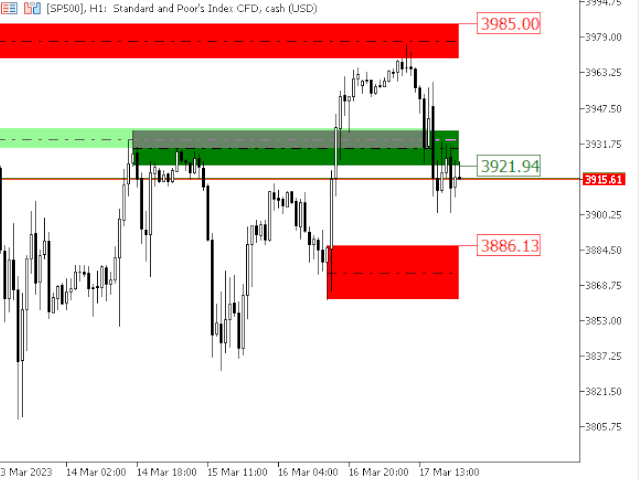
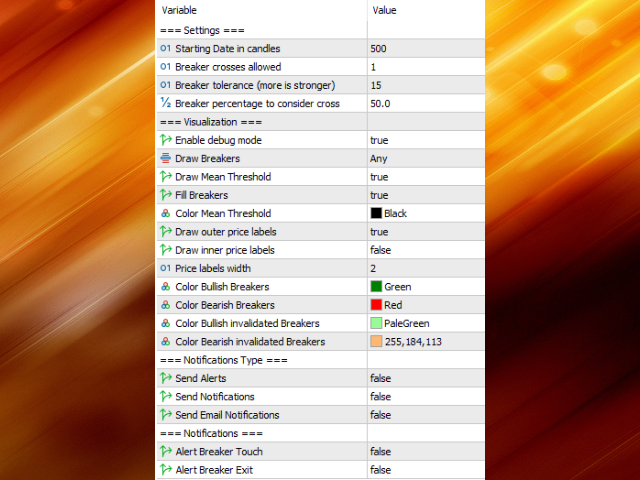
The ICT Breakers indicator is easy to use and can be applied to any time frame. It displays the order flow and volume data in a clear and concise manner, making it simple to interpret and act on the information. The indicator also includes a variety of customizable settings, allowing traders to tailor it to their specific trading style and preferences.

With the ICT Breakers indicator, traders can gain a better understanding of market dynamics and make more informed trading decisions. Whether you are a day trader, swing trader, or position trader, this indicator can help you identify key levels and potential trading opportunities.

Overall, the ICT Breakers indicator is a must-have for any trader looking to gain an edge in the market and make more informed trading decisions.

Other features

  • Sophisticated alerts and notifications system
  • Highly customizable


推荐产品
Trend Catcher with Alert MT5
Issam Kassas
4.62 (61)
趋势捕捉器: 具有警示指标的趋势捕捉器策略是一种多功能的技术分析工具,可帮助交易员识别市场趋势和潜在的进出点。它采用动态趋势捕捉器策略,根据市场条件进行调整,清晰地呈现趋势方向。交易员可以自定义参数,以符合其偏好和风险容忍度。该指标有助于识别趋势,发出潜在的反转信号,充当跟踪止损机制,并提供实时警报,以便及时应对市场。 具有警示指标的趋势捕捉器策略是一种多功能的技术分析工具,可帮助交易员识别市场趋势和潜在的进出点。它采用动态趋势捕捉器策略,根据市场条件进行调整,清晰地呈现趋势方向。交易员可以自定义参数,以符合其偏好和风险容忍度。该指标有助于识别趋势,发出潜在的反转信号,充当跟踪止损机制,并提供实时警报,以便及时应对市场。 特点: 趋势识别:信号牛市趋势和熊市趋势。 趋势反转:当蜡烛颜色从牛市变为熊市,反之亦然时,提醒可能的反转。 实时警报:为新趋势识别生成警报。 建议: 货币和货币对:EURUSD,AUDUSD,XAUUSD... 时间框架:H1。 账户类型:任何ECN,低点差账户。
FREE
PipFinite Exit EDGE MT5
Karlo Wilson Vendiola
4.86 (29)
Did You Have A Profitable Trade But Suddenly Reversed? In a solid strategy, exiting a trade is equally important as entering. Exit EDGE helps maximize your current trade profit and avoid turning winning trades to losers. Never Miss An Exit Signal Again Monitor all pairs and timeframes in just 1 chart www.mql5.com/en/blogs/post/726558 How To Trade You can close your open trades as soon as you receive a signal Close your Buy orders if you receive an Exit Buy Signal. Close your Sell orde
Ultimate Supply Demand MT5
Ramon Sobrevals Arce
5 (4)
After working during many months, with the help of Neural Networks, we have perfected the ultimate tool you are going to need for identifying key price levels (Supports and Resistances) and Supply and Demand zones. Perfectly suitable to trigger your trades, set up your future actions, decide your Take Profit and Stop Loss levels, and confirm the market direction. Price will always move between those levels, bouncing or breaking; from one zone to another, all the remaining movements are just mark
Noize Absorption Index
Ekaterina Saltykova
Noize Absorption Index - is the manual trading system that measures the difference of pressure between bears forces and bulls forces. Green line - is a noize free index that showing curent situation. Zero value of index shows totally choppy/flat market.Values above zero level shows how powerfull bullish wave is and values below zero measures bearish forces.Up arrow appears on bearish market when it's ready to reverse, dn arrow appears on weak bullish market, as a result of reverse expectation.
Owl Smart Levels MT5
Sergey Ermolov
4.07 (28)
MT4版本  |   FAQ Owl Smart Levels Indicator 是一個完整的交易系統,包含 Bill Williams 的高級分形、構建正確的市場波浪結構的 Valable ZigZag 以及標記準確入場水平的斐波那契水平等流行的市場分析工具 進入市場和地方獲利。 策略的详细说明 指示灯使用说明 顾问-贸易猫头鹰助手助理 私人用户聊天 ->购买后写信给我,我会将您添加到私人聊天中,您可以在那里下载所有奖金 力量在於簡單! Owl Smart Levels 交易系統非常易於使用,因此適合專業人士和剛開始研究市場並為自己選擇交易策略的人。 策略和指標中沒有隱藏的秘密公式和計算方法,所有策略指標都是公開的。 Owl Smart Levels 允許您快速查看進入交易的信號,突出顯示下訂單的水平並向您發送有關已出現信號的通知。 優點很明顯: 清楚地顯示主要和更高時間框架的趨勢方向。 指示儀器信號的出現。 標記開單、止損設置和固定利潤的水平。 沒有多餘的,只有必要的結構! ZigZag 表示全球趨勢的方向,因此也表示貿易方向。 市場反轉點的短線清楚地表明在什麼水平上構建斐波
PZ Penta O MT5
PZ TRADING SLU
The Penta-O is a 6-point retracement harmonacci pattern which usually precedes big market movements. Penta-O patterns can expand and repaint quite a bit. To make things easier this indicator implements a twist: it waits for a donchian breakout in the right direction before signaling the trade. The end result is an otherwise repainting indicator with a very reliable trading signal. The donchian breakout period is entered as an input. [ Installation Guide | Update Guide | Troubleshooting | FAQ | A
No Demand No Supply MT5
Trade The Volume Waves Single Member P.C.
No Demand No Supply   This indicator identifies   No Demand –No Supply candles to your chart and plots volume bars colored according to the signal. It can be applied to all timeframes or to a specific one only. It can also be used as regular volume indicator  with exceptional future of WEIGHTED VOLUME. Furthermore is has an alert notification, sound and email when a signals occurs. The indicator does not repaint but the alert will come on two candles back due to the definition of No Demand No Su
Break Of Structure Pro Is price action king? 1. Price is the ultimate king in the forex market, stock market or any other market. Using price action is the reason we can see more profit over loss. Technical analysis is the art of using data points to your advantage and taking informed decisions while entering, trailing and exiting a position on any timeframe. Break Of Structure Pro can be used to trend trade, scalp, hedge or swing trade. Price action is a trading technique that allows a tra
Double HMA MTF for MT5
Pavel Zamoshnikov
3.67 (3)
This is an advanced multi-timeframe version of the popular Hull Moving Average (HMA) Features Two lines of the Hull indicator of different timeframes on the same chart. The HMA line of the higher timeframe defines the trend, and the HMA line of the current timeframe defines the short-term price movements. A graphical panel with HMA indicator data from all timeframes at the same time . If the HMA switched its direction on any timeframe, the panel displays a question or exclamation mark with a tex
PipFinite Trend PRO MT5
Karlo Wilson Vendiola
4.85 (573)
Breakthrough Solution For Trend Trading And Filtering With All Important Features Built Inside One Tool! Trend PRO's smart algorithm detects the trend, filters out market noise and gives entry signals with exit levels. The new features with enhanced rules for statistical calculation improved the overall performance of this indicator. Important Information Revealed Maximize the potential of Trend Pro, please visit www.mql5.com/en/blogs/post/713938 The Powerful Expert Advisor Version Automa
Liquidity Oscillator
Paolo Scopazzo
5 (1)
A powerful oscillator that provide Buy and Sell signals by calculating the investor liquidity. The more liquidity the more buy possibilities. The less liquidity the more sell possibilities. Please download the demo and run a backtest! HOW IT WORKS: The oscillator will put buy and sell arrow on the chart in runtime only . Top value is 95 to 100 -> Investors are ready to buy and you should follow. Bottom value is 5 to 0 -> Investors are ready to sell and you should follow. Alert + sound will app
Atomic Analyst MT5
Issam Kassas
4.56 (18)
首先值得强调的是,该交易指标是非重绘、非延迟的指标,这使其成为手动和机器人交易的理想选择。 用户手册:设置、输入和策略。 Atomic Analyst是一种PA价格行动指标,利用价格的力量和动量来寻找市场上更好的机会。配备了高级过滤器,可帮助去除噪音和假信号,并提高交易潜力。使用多层复杂的指标,Atomic Analyst扫描图表,并将复杂的数学计算转化为任何初学者都能理解并用来做出一致交易决策的简单信号和颜色。 “Atomic Analyst”是专为新手和经验丰富的交易者量身定制的综合交易解决方案。它将高级指标和一流功能融合为一体的交易策略,使其成为所有类型交易者的多功能选择。 日内交易和剥头皮策略:专为快速准确的日内交易和短期交易而设计。 日内和摆动交易策略:可用作追求价格大幅波动的日内和摆动交易者的可靠工具。 多货币和市场:凭借其可靠的精度,在不同的工具和市场上运作。 多个时间框架:可在多个时间框架上使用,性能良好。 稳定性:所有指标均不重绘、不重绘和不滞后,确保可靠的信号。 信号清晰度:提供箭头信号,用于清晰的入场和出场点。 实时警报:通过交易入场、SL和TP警报通知交
ZigZag with Fibonacci
Rafael Caetano Pinto
This indicator uses the metaquotes ZigZag indicator as base to plot fibonacci extension and fibonacci retracement based in the Elliot waves. A fibonacci retracement will be plotted on every wave draw by the ZigZag. A fibonacci extension will be plotted only after the 2nd wave. Both fibonacci will be updated over the same wave tendency. Supporting until 9 consecutive elliot waves. Parameters: Depth: How much the algorithm will iterate to find the lowest and highest candles Deviation: Amoun
Renko Gold
Ignacio Agustin Mene Franco
Renko Gold! clearly indicates the floors and ceilings where it goes from 4 lines, the line below that marks the floor in green confirming with the thinnest line clarifies the purchase entry, the same is for sale, the top line marks the ceiling and the thinnest red line marks the sale, This indicator works for all temporalities! For Forex and Synthetic Indices markets! It also works for crypto markets! Good profit! World Investor.
WanaScalper
Isaac Wanasolo
1 (1)
A scalping indicator based on mathematical patterns, which on average gives signals with relatively small SL, and also occasionally helps to catch big moves in the markets (more information in the video) This indicator has three main types of notifications: The first type warns of a possible/upcoming signal on the next bar The second type indicates the presence of a ready signal to enter the market/open a position The third type is for SL and TP levels - you will be notified every time price r
Blahtech Market Profile MT5
Blahtech Limited
5 (8)
Was: $249  Now: $99   Market Profile defines a number of day types that can help the trader to determine market behaviour. A key feature is the Value Area, representing the range of price action where 70% of trading took place. Understanding the Value Area can give traders valuable insight into market direction and establish the higher odds trade. It is an excellent addition to any system you may be using. Inspired by Jim Dalton’s book “Mind Over Markets”, this indicator is designed to suit the
支撑和阻力指标是改编自标准的比尔威廉姆斯的分形指标。 该指标可工作于任何时间帧。它在图表上显示支撑和阻力位,并允许设置止损和止盈级别 (您可以通过鼠标覆盖级别来检查其精确值)。 蓝色点划线是支撑位。 红色点划线是阻力位。 如果您愿意, 您可以改变这些线的样式和颜色。 如果价格接近支撑位,卖方的活跃度降低,买方的活跃度增加。如果价格接近阻力位,买方的活跃度降低,卖方的活跃度增加。 注, 当价格突破支撑位, 它变为阻力位; 同样当价格突破阻力位, 它变为支撑位。
SolarTrade Suite 金融指标:木星市场指标 - 您在金融市场世界中的可靠指南! 这是一个趋势指标,使用特殊的创新和高级算法来计算其值,并且具有令人赏心悦目的设计。 很容易理解此指标的读数:蓝色 - 买入,红色 - 卖出。 在说明底部查看我们来自 SolarTrade Suite 系列的其他产品。 您想自信地驾驭投资和金融市场的世界吗? SolarTrade Suite 金融指标:木星市场指标是一款创新软件,旨在帮助您做出明智的投资决策并增加您的利润。 SolarTrade Suite 金融指标:木星市场指标的优势: - 准确预测:我们的指标使用先进的算法和分析方法来准确预测市场走势。 接收有关买卖资产最佳时机的信号。 - 用户友好界面:直观的界面将使您能够轻松掌握该程序并在安装后立即开始享受其好处。 您可以从设置中更改点的大小和颜色、灵敏度和速度,所有其他设置都是自动完成的。 - 专家支持:我们的专业团队随时准备为您解答任何问题并提供有关使用该程序的建议。 为什么选择 SolarTrade Suite 财务指标:木星市场指标? -
Bullet indicator x
Dorah Zandile Mahesu
The bullet indicator gives accurate direction of the market structure, it will indicate to you the exact direction whether it be the market is in a downtrend or if it's in an uptrend it will give you that information which will inturn benefits you by saving you the time it takes to analyse that structure, this indicator works on a timeframes and it's most favourable on higher timeframes. How it works: -The green arrow will be at the support of the structure indicating buys -The red arrow will
Your Trend Friend
Luigi Nunes Labigalini
5 (1)
The trend is your friend! Look at the color of the indicator and trade on that direction. It does not  repaint. After each candle is closed, that's the color of the trend. You can focus on shorter faster trends or major trends, just test what's most suitable for the symbol and timeframe you trade. Simply change the "Length" parameter and the indicator will automatically adapt. You can also change the color, thickness and style of the lines. Download and give it a try! There are big movements
首先,值得强调的是,这个交易工具是非重绘、非重画和非滞后的指标,非常适合专业交易。 在线课程,用户手册和演示。 智能价格行动概念指标是一个非常强大的工具,既适用于新手,也适用于经验丰富的交易者。它将超过20个有用的指标合并到一个指标中,结合了高级交易思想,如内圈交易员分析和智能资金概念交易策略。该指标侧重于智能资金概念,提供有关大型机构交易方式的见解,帮助预测它们的动向。 它在流动性分析方面尤其擅长,有助于理解机构的交易方式。它擅长预测市场趋势,并仔细分析价格波动。通过将您的交易与机构策略对齐,您可以更准确地预测市场走向。该指标多才多艺,擅长分析市场结构,识别重要的订单区块,并识别各种模式。 它擅长识别BOS和CHoCH等模式,理解动量的转变,并突出显示供需强劲的关键区域。它还擅长发现强大的不平衡,并分析价格创造更高高点或更低低点的模式。如果您使用斐波那契回撤工具,该指标可以满足您的需求。它还可以识别相等的高点和低点,分析不同的时间框架,并通过仪表板显示数据。 对于使用更高级策略的交易者,该指标提供了工具,如公平价值差指标和优惠和折扣区域的识别。它特别关注高时间框架订单
该指标建立当前报价,可以与历史报价进行比较,并在此基础上进行价格走势预测。指示器有一个文本字段,用于快速导航到所需日期。 选项: 符号 - 选择指标将显示的符号; SymbolPeriod - 选择指标从中获取数据的时段; IndicatorColor - 指示器颜色; HorisontalShift - 由指标绘制的报价移动指定的柱数; Inverse - true 反转引号,false - 原始视图; ChartVerticalShiftStep - 图表垂直移动(键盘上的向上/向下箭头); 接下来是文本字段的设置,您可以在其中输入日期,您可以通过按“回车”立即跳转到该日期。 接下来是文本字段的设置,您可以在其中输入日期,您可以通过按“回车”立即跳转到该日期。
A machine translation from the English product description was used. We apologize for possible imprecisions. 使用了英文 产 品描述的机器翻 译。 我 们对可能的不准确表示歉意 。 最喜 欢的烛台价格行为模式的可视化系统 。 附加后,指 标将自动在图表上标记下一个模式 : 匹 诺曹酒吧  - 带有长 “ 鼻子 ” 的小型条形杆,非常著名的反向模式; 内柱  -  一个柱,其范 围位于前一个柱的范围内。   它代表市 场的不确定性 ; 外柱  -  其范 围超出前一个柱的范围的柱。   它代表市 场的不确定性 ; 导轨图案  - 两个随之而来的 对立柱,具有几乎相等的、较大的实体。 反向模式, 实际上与更高时间框架的匹诺曹柱线模式相吻合 ; 主蜡 烛形态  -  蜡 烛的第五根,其中四个后续蜡烛的范围 在第五根蜡 烛的范围内   -   主蜡 烛。   这种模式代表市场整合,尤其是在较短的时间范围内 。 差距  -  后 续柱的收盘价和开盘价之间的差距,不应忽视 。 该指标的开发考
该指标将向您显示您已经为图表上的每个订单设置的 TP 和 SL 值(以该货币表示)(接近交易/订单行),这将帮助您估算每个订单的利润和损失。它还会向您显示 PIP 值。显示的格式是“我们的损益/PIP 值的货币值”。 TP 值将以绿色显示,SL 值将以红色显示。 如有任何问题或了解更多信息,请随时通过 fxlife.asia@hotmail.com 或 fxlife.asia@yahoo.com 与卖家联系 (而指标中即将加入的下一个功能是“自动或半自动TP和SL设置”,我们的客户将免费获得更新版本。谢谢...^_^) (或者如果您认为在指示中应该增加一些功能,请随时告诉我们) ========================================================
An indicator of pattern #31 ("Long Island") from Encyclopedia of Chart Patterns by Thomas N. Bulkowski. The second gap is in the opposite direction. Parameters: Alerts - show alert when an arrow appears   Push - send a push notification when an arrow appears (requires configuration in the terminal) GapSize - minimum gap size in points ArrowType - a symbol from 1 to 17 ArrowVShift - vertical shift of arrows in points   ShowLevels - show levels ColUp - color of an upward line ColDn - color of a
To download MT4 version please click here . - This is the exact conversion from TradingView: "Trend Direction Force Index - TDFI [wm]" By "causecelebre". - This indicator uses multiple levels of averaging to detect trend strength. - You can optimize filter low and filter high levels to achieve best results. - You have access to buffers to use in EAs. - This is a light-load processing and non-repaint indicator. - You can message in private chat for further changes you need.
Magic Finger 能帮助你清晰的发现趋势及交易机会。此系统根据经典策略加上个人交易经验制作。您也可以根据此指标加上您的交易风格去编写EA。 手指指向为开仓信号,变色线为趋势确认。如果您是日内交易者,可以选择在交易活跃的时间段内交易,参考变色线作为下单方向依据,手指信号作为过滤器。 如果你是趋势交易者,可以选择在H1以上的周期,在关键价格区域等待手指信号的出现,并入市交易,然后以变色线作为趋势的确认。 止损可以止损圆点作为依据。 输入参数如下: RISK 5 MONEY RISK 2.0 AlertOption ********************************* Local Alert true TimesOfAlerts 2 E-Mail Alert false App PUSH Notification  false ***ADR Option**  *********************************  Display ADR  true  ATR Period  18  Normal Col
该产品的买家也购买
TPSpro RFI Levels MT5
Roman Podpora
4.7 (10)
Reversal First Impulse levels (RFI)      INSTRUCTIONS        RUS       -       ENG              R ecommended to use with an indicator   -   TPSpro  TREND PRO -  Version MT4                 A key element in trading is zones or levels from which decisions to buy or sell a trading instrument are made. Despite attempts by major players to conceal their presence in the market, they inevitably leave traces. Our task was to learn how to identify these traces and interpret them correctly. Main functi
首先,值得强调的是,这个交易系统是一个非重绘、非重画和非滞后的指标,这使得它非常适合手动和机器人交易。 在线课程,手册和下载预设。 “智能趋势交易系统 MT5”是专为新手和经验丰富的交易者量身定制的综合交易解决方案。它结合了超过 10 个优质指标,具有 7 多个强大的交易策略,使其成为适用于各种市场条件的多功能选择。 趋势跟随策略:提供精确的入场和止损管理,以有效地跟随趋势。 反转策略:识别潜在的趋势反转,使交易者能够利用区域市场的机会。 剃头策略:专为快速准确的日内交易和短期交易而设计。 稳定性:所有指标都不会重绘、不会重画和不会滞后,确保可靠的信号。 定制:支持自定义策略,以满足个人交易偏好。超过 7 种策略和组合可帮助您找到最佳策略。 信号清晰度:提供箭头信号,以指示清晰的入场和退出点。 实时警报:通过交易进出警报使交易者保持了解。 深入分析:提供更高时间框架的趋势分析和实时交易监控。 自适应颜色编码:利用蜡烛颜色编码来显示成交量、趋势和反转蜡烛信号。通过蜡烛颜色分析市场方向。 “智能趋势交易系统 MT5”赋予交易者必要的工具,以便在各种市场条件下做出明智和战略性的交易决策。无论
MetaForecast M5
Vahidreza Heidar Gholami
5 (2)
MetaForecast能够根据价格数据中的谐波来预测和可视化任何市场的未来走势。虽然市场不总是可预测的,但如果价格中存在模式,MetaForecast可以尽可能准确地预测未来。与其他类似产品相比,MetaForecast通过分析市场趋势可以生成更精确的结果。 输入参数 Past size (过去的尺寸) 指定MetaForecast用于创建生成未来预测模型的柱数量。该模型以一条黄色线绘制在所选柱上。 Future size (未来的尺寸) 指定应预测的未来柱数量。预测的未来以粉色线表示,并在其上绘制了蓝色回归线。 Degree (程度) 此输入确定了MetaForecast将在市场上进行的分析级别。 Degree 描述  0 对于程度0,建议使用较大的值来设置“过去的尺寸”输入,以覆盖价格中的所有高峰、低谷和细节。  1 (建议的) 对于程度1,MetaForecast可以理解趋势,并通过较小的“过去的尺寸”生成更好的结果。  2 对于程度2,除了趋势,MetaForecast还可以识别反转点。对于大于1的程度,必须使用较高的“细节”和“噪音减少”输入值。  大于2 不建议使用大
RelicusRoad Pro MT5
Relicus LLC
5 (17)
现在$ 147(更新后增加到$ 499) - 无限帐户(PC或Mac) RelicusRoad 用户手册 + 培训视频 + 访问 Private Discord Group + VIP 身份 一种看待市场的新方式 RelicusRoad 是世界上最强大的外汇、期货、加密货币、股票和指数交易指标,为交易者提供保持盈利所需的所有信息和工具。我们提供技术分析和交易计划,帮助每一位交易者取得成功,从初学者到高级。它是一个关键的交易指标,可以提供足够的信息来预测未来的市场。我们相信一个完整的解决方案,而不是图表上几个没有意义的不同指标。这是一个多合一指标,显示无与伦比且非常准确的信号、箭头 + 价格行为信息。 RelicusRoad 基于强大的人工智能,提供缺失的信息和工具来教育您并使您成为交易专家,成为成功的交易者。 几乎所有技术指标都滞后,这意味着它们只能报告已经发生的事情。因此,他们只确认您过去可以看到的价格已经在哪里。我们相信领先指标可以预测未来价格,而无需重新绘制,也不要过度依赖可能改变并导致重新绘制的滞后指标。如果您根据滞后指标进行交易并建立头寸,您就知道您已
TrendMaestro5
Stefano Frisetti
note: this indicator is for METATRADER4, if you want the version for METATRADER5 this is the link:  https://www.mql5.com/it/market/product/108106 TRENDMAESTRO ver 2.4 TRENDMAESTRO recognizes a new TREND in the bud, he never makes mistakes. The certainty of identifying a new TREND is priceless. DESCRIPTION TRENDMAESTRO identifies a new TREND in the bud, this indicator examines the volatility, volumes and momentum to identify the moment in which there is an explosion of one or more of these data a
How to use Pair Trading Station Pair Trading Station is recommended for H1 time frame and you can use it for any currency pairs. To generate buy and sell signal, follow few steps below to apply Pair Trading Station to your MetaTrader terminal. When you load Pair Trading Station on your chart, Pair Trading station will assess available historical data in your MetaTrader platforms for each currency pair. On your chart, the amount of historical data available will be displayed for each currency pai
Bill Williams Advanced
Siarhei Vashchylka
5 (8)
Bill Williams Advanced is designed for automatic chart analysis using Bill Williams' "Profitunity" system. The indicator analyzes four timeframes at once. Manual (Be sure to read before purchasing) Advantages 1. Automatically analyzes the chart using the "Profitunity" system of Bill Williams. The found signals are placed in a table in the corner of the screen. 2. Equipped with a trend filter based on the Alligator indicator. Most of the system signals are recommended to be used only accordi
Go Way TREND
Ywsf Hsyn Hmad Alrsh
順應潮流。是的,在 15 分鐘的框架上等待進場信號,無論是買入還是賣出,並檢查信號是否出現在 30 分鐘的框架上(有時信號需要一個小時或更長時間才會出現。您可以返回到15分鐘框架並返回到30分鐘框架,重複此操作,直到主要訊號出現在您面前。被記錄,或當相反的訊號出現時它非常簡單並且適用於所有主要貨幣。  金屬、指標和所有框架,但最好的結果是 30 分鐘框架。 始終將止損設置在蠟燭底部下方,資金管理不得超過 資本的10% 順應潮流。是的,在 15 分鐘的框架上等待進場信號,無論是買入還是賣出,並檢查信號是否出現在 30 分鐘的框架上(有時信號需要一個小時或更長時間才會出現。您可以返回到15分鐘框架並返回到30分鐘框架,重複此操作,直到主要訊號出現在您面前。被記錄,或當相反的訊號出現時它非常簡單並且適用於所有主要貨幣。  金屬、指標和所有框架,但最好的結果是 30 分鐘框架。 始終將止損設置在蠟燭底部下方,資金管理不得超過 資本的10% 順應潮流。是的,在 15 分鐘的框架上等待進場信號,無論是買入還是賣出,並檢查信號是否出現在 30 分鐘的框架上(有時信號需要一個小時或更長時
Beast Super Signal MT5
Dustin Vlok
2.71 (7)
正在寻找可以帮助您轻松识别有利可图的交易机会的强大外汇交易指标? Beast Super Signal 就是您的不二之选。 这个易于使用的基于趋势的指标持续监控市场状况,寻找新的发展趋势或跳入现有趋势。当所有内部策略一致且彼此 100% 融合时,Beast Super Signal 会发出买入或卖出信号,无需额外确认。当您收到信号箭头警报时,只需买入或卖出。 购买后给我留言,让我加入我的私人 VIP 群组! (仅限购买完整产品)。 购买后给我发消息以获取最新的优化设置文件。 此处提供 MT4 版本。 在此处 获取 Beast Super Signal EA。 查看评论部分以查看最新结果! Beast Super Signal 根据您偏好的 1:1、1:2 或 1:3 风险回报率建议入场价、止损和获利水平,让您放心交易。这个 Beast Super Signal 是 100% 不可重新绘制的,这意味着它永远不会重新计算或重新绘制,每次都能为您提供可靠的信号。 Beast Super Signal 指标适用于所有时间范围,包括货币对、指数、商品和加密货币对。
FxaccurateLS
Shiv Raj Kumawat
WHY IS OUR FXACCCURATE LS MT5 THE PROFITABLE ? PROTECT YOUR CAPITAL WITH RISK MANAGEMENT Gives entry, stop and target levels from time to time. It finds Trading opportunities by analyzing what the price is doing during established trends. POWERFUL INDICATOR FOR A RELIABLE STRATEGIES We have made these indicators with a lot of years of hard work. It is made at a very advanced level. Established trends provide dozens of trading opportunities, but most trend indicators completely ignore them!
首先值得强调的是,这个交易系统是一个不重绘、不重画和不滞后的指标,这使它非常适合专业交易。 在线课程,用户手册和演示。 “智能支撑和阻力交易系统”是专为新手和经验丰富的交易者量身定制的先进指标。它赋予交易者在外汇市场上精确和自信的能力。这个综合系统结合了7+种策略、10个指标和各种交易方法,包括日内交易策略、波段交易策略、支撑和阻力策略、蜡烛图模式策略、VWAP策略、多时间段趋势策略等。它提供箭头信号、入场和出场点、交易警报、更高时间框架的趋势分析、实时交易监控以及见解深刻的趋势和成交量蜡烛染色。通过自动支撑和阻力检测,这是一个多面手的指标,帮助交易者在不同的市场条件下做出明智的决策。 “智能支撑和阻力交易系统”是一个强大的技术分析方法,融合了一套高端和强大的指标和工具。在其核心,这个系统识别关键的支撑和阻力水平,这些水平作为潜在市场反转或延续的关键区域。该系统无缝集成了多时间框架趋势面板,增强了交易者在不同时间框架下评估当前趋势方向的能力。此外,蜡烛图模式检测器扫描价格图表以获取重要的蜡烛图模式,为潜在的市场走势提供宝贵的见解。此外,VWAP(成交量加权平均价格)的加入
Cryo
Sabina Fik
5 (1)
Cryo is based on the process of identifying the rate of change in price growth and allows you to find entry and exit points from the market. A fundamental technical indicator that allows you to assess the current market situation in order to enter the market of the selected currency pair in a trend and with minimal risk. The Cryo indicator was created on the basis of the original indicators for searching for extremes, the indicator is well suited for determining a reversal or a large sharp je
Elliot Waves Analyzer Pro
Viktor Weidenthal
2.67 (3)
Elliot Waves Analyzer Pro calculates Elliot Waves to Help Identify Trend direction and Entry Levels. Mainly for Swing Trading Strategies. Usually one would open a Position in trend direction for Wave 3 or a Correction for Wave C . This Indicator draws Target Levels for the current and next wave. Most important Rules for Elliot Wave Analysis are verified by the Indicator.  The Pro version analyzes Multiple Timeframes and shows the Subwaves and Target-Levels.   For an Overview  " Elliot Waves Anal
Introduction Excessive Momentum Indicator is the momentum indicator to measure the excessive momentum directly from raw price series. Hence, this is an extended price action and pattern trading. Excessive Momentum Indicator was originally developed by Young Ho Seo. This indicator demonstrates the concept of Equilibrium Fractal Wave and Practical Application at the same time. Excessive Momentum detects the market anomaly. Excessive momentum will give us a lot of clue about potential reversal and
Introduction to Fractal Pattern Scanner Fractal Indicator refers to the technical indicator that makes use of the fractal geometry found in the financial market. Fractal Pattern Scanner is the advanced Fractal Indicator that brings the latest trading technology after the extensive research and development work in the fractal geometry in the financial market. The most important feature in Fractal Pattern Scanner is the ability to measure the turning point probability as well as the trend probabil
IVISTscalp5
Vadym Zhukovskyi
5 (5)
我们向您介绍iVISTscalp5指标,它不仅独特,而且在交易操作中也非常有效。该指标基于时间数据,是多年金融市场经验和深入分析的结果。iVISTscalp5指标是手动交易的优秀工具。便利性、简单性和可视化 - 所有的复杂性都隐藏在内部。我们将iVISTscalp5指标的设置和使用简化到了最大程度。该指标适用于MT5终端中您所拥有的所有金融工具。 操作时间为UTC+3的早上4点到晚上8点。 iVISTscalp5指标菜单(见截图1): History - 计算行情的周数 dT_min - 选择时间间隔的时间(分钟) TFline - 绘制水平成交量(时间帧) BARSline - 绘制水平成交量(条数) TFtrend1 - 绘制日线通道(时间帧) BARStrend1 - 绘制日线通道(条数) TFtrend2 - 绘制周线通道(时间帧) BARStrend2 - 绘制周线通道(条数) ALERT_TIMER - 设置闹钟 ALERT - 开启/关闭闹钟 Save - 开启/关闭将时间记录到文本文件。 图表上的红色和蓝色旗帜表示时间(VIST智能剃须系统的信号)。卖出信号为红旗,买入
VTrende Pro
Andrii Diachenko
5 (1)
VTrende Pro - MTF indicator for trend trading with a display panel for MT5 *** Videos can be translated into any language using subtitles (video language - Russian) Although the signals of the VTrende Pro indicator can be used as signals of a full-fledged trading system, it is recommended to use them in conjunction with the Bill Williams TS. VTrende Pro is an extended version of the VTrende indicator. Difference between Pro version and VTrende: - Time zones - Signal V - signal 1-2 waves
Piranha version 2
Maria Strudov
5 (1)
"Piranha" - an autonomous trading system that determines overbought and oversold levels on the chart. Red and blue zones represent overbought and oversold levels respectively. Entry points are marked with arrows: a downward arrow in the red zone for "sell" and an upward arrow in the blue zone for "buy". The Take profit level is indicated by the green moving average. Key features: Adjusting the Take profit level as the green moving average changes position. Averaging ability when a new market e
Introduction to X3 Chart Pattern Scanner X3 Cherart Pattern Scanner is the non-repainting and non-lagging indicator detecting X3 chart patterns including Harmonic pattern, Elliott Wave pattern, X3 patterns, and Japanese Candlestick patterns. Historical patterns match with signal patterns. Hence, you can readily develop the solid trading strategy in your chart. More importantly, this superb pattern scanner can detect the optimal pattern of its kind. In addition, you can switch on and off individu
Elliott Wave Trend MT5
Young Ho Seo
4 (3)
Elliott Wave Trend was designed for the scientific wave counting. This tool focuses to get rid of the vagueness of the classic Elliott Wave Counting using the guideline from the template and pattern approach. In doing so, firstly Elliott Wave Trend offers the template for your wave counting. Secondly, it offers Wave Structural Score to assist to identify accurate wave formation. It offers both impulse wave Structural Score and corrective wave Structure Score. Structural Score is the rating to sh
Introducing the South African Sniper indicator created by a small group of traders with a few years trading trading the financial market profitably . This is a plug and play indicator that provides you with  BUY and SELL (SNIPER ENTRY) signals with TARGET and trail stops. The indicator Works with all MT5 trading instruments. The indicator uses previous  chart data as receipt to speculate on future market moves.  "The South African Sniper indicator community are very happy with the indicator an
Golden Gate Algo MT5
James David Lane
4 (6)
40% 圣诞优惠!价格将于1月1日涨至$250! 推出GoldenGate Entries:前沿交易解决方案! 发现与GoldenGate Entries(GGE)一同进行交易的革命性方法,这是一款设计用于提升您交易体验的先进指标。GGE提供了一套全面的功能,以赋予用户在交易决策中的精准和信心。 交易对:任意(外汇 - 商品 - 股票 - 股票 - 加密货币) 时间框架:15分钟至H1 主要特点: 买入和卖出箭头指示:接收伴随弹出警报的买入和卖出箭头指示,确保您随时保持了解。 GoldenGate_Algo:通过GoldenGate_Algo深入了解市场状况,这是一款强大的工具,用于评估市场是否处于“超卖”或“超买”状态。 当前趋势分析:通过访问您正在查看的时间框架上的当前趋势,保持领先地位,使您能够将交易与市场当前方向对齐。 内置枢轴点:使用内置的枢轴点轻松识别关键市场点,提供有价值的支撑和阻力水平。 蜡烛扫描器:分析蜡烛形态和图案,找到最佳的入场点并过滤掉低概率的入场。 完全定制:通过完整的定制选项,完全掌控您的交易体验,允许您个性化从
SMCpro
Arief
5 (1)
Currently Price  20% OFF  ( for unlimited use ) Indicator   USER MANUAL , trade setups, solving issues, etc :  Direct Download Here     (  for users only  ) Hello World! Introducing.. SMCpro tool and Indicator for  MetaTrader 5 , a cutting-edge feature designed to revolutionize your trading experience. With innovative ICT Smart Money Concept, you gain unparalleled insight into market dynamics, empowering you to make informed trading decisions like never before. SMC Indicator built on th
The iChannels
BeeXXI Corporation
5 (2)
Ultra-fast recognition of parabolic channels (as well as linear, horizontal and wavy channels) throughout the depth of history, creating a hierarchy of channels. Required setting: Max bars in chart: Unlimited This indicator is designed primarily for algorithmic trading, but can also be used for manual trading.  This indicator will have a very active evolution in the near future and detailed descriptions on how to apply to create robots
Introducing the Power Trade Plus indicator designed by a small group of traders with a few years of experience trading the market profitably.  The Power Trade Plus is derived from the Power Trade indicator,  the indicator strive in powerful sniper entries and take profit levels,  with an algorithm that's can determine the markets volatility and Provides entries based on the current market volatility. This indicator is much more effective in stock ,currencies and indices.
精密指数振荡器(Pi-Osc)由Precision Trading Systems的Roger Medcalf开发 版本2经过精心重新编码,以在您的图表上加载速度非常快,还加入了一些其他技术改进,以提高体验。 Pi-Osc旨在提供准确的交易定时信号,旨在找到极端的耗尽点,这些点是市场被迫去触及,以清理每个人的止损单。 该产品解决了一个古老的问题,即知道极端点在哪里,这使得交易员的生活变得更加简单。 这是一个高度复杂的共识指标,与行业标准的振荡器相比,具有一些强大的区别。 它使用的一些特征包括需求指数、资金流动、RSI、随机指标、模式识别、成交量分析、标准偏差极端点以及不同长度上述各种变化的分歧。 乍一看,对于未经培训的人来说,它似乎与任何其他振荡器没有什么不同,但当与其他振荡器(如RSI或动量等)相对比时,这个指标的真正威力开始显现。 据我所知,没有其他振荡器可以频繁地精确指出顶部和底部,具有相同的定期效率。 精密指数振荡器由许多不同的数学方程组成,用于测量多个时间框架采样中的价格和成交量变动,从而高度准确地预测趋势可能发生转折的位置。 PTS P
Matreshka
Dimitr Trifonov
5 (1)
Matreshka self-testing and self-optimizing indicator: 1. Is an interpretation of the Elliott Wave Analysis Theory. 2. Based on the principle of the indicator type ZigZag, and the waves are based on the principle of interpretation of the theory of DeMark. 3. Filters waves in length and height. 4. Draws up to six levels of ZigZag at the same time, tracking waves of different orders. 5. Marks Pulsed and Recoil Waves. 6. Draws arrows to open positions 7. Draws three channels. 8. Notes support and re
SpuerTrend MTF 指标 , 是一款出色的趋势跟踪指标 . 它不光能显示图表的时间框架下的 SuperTrend 趋势 , 还可以设置同时显示更大时间框架的 SuperTrend 趋势 . 这将有利于把握更大时间级别的趋势 , 判断未来的趋势 . 同时 , 还可以显示趋势线的价格 , 一目了然 , 便于观察 . 输入参数 :  ATR period used at chart timeframe           :  当前时间框架下的 ATR 周期 ATR weight used at chart timeframe           :   当前时间框架下的 ATR 权重 SuperTrend line width at chart timeframe   :  当前时间框架下的趋势线的宽度 Up trend line color at chart timeframe        :  当前时间框架下的上升趋势线的颜色 Down trend line color at chart timeframe    :  当前时间框架下的下降趋势线的颜色 Show
PTS - Divergence Buy Finder 由Precision Trading Systems制作 Precision Divergence Finder旨在精确找到市场底部,并经常成功。在技术分析中,挑选底部通常比挑选顶部容易得多,这个工具正是为了完成这个任务而设计的。在识别出牛市背离后,等待趋势上升再购买是明智的。您可以使用10或20个周期的最高点进场,或者使用15-30周期的移动平均线上升来识别趋势变化。 这个复杂的算法会实时逐根柱状图寻找并计算活跃的需求指数背离的数量。 该模型观察市场价格何时创出新低,而需求指数未创新低,从而产生背离。 该指标使用两个设置。     • 需求指数(DI)长度,它将为指标提供寻找的对象,并将为您选择的长度上的任何DI背离进行查找。     • 差异,这是[DI值现在]与[DI值长达200个周期以前]之间的背离量,对于它从各种回望期间找到的每个背离,它将在指标窗口中生成[1]输出。 最多检查20个周期,最大输出值将显示为20。 建议的设置 需求指数长度从15到100都可以使用,但最佳范围在20到60之间。 背离的差异为0.1至2
PTS Divergence Buy Finder MT5
PrecisionTradingSystems
PTS - Divergence Buy Finder 由Precision Trading Systems制作 Precision Divergence Finder旨在精确找到市场底部,并经常成功。在技术分析中,挑选底部通常比挑选顶部容易得多,这个工具正是为了完成这个任务而设计的。在识别出牛市背离后,等待趋势上升再购买是明智的。您可以使用10或20个周期的最高点进场,或者使用15-30周期的移动平均线上升来识别趋势变化。 这个复杂的算法会实时逐根柱状图寻找并计算活跃的需求指数背离的数量。 该模型观察市场价格何时创出新低,而需求指数未创新低,从而产生背离。 该指标使用两个设置。     • 需求指数(DI)长度,它将为指标提供寻找的对象,并将为您选择的长度上的任何DI背离进行查找。     • 差异,这是[DI值现在]与[DI值长达200个周期以前]之间的背离量,对于它从各种回望期间找到的每个背离,它将在指标窗口中生成[1]输出。 最多检查20个周期,最大输出值将显示为20。 建议的设置 需求指数长度从15到100都可以使用,但最佳范围在20到60之间。 背离的差异为0.1至2
作者的更多信息
Gold Guardian MT5
Diego Arribas Lopez
PROP FIRM GUIDE:   Guide LAUNCH PROMO : Act now to secure Gold Guardian at our launch promo price! This special offer is only available for a limited time, so don’t miss your chance to get this powerful trading tool at an unbeatable value. Grab it before the price goes up! Final Price: $699 Welcome to Gold Guardian ! Are you ready to transform your trading journey with precision and reliability? Built on years of expertise and proven strategies, Gold Guardian is here to elevate your trading e
Gold Guardian MT4
Diego Arribas Lopez
PROP FIRM GUIDE:   Guide LAUNCH PROMO : Act now to secure Gold Guardian at our launch promo price!   This special offer is only available for a limited time, so don’t miss your chance to get this powerful trading tool at an unbeatable value. Grab it before the price goes up! Final Price: $699 Welcome to   Gold Guardian ! Are you ready to transform your trading journey with precision and reliability? Built on years of expertise and proven strategies, Gold Guardian is here to elevate your trading
Order Block Indicator MT4
Diego Arribas Lopez
5 (2)
[ MT5 Version ] Only the next 10 units at current price! Final price: $299 How to trade using Order Blocks:  Click here Discover the future of trading with   Order Block Indicator , meticulously crafted for traders who demand unparalleled accuracy and customization. Whether you're scalping or swing trading, this tool is your gateway to mastering Order Blocks and Supply and Demand Zones—critical areas where price reversals often occur. Why Choose Order Block Indicator? Transform Your Trading Stra
MA Ribbon MT5
Diego Arribas Lopez
5 (1)
MT4 Version   MA Ribbon MT5 MA Ribbon is an enhanced indicator with 8 moving averages of increasing periods. MA Ribbon is useful to recognize trend direction,  reversals   and continuation points in the market as well as potential entry, partial take profit and exit points. Entry points for long and shorts position can be found when the price entries or leaves the Ribbon, at retest or a defined number of MA crossovers. It offers a good combination with mostly any volume or momentun indicators to
FREE
SMT Divergences MT4
Diego Arribas Lopez
5 (1)
MT5 Version SMT Divergences MT4 SMT Divergences is one of the most innovative indicators in the market. It offers the possibility of analyzing price divergences between 2 pairs. These divergences highlight and help to foresee what banks and institutions are planning to do. SMT divergences also provides you with a kill zones indicator and the possibility of filtering divergences occurring during these kill zones.  The strategy tester is limited in MT4. Contact the author to get your Demo Version
Backtesting Simulator MT4
Diego Arribas Lopez
5 (1)
[ MT5 Version ] Only the next 10 units at current price! Final price: $299 Are you tired of spending months on demo or live accounts to test your trading strategies? The Backtesting Simulator is the ultimate tool designed to elevate your backtesting experience to new heights. Utilizing Metatrader historical symbol information, it offers an unparalleled simulation of real market conditions. Take control of your testing speed, test ideas quickly or at a slower pace, and witness remarkable improvem
MT5 Version Fibonacci Bollinger Bands MT4 Fibonacci Bollinger Bands is a highly customizable indicator that shows areas of support and resistance. This indicator combines the logic for the Bollinger Bands with the Fibonacci level. Fibonacci Bollinger Bands is the   first   indicator in the market that allows the user to 100% customize up to 12 Fibonacci levels, the Moving Average type and the price data source to use for the calculations. This flexibility makes the Fibonacci Bollinger Bands easi
FREE
MT4 Version Fibonacci Bollinger Bands MT5 Fibonacci Bollinger Bands is a highly customizable indicator that shows areas of support and resistance. This indicator combines the logic for the Bollinger Bands with the Fibonacci level. Fibonacci Bollinger Bands is the first   indicator in the market that allows the user to 100% customize up to 12 Fibonacci levels, the Moving Average type and the price data source to use for the calculations. This flexibility makes the Fibonacci Bollinger Bands easily
FREE
[ MT4 Version ] Only the next 10 units at current price! Final price: $299 Are you tired of spending months on demo or live accounts to test your trading strategies? The Backtesting Simulator is the ultimate tool designed to elevate your backtesting experience to new heights. Utilizing Metatrader historical symbol information, it offers an unparalleled simulation of real market conditions. Take control of your testing speed, test ideas quickly or at a slower pace, and witness remarkable improve
MA Ribbon MT4
Diego Arribas Lopez
MT5 Version MA Ribbon MT4 MA Ribbon is an enhanced indicator with 8 moving averages of increasing periods. MA Ribbon is useful to recognize trend direction,  reversals   and continuation points in the market as well as potential entry, partial take profit and exit points. Entry points for long and shorts position can be found when the price entries or leaves the Ribbon, at retest or a defined number of MA crossovers. It offers a good combination with mostly any volume or momentun indicators to f
FREE
Fear and Greed MT5
Diego Arribas Lopez
5 (1)
[ MT4 Version ] How to trade using the Fear and Greed Indicator:  Click here Uncertain about when to take total or partial profits? The   Fear and Greed   is your reliable companion for making confident trading decisions. This innovative tool offers unparalleled insights into market sentiment, helping you identify key pivot zones and optimize your trading strategy. Why Choose Fear and Greed? Revolutionary Market Insight: Sentiment Analysis:   The first indicator for that reveals the market's Fea
MT5 to Telegram Signals
Diego Arribas Lopez
5 (1)
[ MT4 Version ] [ Discord Signals ]  MT5 to Telegram Signals Connect your broker account with Telegram and stop missing important notifications.  Would you like to receive Telegram   notifications? Are you looking for a simple way to share trade signals with your followers? Do you need to start documenting your trades with an automated trading diary? Check out this step-by-step   Tutorial . This utility is simple to use and supports a wide variety of settings: Pick your desired Telegram   group
MT4 Version Order Blocks Zone Scalper is dedicated to all people who like order blocks trading but do not have the time to stare at the charts every day or the discipline to follow a trading strategy. It is also for everyone who likes to experiment and optimize parameters on their own. If you belong to this type of person, it is your lucky day, as I decided to keep all EA parameters available to you so that you can optimize the EA to your own taste. To understand how this EA works, come read my
Structure Breakout EA MT5
Diego Arribas Lopez
5 (1)
[ MT4 Version ] Structure Breakout  EA MT5 Structure Breakout EA is an Expert Advisor inspired by structure breakout trading. It seeks to capture the explosive movements that follow a period of consolidation. It allows the user to adapt the EA to trend breakouts automatically recognized by the robot or to price structure breakouts. It is also highly customizable, which allows it to be easily adapted to different pairs, timeframes and risk profiles. It is independent of market sessions. The numbe
Order Blocks ICT Multi TF MT4
Diego Arribas Lopez
5 (2)
[ MT5 Version ]  [ Kill Zones ]  [ SMT Divergences ] How to trade using Order Blocks:  Click here User Interface Performance:  During testing in the strategy tester, the UI may experience lag. Rest assured, this issue is specific to the testing environment and does not affect the indicator's performance in live trading. Elevate your trading strategy with the  Order Blocks ICT Multi TF  indicator, a cutting-edge tool designed to enhance your trading decisions through advanced order block anal
MT5 Version Elliot Wave Oscillator MT4 Elliot Wave Oscillator MT4 is an indicator designed to support Elliot Wave counts. The default settings help filtering out the noise in the market allowing a clear perception for the waves counts in differnt timeframes.   Elliot Wave Oscillator high customization level allows the you to optimize this indicator to your personal preferences. Shorter Periods and faster reactive MAs will provide more infomation but will require a higher level of experience for
Lumos
Diego Arribas Lopez
Lumos Lumos is a multifunctional trading assistant. It gives an overview of the current market situation for a better decision making. The strategy tester only provides a visualization of the application. Lumos is highly customizable and gives you information in multiple timeframes about: MAs, price structure, RSI, RSI MA and an overview of the price distance to possible SLs.
FREE
[ How to use the Demo version ]  [ MT5 Version ]  AO unpaid divergences MT4 AO unpaid divergences is the first indicator developed to detailed analyze Regular and Hidden Divergences. It uses this analysis to find out possible entry points and targets. Below some of the characteristics of this indicator:  Time saving Highly customizable Working for all pairs (Crypto, Forex, Stocks, Indices, Commodities...) Suitable for Scalping or Swing trading Possible reversal swings Alerts and Notifications on
Fear and Greed MT4
Diego Arribas Lopez
[ MT5 Version ] How to trade using the Fear and Greed Indicator:  Click here Uncertain about when to take total or partial profits? The Fear and Greed is your reliable companion for making confident trading decisions. This innovative tool offers unparalleled insights into market sentiment, helping you identify key pivot zones and optimize your trading strategy. Why Choose Fear and Greed? Revolutionary Market Insight: Sentiment Analysis: The first indicator for that reveals the market's Fear and
MT5 Version TTM Squeeze Momentum TTM Squeeze Momentum is an enhanced indicator ideal for recognizing consolidation periods in the market and the start of the next explosive move. This improved version is a volatility indicator based on John Carter's "TTM Squeeze" in which the histogram is based on a linear regression rather than a simple momentum indicator. Red dots on the middle line indicate that the market has entered a "Squeeze" zone or consolidation period, indicated in this enhanced vers
Gaussian Channel MT4
Diego Arribas Lopez
5 (1)
MT5 Version Gaussian Channel MT4 Gaussian Channel MT4 is the first indicator in the market that uses Ehlers Gaussian Filter methods to define trends. Nowadays, this Gaussian Channel is highly known as a method to support HOLD techniques in crypto. If the price is above the channel the trend is strong, if it comes back to the channel this can react as a resistance and indicate the beginning of a bear market (or Winter) if the price breaks below it. Eventhough the use of this channel focuses on
Williams Vix Fix MT4
Diego Arribas Lopez
MT5 Version Williams Vix Fix MT4 Need help trying to time the bottoms in the market? Williams Vix Fix MT4 is based on the volatility of the market and grants a huge support for finding out when a correction is comming to its end. TRY IT FOR FREE NOW! Williams Vix Fix MT4 derivates from Larry Williams's VixFix indicator addapted for fitting   every asset class . VIX reprensents the fear and greed in the market based on its volatility. A high VIX value shows fear in the market, this is usually a
Wave Trend MT4
Diego Arribas Lopez
MT5 Version   Wave Trend MT4 Wave Trend is an oscillator, which helps identifing in a extremely accurate manner market reversals. The Oscillator being obove the overbought level and a cross down of the fast into the slow MA usually indicates a good SELL signal. If the oscillators is below the oversold level and the fast MA crosses over the slower MA usually highlights a good BUY signal. The Wave Trend indicator can be also used when divergences appear against the price, indicating the current mo
Multi Timeframe MA MT4
Diego Arribas Lopez
MT5 Version Multi Timeframe MA MT4 Multi Timeframe MA MT4 is an indicator that offers the representation of up to 3 MAs with different Periods and Timeframes. This allows the user to reprensent in one chart and timeframe information coming from other timeframes and get notified as any of the MAs crosses another one. Multi Timeframe MA is the   first   indicator in the market that offers Multi Timeframe interactions and a high customization   level from up to 7 different MA types (SMA, EMA, WMA,
[ MT5 Version ] Structure Breakout  EA MT4 Structure Breakout EA is an Expert Advisor inspired by structure breakout trading. It seeks to capture the explosive movements that follow a period of consolidation. It allows the user to adapt the EA to trend breakouts automatically recognized by the robot or to price structure breakouts. It is also highly customizable, which allows it to be easily adapted to different pairs, timeframes and risk profiles. It is independent of market sessions. The numbe
[ MT5 Version ] Advanced Bollinger Bands RSI EA MT4 Advanced Bollinger Bands RSI EA is an Expert Advisor based on the worldwide known strategy BB & RSI. This strategy uses the Bollinger Bands indicator in combination with the RSI, the signal triggers only when both the BB and the RSI indicate at the same time overbought or oversold conditions. Both indicators make a great combination to anticipate big explosive moves. Advanced Bollinger Bands RSI EA grants the user the posibity to use 3 differen
[ MT5 Version ] [ EA ] Advanced Bollinger Bands RSI MT4 Advanced Bollinger Bands RSI is an Indicator based on the functionalities of the  Advanced Bollinger Bands RSI EA . The scope of this indicator is to provide a more affordable solution for users interested in the alerts coming out of the strategy but not in Autotrading. This strategy uses the Bollinger Bands indicator in combination with the RSI, the signal triggers only when both the BB and the RSI indicate at the same time overbought or
[ MT5 Version ] Supply and Demand Multitimeframe Supply and Demand Multitimeframe is the first indicator in the market that combines multiple aspects like trading volume, price structure and momentum to identify Supply and Demand zones for every asset. The Supply and Demand indicator analyzes simultaneously up to 4 different TFs and represents their information in the current graph. Its interactive UI highlights everytime the price enters a Supply or Demand zone even if the zones are not visib
[ MT5 Version ] Bulls and Bears Power Bulls and Bears Power is an indicator that clearly highlights if bulls or bears are currently in control of the market. A price movement started with high Bulls control in the market can indicate the beginning of a new trend movement. The relative indicator power between price peaks also indicates if the movement is losing strength and might foresee a significant correction or a trend reversal. Bulls and Bears Power indicator offers a clear and simplified vi
[ MT5 Version ] Ultimate Alpha Trend MT4 Ultimate Alpha Trend is the first trend indicator, which combines volatility, volume, average price and momentum. The results is a highly versatile representation of trendy and sideways market conditions, highlighting, at the same time, significant supply and demand levels. The Ultimate Alpha Trend indicator can be used to find entry oportunities and to set SLs taking into consideration current market volatility, volume and momentum. Besides that, the in
筛选:
无评论
回复评论
版本 1.30 2023.04.19
1.Versioning update
版本 1.20 2023.03.26
1. Alert text modified
版本 1.10 2023.03.26
1. Improved alerts system