Crazy Color Cloud
- 指标
- Igor Gerasimov
- 版本: 2.2
- 更新: 10 四月 2023
- 激活: 5
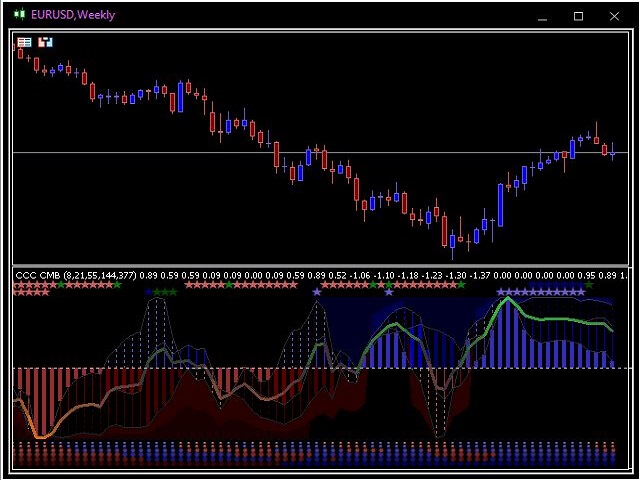
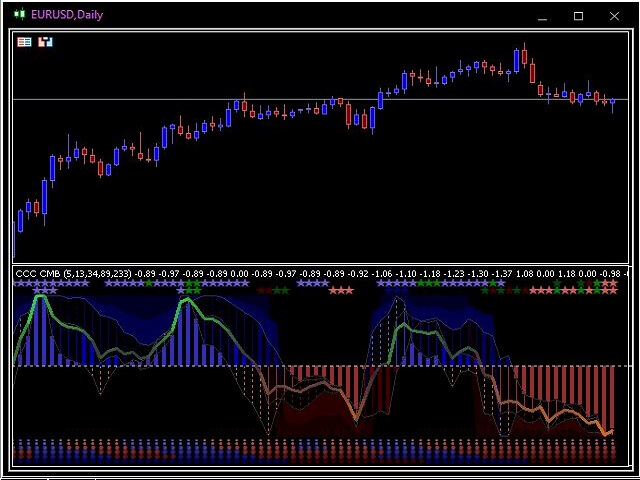
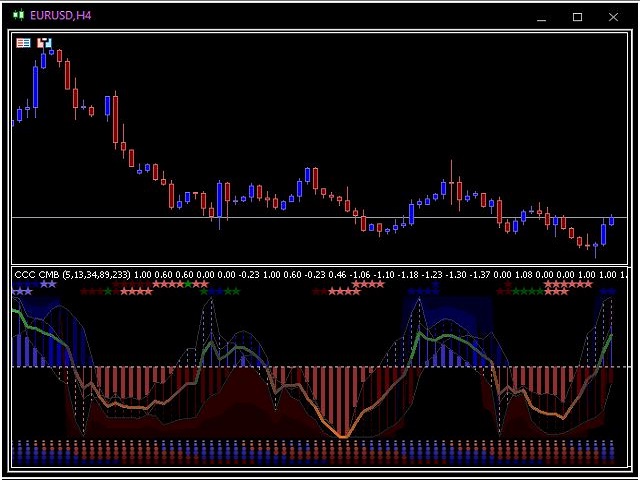
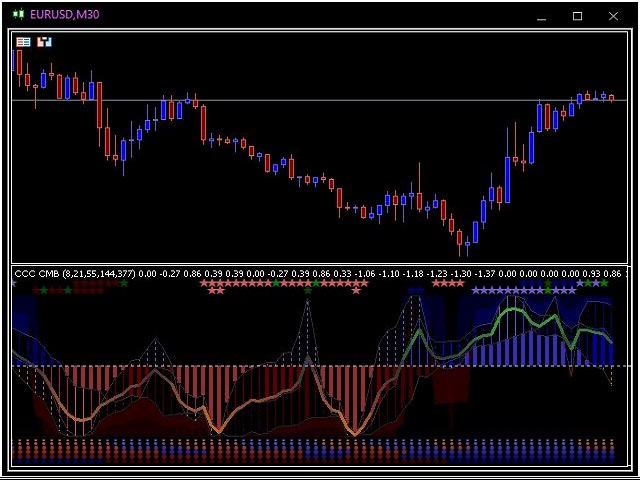
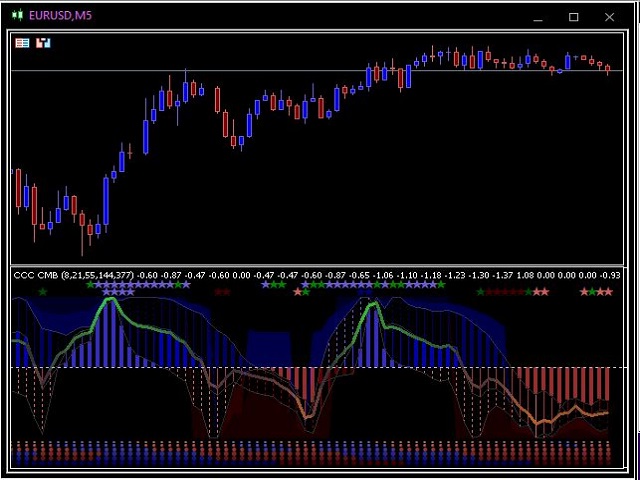
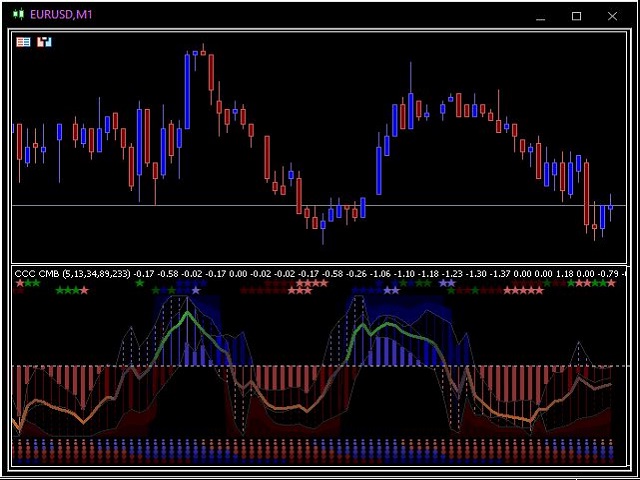
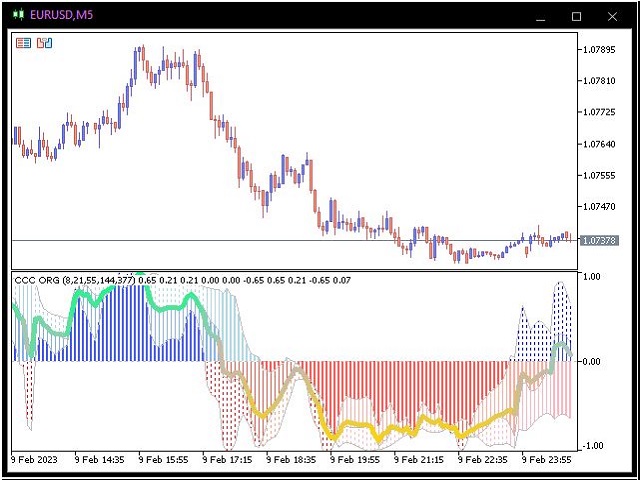
該指標顯示過濾後的價格信息
以三種顏色的直方圖和一種常見的顏色線的形式。
這是一個非常豐富多彩和漂亮的指標。
非常適合確定價格變動的強度和方向。
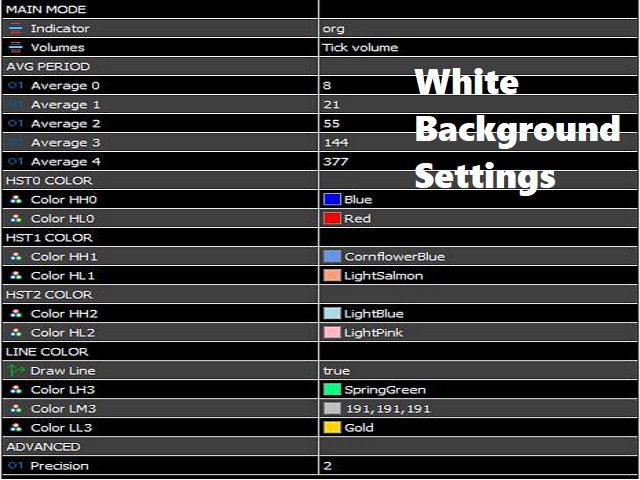
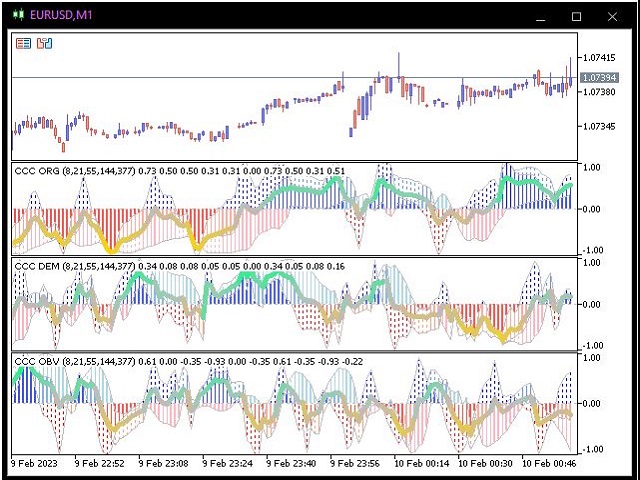
該指標具有非常簡單的設置:
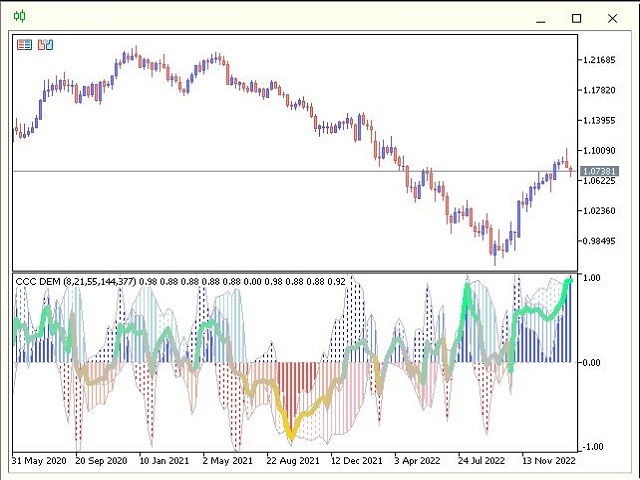
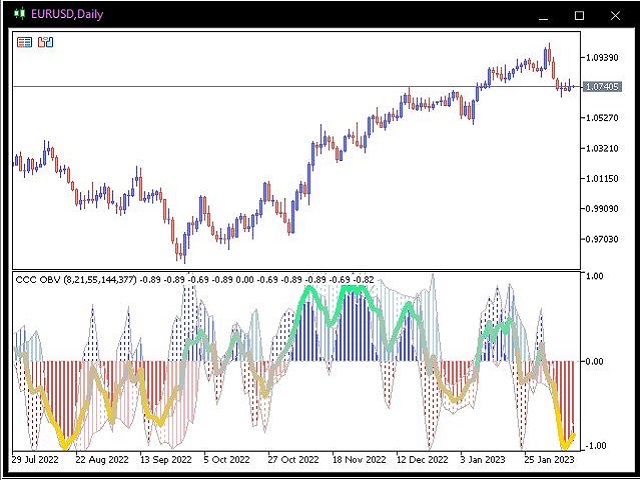
1) 計算指標的三個選項的選擇:
- 原來的,
- 去標記,
- 平衡音量。
2)五個不同時期的選擇。
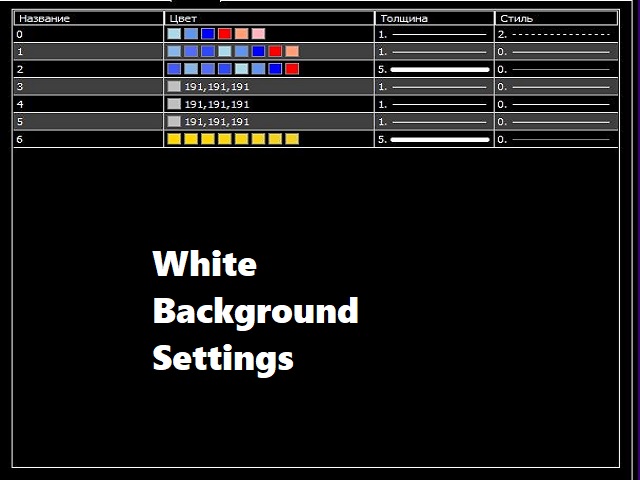
3)顯示顏色的選擇。
4)精度的選擇。
///////////////////////////////////////////////////////////////////
///////////////////////////////////////////////////////////////////
我希望這個指標對您成功交易非常有用。
祝你好運。