Twin Range Filter by colinmck MT4
- 指标
- Yashar Seyyedin
- 版本: 1.50
- 更新: 29 五月 2023
- 激活: 5
To get access to MT5 version please click here.
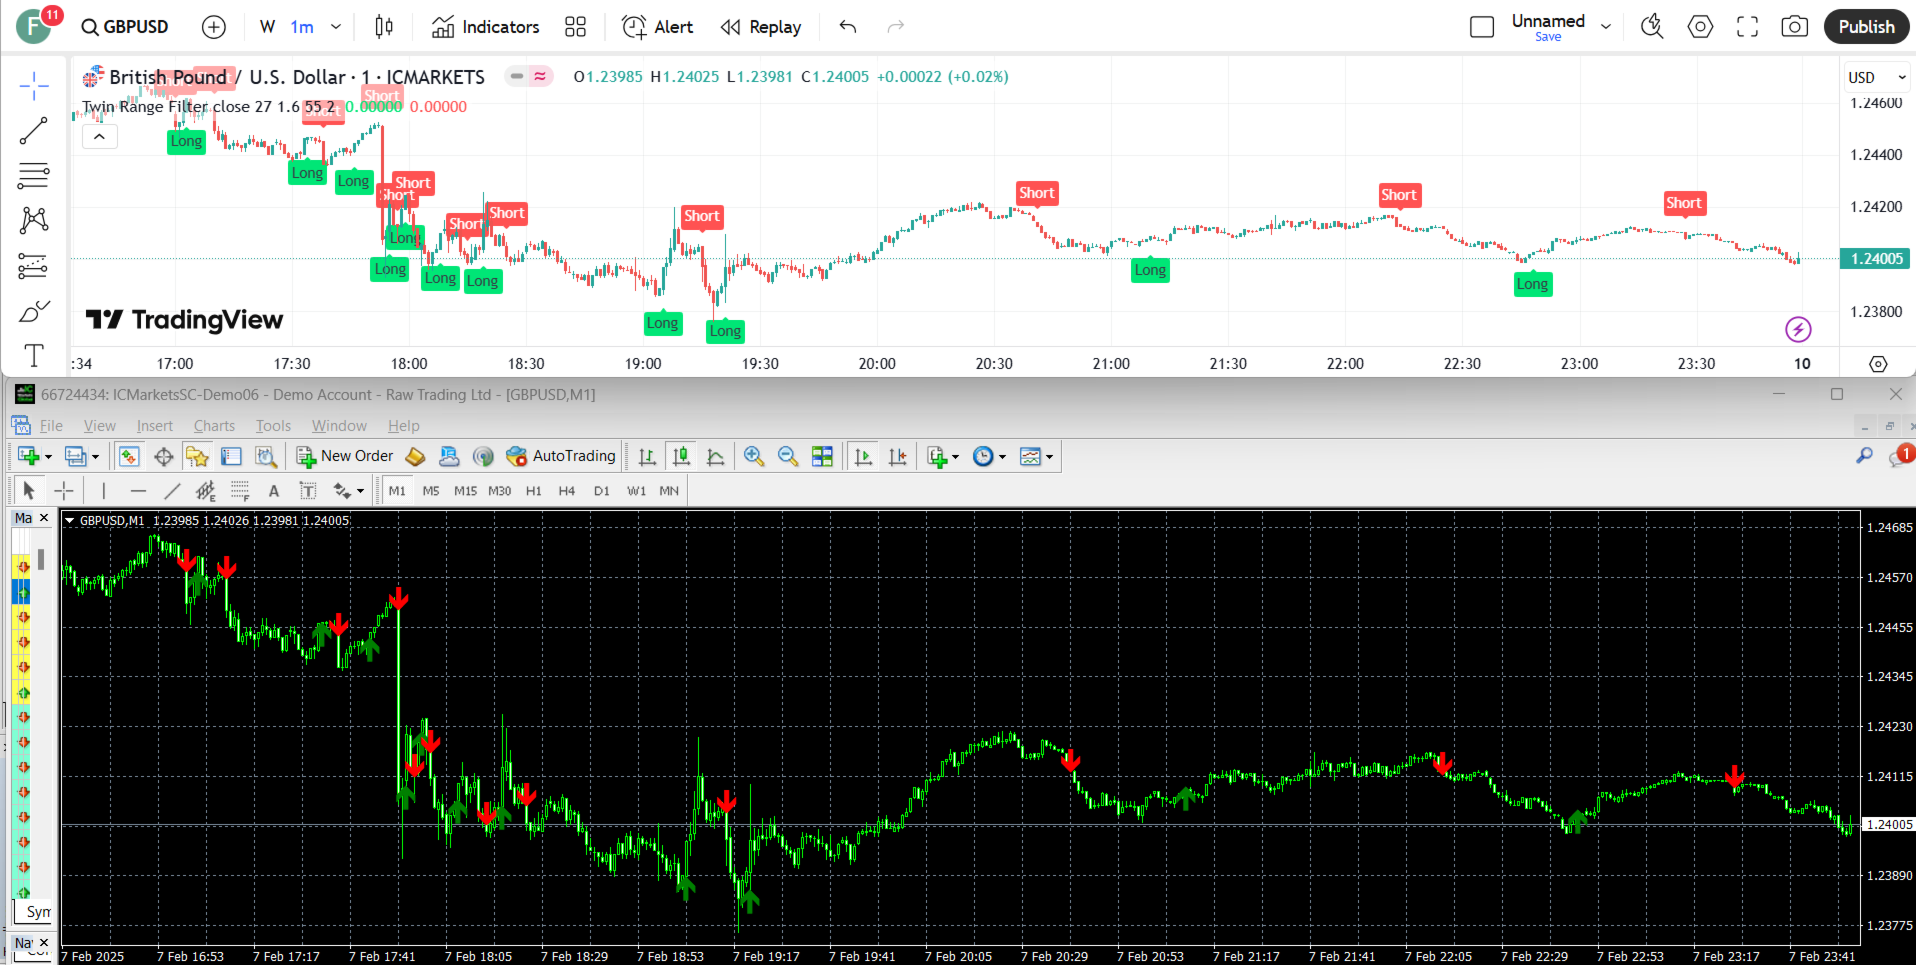
- This is the exact conversion from TradingView: "Twin Range Filter" by "colinmck".- The screenshot shows similar results from tradingview and Metatrader when tested on ICMarkets on both platforms.
- This is a light-load processing and non-repaint indicator.
- All input options are available.
- Buffers are available for processing in EAs.
- You can message in private chat for further changes you need.
Here is the sample code of EA that operates based on signals coming from indicator:
#property strict

input string EA_Setting="";
input int magic_number=1234;
input double fixed_lot_size=0.01; // select fixed lot size

input string    TWR_Setting="";
input ENUM_APPLIED_PRICE src = PRICE_CLOSE; //Source
input int per1 = 27; //Fast period
input double mult1 = 1.6; //Fast range
input int per2 = 55; //Slow period
input double mult2 = 2; //Slow range
input bool showAlerts=true; //use Alerts

void OnTick()
  {
      if(!isNewBar()) return;

      bool buy_condition=true;
      buy_condition &= (BuyCount()==0);
      buy_condition &= (IsTWRBuy(1));
      if(buy_condition)
      {
         CloseSell();
         Buy();
      }

      bool sell_condition=true;
      sell_condition &= (SellCount()==0);
      sell_condition &= (IsTWRSell(1));
      if(sell_condition)
      {
         CloseBuy();
         Sell();
      }
  }

bool IsTWRBuy(int index)
{
   double value_buy=iCustom(_Symbol, PERIOD_CURRENT,
    "Market\\Twin Range Filter by colinmck MT4",
    src, per1, mult1, per2, mult2, showAlerts, 12, index);
   return value_buy!=EMPTY_VALUE;
}

bool IsTWRSell(int index)
{
   double value_sell=iCustom(_Symbol, PERIOD_CURRENT,
    "Market\\Twin Range Filter by colinmck MT4",
    src, per1, mult1, per2, mult2, showAlerts, 13, index);
   return value_sell!=EMPTY_VALUE;
}

int BuyCount()
{
   int counter=0;
   for(int i=0;i<OrdersTotal();i++)
   {
      if(OrderSelect(i, SELECT_BY_POS)==false) continue;
      if(OrderSymbol()!=_Symbol) continue;
      if(OrderMagicNumber()!=magic_number) continue;
      if(OrderType()==OP_BUY) counter++;
   }
   return counter;
}

int SellCount()
{
   int counter=0;
   for(int i=0;i<OrdersTotal();i++)
   {
      if(OrderSelect(i, SELECT_BY_POS)==false) continue;
      if(OrderSymbol()!=_Symbol) continue;
      if(OrderMagicNumber()!=magic_number) continue;
      if(OrderType()==OP_SELL) counter++;
   }
   return counter;
}

void Buy()
{
   if(OrderSend(_Symbol, OP_BUY, fixed_lot_size, Ask, 3, 0, 0, NULL, magic_number, 0, clrNONE)==-1)
   {
      Print("Error Executing Order: ", GetLastError());
      //ExpertRemove();
   }
}

void Sell()
{
   if(OrderSend(_Symbol, OP_SELL, fixed_lot_size, Bid, 3, 0, 0, NULL, magic_number, 0, clrNONE)==-1)
   {
      Print("Error Executing Order: ", GetLastError());
      //ExpertRemove();
   }
}

void CloseBuy()
{
   for(int i=OrdersTotal()-1;i>=0;i--)
   {
      if(OrderSelect(i, SELECT_BY_POS)==false) continue;
      if(OrderSymbol()!=_Symbol) continue;
      if(OrderMagicNumber()!=magic_number) continue;
      if(OrderType()==OP_BUY)
         if(OrderClose(OrderTicket(), OrderLots(), Bid, 3, clrNONE)==false)
         {
            Print("Error Closing Position: ", GetLastError());
         }
   }
}

void CloseSell()
{
   for(int i=OrdersTotal()-1;i>=0;i--)
   {
      if(OrderSelect(i, SELECT_BY_POS)==false) continue;
      if(OrderSymbol()!=_Symbol) continue;
      if(OrderMagicNumber()!=magic_number) continue;
      if(OrderType()==OP_SELL)
         if(OrderClose(OrderTicket(), OrderLots(), Ask, 3, clrNONE)==false)
         {
            Print("Error Closing Position: ", GetLastError());
         }
   }
}

datetime timer=NULL;
bool isNewBar()
{
   datetime candle_start_time= (int)(TimeCurrent()/(PeriodSeconds()))*PeriodSeconds();
   if(timer==NULL) {}
   else if(timer==candle_start_time) return false;
   timer=candle_start_time;
   return true;
}

waiting for you to export it as EA, I am used to trading with this indicator, and I love it