• 概述
  • 评论
  • 评论
  • 新特性

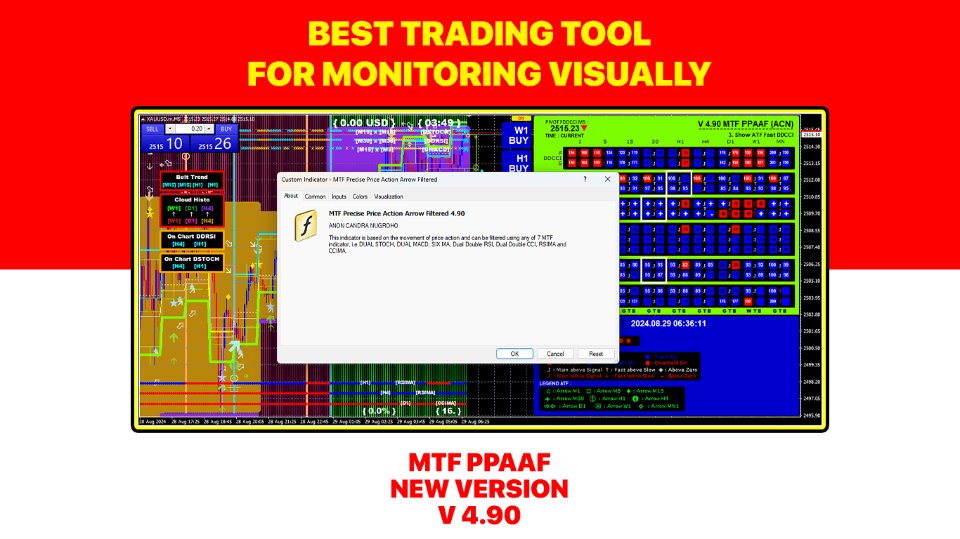
MTF Precise Price Action Arrow Filtered

如果您经常因为只使用一种指标而亏损交易,那么请尝试此交易工具。 该交易工具使用多个指标。 我经常观察只使用 RSI 指标的交易者。 很多时候,市场超卖但仍然下跌,或者市场超买但仍然上涨。 因此,您需要使用多个指标。 隆重推出新版本 V 3.40 MTF PPAAF:多时间框架精确价格行为箭头过滤。 该交易工具使用各种指标来加强市场走势的方向。

该交易工具中使用的第一个指标是双随机指标。 在这里,我使用两种随机指标,即快速随机指标和慢速随机指标。 在快速随机指标中,有一条快速随机指标主线和一条快速随机指标信号线。 同样,在慢随机指标中,有一条慢随机指标主线和一条慢随机指标信号线。 主线和信号线的交叉/交叉将形成向上和向下箭头。

第二个指标是Double RSI,即快速RSI和慢速RSI。 两者相交将形成一个向上和向下的箭头。

第三个指标是Double CCI,即快速CCI和慢速CCI。 两者相交将形成一个向上和向下的箭头。

第四个指标是双MACD。 与双随机指标类似,这里有快速 MACD 和慢速 MACD。 在快速 MACD 中,有一条快速 MACD 主线和一条快速 MACD 信号线。 同样,慢速 MACD 也有慢速 MACD 主线和慢速 MACD 信号线。 主线和信号线的交叉点将形成向上和向下的箭头。

第五个指标是RSIMA。 顾名思义,这里的向上和向下箭头由 RSI 线与移动平均线 (MA) 的交点确定。 如果 RSI > MA,则箭头向上,反之亦然。

第六个指标是四个MA。 这里我使用了四根移动平均线,即MA 1、2、3、4。 MA 1 线与 MA 2 线以及 MA 3 线与 MA 4 的交点将形成向上和向下箭头。

根据我的研究结果,许多交易者因为只使用一种指标而遭受损失。 这就是我创建这个交易工具的原因。 我上面解释的六个指标将加强市场走势的方向。

然后,为了实时查看市场走势,我添加了各种 TOP 功能:

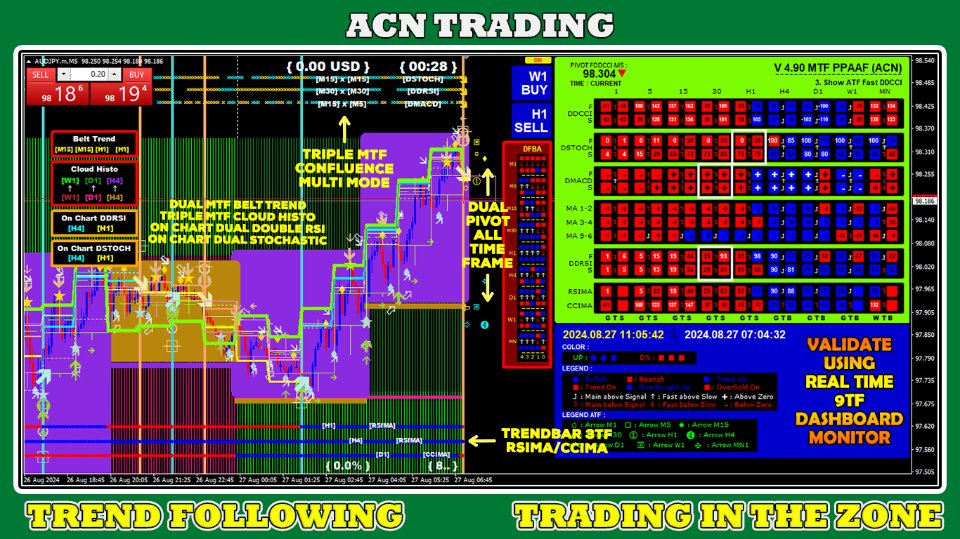
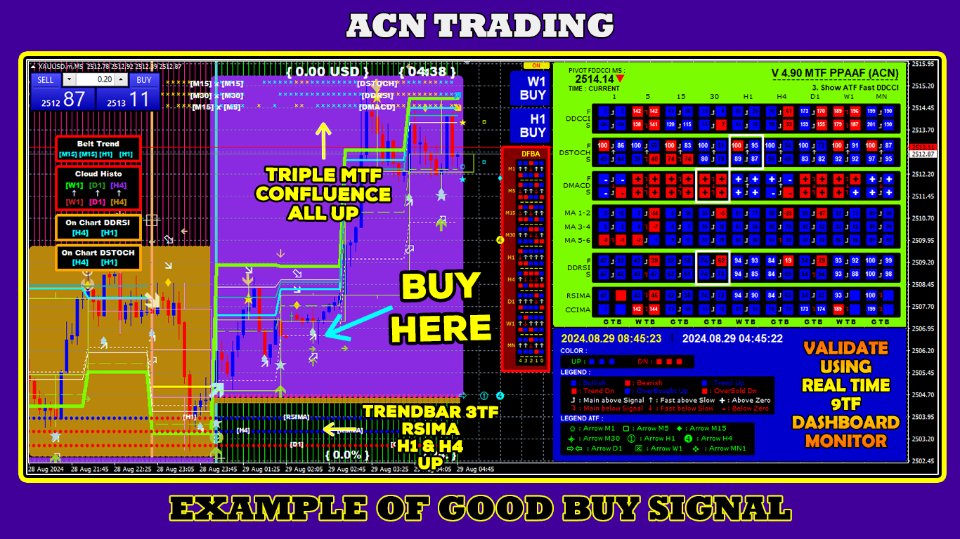
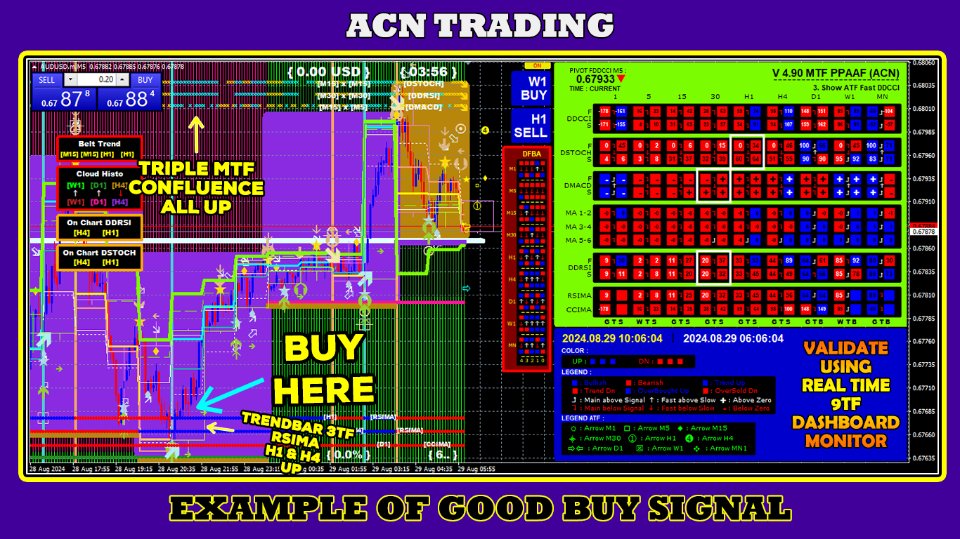
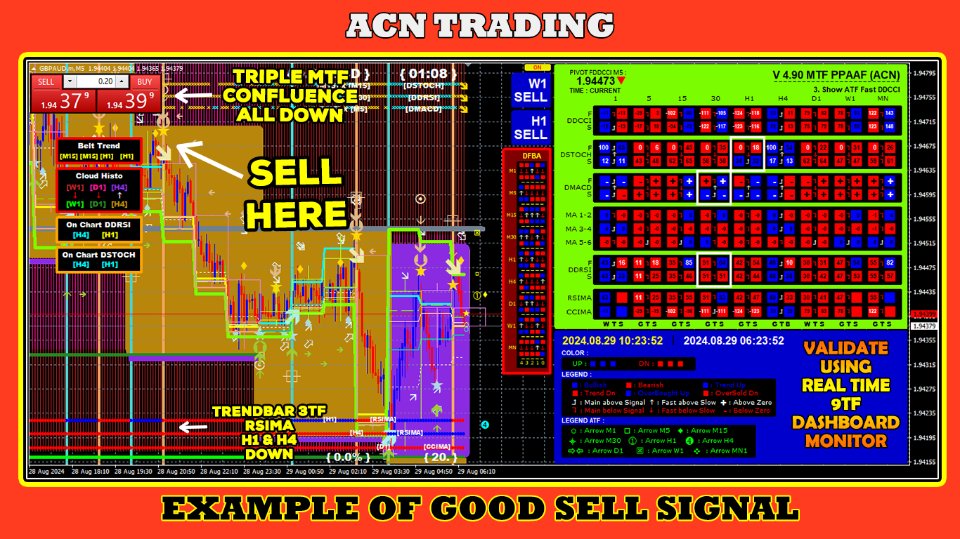
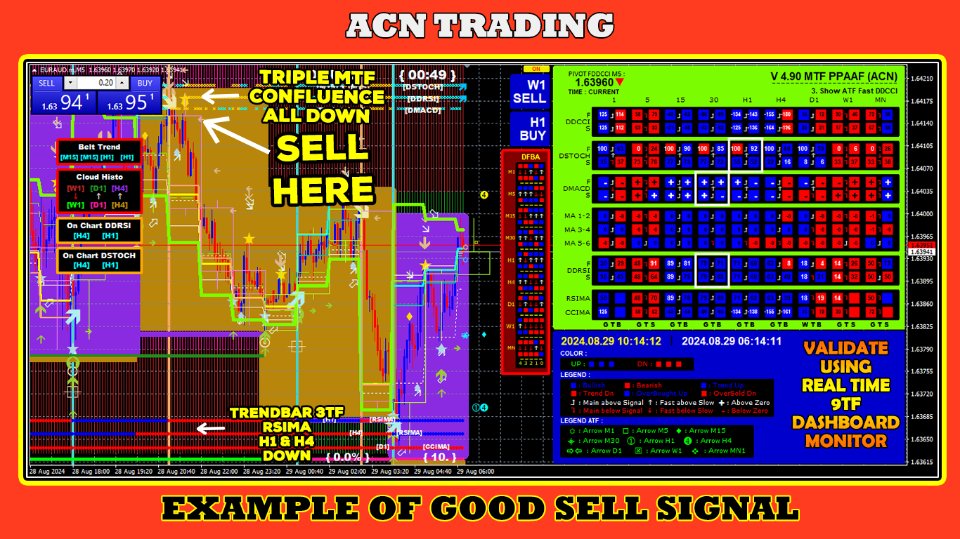
1. 实时9TF仪表板监控。 通过此功能,您将实时看到从 1 分钟时间范围到 MN1 时间范围的市场走势。 在仪表板中,您将能够看到主线是否大于信号线、快速 RSI 线是否大于慢速 RSI 线、RSI 线是否全部向上等。 还可以查看随机指标、RSI 和 CCI 水平是否超买或超卖。 了解 OBOS(超买超卖)水平非常重要。

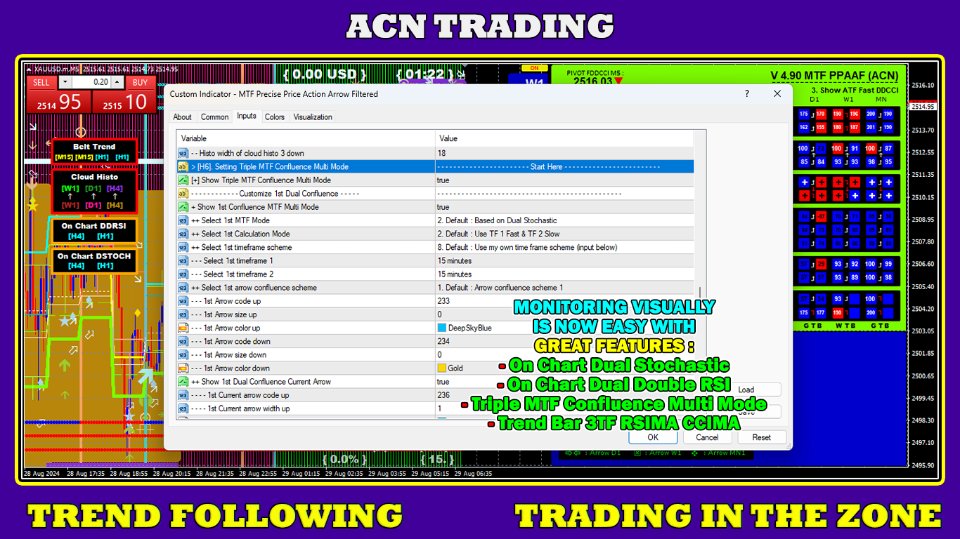
2.关于图表功能。 目视监控很重要。 因此,我添加了图表上的双随机指标、图表上的四 MA、图表上的双 RSI 和图表上的真实 RSIMA 功能。 供您参考,将随机指标放在图表窗口中比将随机指标放在子窗口中更准确。 在图表窗口中实时观察主线和信号线的交叉点将使您自信地确定入场点和出场点。 我的原则是低买高卖。 请记住这个原则。

3. 该交易工具可以显示ATF(所有时间范围)交叉箭头:

- 显示ATF快速随机(模式1),即快速随机主线x快速随机信号线

- 显示ATF Fast MACD(模式2),即Fast MACD主线x Fast MACD信号线

- 显示ATF MA 1x2(模式3),即移动平均线1 x 移动平均线2

- 显示ATF DRSI(模式4),即Fast RSI x Slow RSI

- 显示ATF RSIMA(模式5),即RSI x MA

- 显示ATF DCCI(模式6),即快速CCI x 慢速CCI

- 显示ATF快速随机DRSI(模式7),即快速随机主线x快速随机信号线以及快速RSI x慢速RSI

- 在区域内交易(模式 8),即 MA 1 线与 MA 2 以及 MA 3 线与 MA 4 的交点。

4.超级趋势箭头(STA)。 STA计算模式有两种。 第一种是基于 RSI 和 MA 交叉的 STA。 其次是快速 RSI 与慢速 RSI 的交叉。

5. 趋势跟踪 STF(选定的时间范围)。 在这里您可以根据自己的意愿选择时间范围。 如果两条线相互交叉,则会出现一个箭头。 另外,如果两条线的角度均为正(向上)或全部为负(向下),则会出现趋势跟随箭头。

6. 9TF 趋势条功能基于 STA 模式 2。您可以观察五个趋势条。

最右边的趋势条是最新的实时趋势条(0)。 接下来是之前的趋势柱 (1,2,3,4)。 该趋势条对于观察从前一个时间范围到当前时间范围的市场趋势方向的变化非常有用。

7. 枢轴水平功能。 此功能将向您显示发生交叉的开盘蜡烛点水平。 枢轴水平 ac

不像S&R,即支撑和阻力。


8. 重播系统。 通过此功能,您可以回到过去,观察特定日期和时间 9TF 仪表板的状况。 假设您想分析为什么在 2023.10.11 14:21:30 市场会卖出。 要使用此功能,请在较短的时间范围(例如 M5)中打开您的 Meta Trader 4 图表。


9. 蜡烛 HTF(高时间框架)。 借助此功能,当您在较低时间范围内打开图表(我喜欢在 M5 处打开)时,您可以看到较高时间范围(例如 H1)中的市场走势。


10.TSPI(时间利差利润信息)。 通过此功能,您可以实时查看当前时间、点差、盈利/亏损以及盈利/亏损百分比。


11. 开/关按钮功能。 通过此功能,您只需单击一下即可显示或隐藏此交易工具。 有趣吧?


12. 20种仪表板配色方案可供选择。 通过此功能,您可以选择与图表颜色相匹配的仪表板颜色。


13.可定制参数。 计算指标时使用的所有参数都可以根据您的意愿进行调整。 您可以使用随机参数 14,3,3 或 5,3,3 等。或者您使用默认设置。


14. MTF,即多时间框架。 您可以根据自己的意愿设定时间范围。 例如,您想要在 M5 和 H1 时间范围上激活图表上的双随机功能。 你可以!


15. 不可重新绘制箭头 (NRPA)。 如果两条线在任何时候相交,就会出现交叉箭头。 很多时候,由于波动性很大,在接下来的几秒钟和几分钟内,两条线不会相交。 于是,之前出现的箭头就消失了。 这是一个非常重要的特征。 请记住,在高波动性期间,之前向上的箭头可能会变为向下。 先前出现的箭矢,可能会瞬间消失。 这就是为什么我的消息是使用实时 9TF 仪表板监视器进行验证!


16. 汇合3TF特征,即3TF快速随机汇合、3TF快速MACD汇合、3TF MA 1x2汇合和3TF DRSI汇合。 有了这个功能,观察 3TF(三时间框架)交叉点就变得非常容易。 这意味着,例如,如果时间范围(M5、M15、M30)内快速随机主线 > 快速随机信号线,则会出现向上箭头。


17. 汇合双随机指标和汇合双MACD。 利用此功能,如果在快速随机指标和慢速随机指标中存在主线 > 信号线,则出现向上箭头。 双 MACD 也是如此。 对于在同一时间范围内观察两个随机指标和两个 MACD 的交叉点来说,这是一个非常重要的功能。


18.潮流腰带功能。 除了在图表上显示两条移动平均线之外,还有此功能。 当然,您可以根据自己的意愿设定时间范围。


仅使用一种交易指标不太有说服力。 这就是为什么我们结合多个指标来加强对市场方向的分析。


然后可以使用 6 个指标中的任何一个来过滤价格走势:


RSIOMA

双 MACD(新版本 1.3!)

双随机指标(新版本 1.3!)

双 CCI(新版本 2.3!)

四移动平均线(新版本1.6!不仅仅是两移动平均线)

双 RSI(新版本 1.2!)

然后可以通过监控实时 9TF 仪表板来得出价格行为运动方向的强度。


9TF 仪表板监视器向我们显示四移动平均线、RSIMA、双 RSI、双 MACD、双随机和双 CCI 的实时数据。


一键按钮,显示或隐藏指示器

9TF实时仪表板监视器

监控 9TF 四个移动平均线,即 MA 1x2 和 MA 3x4

监控快速 MA 线是否高于或低于慢速 MA 线

监控快 MA 和慢 MA 的角度

监控 9TF 双 RSI,即快速 RSI 和慢速 RSI

监控快速 RSI 线是否高于或低于慢速 RSI 线

监控 9TF 双 MACD,即快速 MACD (MACD 1) 高于或低于慢速 MACD (MACD 2) 且向上或向下

监控主要 MACD 线是否高于或低于信号 MACD 线

监控 9TF 双随机指标,即快速随机指标(随机指标 1)高于或低于慢速随机指标(随机指标 2)且向上或向下

监控主要随机线是否高于或低于信号随机线

监控 9TF 双 CCI,即 OBOS 线上的位置和当前运动

监控 9TF RSIOMA,即 RSI 线高于或低于 MA 线

能够根据需要设置参数并选择时间范围

显示/隐藏图例的能力

能够增加/减少栏数,默认为 800 栏

能够选择多达 20 种仪表板配色方案

该指标可以显示您选择的时间范围内的 RSMA 箭头

该指标可以显示您选择的时间范围内的 MACD 箭头

该指标可以显示您选择的时间范围内的随机箭头

该指标可以显示您选择的时间范围内的 MA 1x2 和 MA 3x4 箭头

该指标可以显示您选择的时间范围内的双 RSI 箭头

该指标可以显示您选择的时间范围内的双 CCI 箭头

不可重画箭头

推荐产品
ROC acceleration-deceleration is the manual system for medium-term scalping. Indicator based on custom ROC system which defines bullish/bearish market and especially  acceleration-deceleration of tendention in the market's main direction. Buy arrow is plotted during bearish market when current trend decelerates and sell  arrow is plotted during bullish market when current trend decelerates. Main Indicator's Features Signals are not repaint,non-late or disappear(exept cases when system recalculat
Ultimate Hero MT4
Smart Forex Lab.
5 (1)
为实现最高性能而构建。针对利润提取进行了优化。 推出新选项 - 通过模拟利润提取进行测试。 Ultimate Hero 是一款先进的交易工具,旨在最大限度地提高您的外汇交易利润。这款先进的交易软件采用最新的 GPT-4 技术创建,具有多种先进功能。 Ultimate Hero 是一款使用基于马丁格尔系统的网格交易策略的交易机器人。它的设计目的是根据当时的市场情况进行多次交易,从而提供稳定的回报。 专家顾问使用网格交易方法,在不同价位下多个订单,围绕当前市场价格创建网格。通过这种方法,机器人可以不断进入市场,捕捉双向的潜在价格变动。 Ultimate Hero 使用马丁格尔交易系统来管理风险并确保盈利。该系统包括增加后续交易的规模,同时保持相同的盈利目标,从而最大限度地减少亏损交易的影响,最大限度地提高获胜交易的潜在利润。 交易专家使用先进的算法和市场分析工具来优化交易参数,并做出有效的交易决策。它不断进行实时监控和调整设置,使智能交易系统在任何市场条件下都能保持盈利。 总之,Ultimate Hero 是一款智能、高效的自动交易解决方案,对于初学者和经验丰富的交易者来说都是非常有价值
Trend New
Vitalii Zakharuk
Trend New Trend Indicator, shows the signals for entry. Displays both entry points and the trend itself. Shows statistically calculated moments for entering the market with arrows. When using the indicator, it is possible to optimally distribute the risk factor. Settings: Uses all one parameter for settings. Selecting a parameter, it is necessary to visually resemble it so that the appropriate graph has a projection of extremes. Options: Length - the number of bars for calculating the ind
Demand And Supply
Khurram Mustafa
1 (1)
Function Indicate Buy Sell Signals Indicate Strength of Buy Sell Signals This system is for both type of traders (Short & Long Term) Instead of Other Calculations, Parabolic Sar & Awesome are also used In Any time frame this can be use. What is in for Trader? Trading Switch:  Short Term & Long Term Finally, we all knows that Forex Trading needs completely concentrate & proper cash management, So I never promising that my program will never give you loss but I tried well to provide good and respo
FREE
Kilimanjaro EA
Botond Ratonyi
5 (1)
Check out my youtube channel about forex trading robots:  https://www.youtube.com/channel/UCL_p6fuQtNkg-1rRY69t5Ig Message me on telegram if you have any questions:  https://t.me/BRobotTrader H1 TIMEFRAME Updates and improvements(2021.08.12): USE THE SET FILES FROM THE COMMENT SECTION! This is the biggest update in the life of the KILIMANJARO EA, it got new features and NEW engine, plus many new parameters to optimize and play around with. ---It got the official TheNomadTrader
PTW NON REPAINT TRADING SYSTEM + HISTOGRAM Non-Repainting ,   Non-Redrawing   and   Non-Lagging  Trading System. Does the following: - Gives Accurate Entry and Exit Points - Scalping, Day and Swing Trading  - 95% Accuracy  - Targets, where to take profits. - Shows Trends, Support and resistance levels - Works on All Brokers - Works on All Currencies, CFDs and Stocks - It does not place trades for you, it only shows you what trades to place. - It works on All Timeframes - It is for Trend or ra
Boost binary option profesional
Sebastian Alejandro Merino Sepulveda
Binarias & Forex (+90% Ratio-Win Next Candle) Espere que el precio llegue a una buena zona (fuerte) sea soporte, resistencia, zona de oferta o demanda, fibonacci level key, cifra redonda. Haciendo lo anterior definitivamente habrá una reversión en el precio y obtendrá su ITM en primera vela dando una efectividad del 100% siguiendo la tendencia. Es muy importante estar atento a las noticias fundamentales en el mercado y estas no afecten tu trading. Sesiones comerciales: cualquiera (24 horas).
1.根据图表周期,确定趋势大小。在一段行情内最高价附近,为上涨趋势。在一段行情内最低价附近,为下跌趋势。 2. 趋势确立后,下一步就是确定短期趋势的超买和超卖。 超卖、多头;  超买,做空。   3.  根据超买和超卖以及利润点进行平仓。  实盘信号: https://www.mql5.com/zh/signals/1538661?source=Site+Signals+My EA 设置: 您需要把EA加载到要交易的货币对上(M15 时间范围) 现好的货币对: EURUSD,GBPUSD,GBPJPY,USDJPY,XAGUSD,GBPAUD 使用此EA,请是使用ECN账号。 可以使用我推荐的货币对,也可以使用其他货币对。 信号上100使用0.01手,建议使用更高的资金降低风险。 推荐杠杆 1:200 或更高 可以使用参数列表里内置的参数,也可以自定义参数。 参数设置: Applicable_Symbol - 表现最好的货币品种  cycle_time - 加载图表周期 Built_in_parameters - 选择内置的货币参数或选择自定义参数 Lot - 开单手数 AutoL
This system never paints.   This system created by using Envolpes bands and reverse bar count.   This indicator is only working in M5 period.   This system is for long term and profitable.   Signals are shown as arrows. as an optional limit orders.   You can set a voice alarm or email notification.   You can fins our other products from link : https://www.mql5.com/en/users/drbastem/seller   Also, you can ask all your questins from email : haskayafx@gmail.com or mobile : +90 530 867 5076 or @Meh
Mongol Indicator2
Sumiyabazar Buyanjargal
It's a variation of mid of HH and LL since it compares the higher of HH or LL against a period and twice the number of bars back to avoid whipsaws. I used to display this against lines on a chart, but made a histogram out of it and it looks interesting. It looks good at gauging trend strength and general turns (see image below). The name of the indicator is BAM, which is an acronym for "Below and Above Mid". Ways to use it: 1. To see general trend on longer TFs (more than 30 ba
This Expert Advisor has Three Trading Strategies: TRADING_STRATEGY_ONE - Intra Day / Short Term Trading Strategy. TRADING_STRATEGY_TWO - Mid Term / Long Term Trading Strategy. TRADING_STRATEGY_THREE - SMART__NEWS__TRADER - High Impact News Trading Strategy With 25 Years NFP History Trading in GBPUSD, EURUSD &  AUDUSD. NOTE: Default Settings Already Optimized For GBPUSD. Other symbols require optimization. Much and careful work has been done to package this E.A. all together. Having tested it w
Premium M15
Raphael Schwietering
Dear Investor, I am a full-time system developer since 2010, having developed thousands of trading systems in the last 11 years. My main goal when developing a strategy is long-term growth. All my systems have to pass strict criteria in terms of backtests, out-of-sample validations on unseen symbols, Monte Carlo simulations on different data feeds, slippage, and increased spreads.  It: Trades the EURUSD M15 with a focus on long-term growth. Opens trades at bar and uses no martingale nor any gri
This trading expert advisors is an clone & upgrade of  "EA Rough Duster ", also trades best on GBPNZD minute 5 timeframe. Maintains a constant account growth and runs best on low spread and commission based accounts. Uses Martingale & perfect hedging to recover unprofitable positions ensuring no loss. Its consistent profit curves,low DrawDowns & risk proves the record for itself in reliability and consistency plus its unique market analysis ensures quick extraction of profits by scalping the mar
The AlgoKing Lightning Bolt Strategy is a trade manager and has multiple indicators built for a complete trading strategy.  Here is a list of indicators built in. Indicators Auto drawn Support and Resistance signals Auto drawn RSI Divergence signals Auto drawn Fibonacci Retracement signals with buy and sell entry lines. Lightning Bolt reversal signals. Auto drawn trend lines. Trade Management Auto take partials at simple moving average targets. Auto take partial and stop losses at Fibonacci re
使用此交易工具,您可以同时扫描 15 个市场。 介绍新的交易指标 2024: ️ 仪表板多货币多时间框架随机。 我创建这个交易工具至少有两个原因: 首先,我厌倦了只观察一个市场。 其次,我不想失去进入另一个市场的时机。 这就是为什么我想同时了解其他市场状况。 因此,我需要一台可以同时扫描多个市场状况的扫描仪。 我经常寻找随机主线>(或<=)随机信号线从M1到H4(或只是M1到M30)的市场。 如果您同意我的分析,那么这就是您一直在寻找的交易指标。 不要错过市场状况满足上述要求的时刻。 这是一个随机扫描仪或仪表板,具有许多出色的功能: 可显示随机主线数据 可显示随机信号线数据 可以显示随机主线和信号线的位置(信号线上方主线或信号线下方主线) 可以显示随机主线和信号线的数据水平(看涨、看跌、趋势向上、趋势向下、超买但仍向上、超卖但仍向下) 可显示从M1到MN1的实时数据 可显示15种货币对的数据(多币种外汇/商品/加密货币/股票) 可定制参数 可定制颜色 OBOS 级别 漂亮的20仪表板配色方案 配备开/关货币对转换器 配备蜡烛高时间框架 配
Aura Eclipse MT4
Stanislav Tomilov
5 (4)
Aura Eclipse  is a fully automated EA designed to trade  currencies during evening and night hours .  It is based on machine learning deep neural network analysis and smart scalping  algorithms. The first multi-currency scalper uses deep machine learning mechanism - Keras. Its a deep learning API written in Python, running on top of the machine learning platform   Tensor Flow . It was developed with a focus on enabling fast experimentation.  Keras provides industry-strength performance and scala
Anemone
Sean Christian Hammond
使用人工智能 AI 创建,用于将生物体可见的行为模式纳入趋势分析。 混沌理论与移动平均线相遇。 滤食性海葵将其卷须伸入营养物质的海洋以丰富自身。 我不会用太长的描述浪费你的时间,这个概念在这些术语上是可以理解的。 它是一个可自定义的周期旋转移动平均线,可在简单、指数、加权和平滑之间切换,在您指定的时间输入上。 轮换是半混沌的,由市场本身注入的随机性。 当这些 MA 一个叠加在一起时,其效果就像海葵滤食一样,其卷须伸入环境........................................................................................................................................................................................................
Valentines
Victor Golovkov
Valentines trend is an easy-to-use indicator that hides a powerful calculation math-system "under the hood". Attach the indicator to the chart and set the parameters. Period - period for tracking changes in quotes Amount of Bars - number of last bars to track You do not need to select any numerical parameters. The indicator will do everything for you automatically . Each signal is generated on the current bar, and in order not to miss it, use the built-in alerts and notifications system . The in
The indicator scans for TD Combo signals in multiple timeframes for the all markets filtered and shows the results on Dashboard. Key Features Dashboard can be used for all markets It can scan for signals on MN1, W1, D1, H4, H1, M30, M15 ,M5, M1 timeframes Parameters UseMarketWatch: Set true to copy all symbols available in market watch MarketWatchCount : Set the number of symbols that you want to copy from the market watch list. CustomSymbols: Enter the custom symbols that you want to be availa
The EA uses scalping strategy at night, trading consists of three algorithms and each algorithm works in its own time interval. The EA uses many smart filters to adapt to almost any economic situation. Pending orders are used for the least slippage when trading scalping. The adviser is safe and does not require any settings from the user, just install it on the chart and you are ready. The EA sets a protective stop order, so the trader does not have to worry that the robot will allow significant
Implement
Vitalii Zakharuk
5 (1)
Implement analyzes market dynamics for pivot points. If you want to learn how to spot the correct reversals for consistently likely profitable trading, buy this indicator. Shows favorable moments of entering the market in stripes. Ready-made trading system. The principle of operation of the indicator is to automatically determine the current state of the market when placed on a chart, analyze historical data based on historical data and display instructions for further actions on the trader's
R Var 移动平均线指标是为顽固的趋势追随者设计的趋势跟踪指标。 它是股票交易者和商品交易者中非常流行的外汇交易指标,它的流行源于它能够向用户提供真正的赚钱信号。 该指标由放置在黄褐色线上的绿色和红色点组成。 绿点指向看涨信号,而红点表示看跌信号。 基本交易信号 买入信号:当指标的黄褐色线上的点变为绿色时,做多。 卖出信号:当指标的黄褐色线上的点变为红色时做空。 退出买入交易:如果在看涨趋势持续期间,指标的西耶娜线上出现红点,则关闭所有买入订单。 退出卖出交易:如果在看跌趋势持续期间,R Var 移动平均线指标的西耶纳线上显示绿点,则关闭所有卖出订单。 尖端 在使用 R Var 移动平均线指标时,利用适度的止损来防止错误信号。 将其用于各种交易方式,包括剥头皮交易和日间交易。 特征 平台:MetaTrader 4 货币对:任何 自定义选项:变量(periodAMA、nfast、nslow、G、dK、UseSound、SoundFile)、宽度和样式。 时间范围:1 分钟、5 分钟、15 分钟、30 分钟、1 小时、4 小时、1 天、1 周、1 个
I speak in Hungarian. Magyarul beszélek benne. Első felvétel. https://www.youtube.com/watch?v=FfqvT-i9TPk&feature=youtu.be (Első felvétel. https://www.youtube.com/watch?v=MapbQrJ0uPU&t=9s   Első felvétel. https://www.youtube.com/watch?v=i2id5O1KPrI Második felvétel. https://www.youtube.com/watch?v=Zp2i7QN-IMc Első felvétel. https://www.youtube.com/watch?v=h7UbTWiM-Lw Második felvétel. https://www.youtube.com/watch?v=y54q4Rasf2A&t=1s Harmadik felvétel. https://www.youtube.com/watch?v=13zYjso
E13 Acid Flux
Dariel Iserne Carrera
4 (1)
Based on a combination of indicators, E13 Acid Fulx is an excellent indicator for knowing when to buy or sell on any asset and temporaryity. The indicator myself I have used it as a tool for my analysis when trading Forex. It is a useful and easy-to-understand trend indicator.  If you combine it with your own analyses you will surely get a good result in your operation.
FREE
Wardtrade17
Ahmed Wardan Atik
5 (1)
Your feedback is very important , Please submit your review and contact me to get a settings for other pairs !! This Expert advisor is a very logical, it does not promise irrational wealth as in many advisors offered for sale, it gives an annual profit ranging from 10% to 42%, the expert advisor is intended to work only on one pair, which is the EURUSD Time frame H1 ,  and in only one day, which is Monday  . Just run the expert advisor on the EURUSD pair on Monday and earn a minimum of 10% As
MAs COMBO
Dora Nafwa Mwabini
该指标使用移动平均线的组合。   从一开始,您就能够确定一个非常简单但有利可图的策略模式(即使是新手交易者也不会错过)。 它带有已经为用户定义的输入参数。 尽管已经定义了参数,用户仍然可以仅根据自己的喜好或喜好更改颜色。 内置参数 - 因此您不必再担心更改移动平均参数。 你花的每一分钱都是值得的。 更新版本功能 1.在移动平均线交叉时发送警报 2. 均线交叉点买入或卖出提示 3.发送警报时,您将被告知下订单的价格(Ask or Bid) Gāi zhǐbiāo shǐyòng yídòng píngjūnxiàn de zǔhé.  Cóng yī kāishǐ, nín jiù nénggòu quèdìng yīgè fēicháng jiǎndān dàn yǒulì kě tú de cèlüè móshì (jíshǐ shì xīnshǒu jiāoyì zh 我希望你喜欢更新的版本。 请发表评论。
Strong bear MT4
Elham Bahramirad
亲爱的外汇交易者们, 介绍 Strong Bear :用尖端人工智能在外汇市场引领自动交易革命! "首次购买者享受 75%折扣 !" 不要错过这个绝佳的折扣机会! "我们很高兴向您介绍我们的新型自动交易机器人。这款先进的机器人确保您在交易过程中无压力,适合所有账户规模,起始投资仅需100美元。它与任何经纪商和账户无缝对接,安装简单,您可以轻松放松,并实现无忧的利润生成。" 我们的EA方法: "虽然我们无法透露具体策略,但我可以告诉您,我们的方法旨在识别指定货币中的每一个潜在机会。通过将人工智能与所有相关模式和技术技巧结合,并内置新闻事件的损失预防过滤器,我们的策略利用经过一年实盘账户测试的高盈利技术。这为您提供了一系列优质、无压力的交易,无需投入大量时间。" 主要特点: - 自动调整货币对(您只需在 EURGBP H1 上运行一次,它将自动在所有其他货币对上进行交易) - 在MetaTrader 4和MetaTrader 5平台上经过多年的严格测试。 - 在最佳交易机会方面具有卓越的能力。 - 不依赖经纪商 ,可以与所有经纪商兼容。 - 不依赖点差 ,最好使用原始
Valiant Strong Trend
Muhammed Emin Ugur
" Valiant Strong Trend " - Your Ultimate MT4 Signal Indicator Are you ready to elevate your trading game to new heights? Look no further than the "Valiant Strong Trend" MT4 signal indicator, your indispensable tool for navigating the complex world of financial markets. Key Features: Precise Trend Identification : "Valiant Strong Trend" employs advanced algorithms to accurately identify market trends, whether they are bullish or bearish. Say goodbye to guesswork and hello to informed trading deci
ZORRO 3 in 1
Vladimir Pokora
This robot combines three ways of trading and for all uses the same successful money management. All three ways of trading can be used simultaneously or separately. Auto search and trading SR levels and their breakout. News trading - at a specified time placed pending orders for BUY and SELL. Manual opening trades using buttons in the chart. For these your trades will use the same money management as for automated trading. Is recommended ECN broker with minimal spread and with minimal slip and
Cobra Throw
Aleksandr Valutsa
Recommendations, warnings, notes  -  https://www.mql5.com/ru/blogs/post/759146 Советник "Cobra Throw" - предназначен для быстрого разгона депозита на рынке Forex. Советник рисует уровни поддержки и сопротивления на основании данных одного из выбранных индикаторов - Moving Average, Bollinger_Band или Envelopes, и ждет когда цена пробьет одну из линий. Далее после пробития робот выставляет отложенный ордер с расчетом на отскок цены, от сильного ценового уровня.  Если цена отскакивает (это происхо
该产品的买家也购买
Gann Swing Structure
Kirill Borovskii
5 (1)
This indicator is based on the mathematics of the great trader W.D. Ganna. With its help, you can easily find strong levels by analyzing swings to find the optimal entry point. The indicator works on all instruments and all timeframes. The indicator is fully manual and has control buttons. All you need to do is press the NEW button, a segment will appear, which you can place on any movement, swing or even 1 candle that you want to analyze. By placing the segment, press the OK button. A grid (th
訂閱指標注意事項 此信號只支援電腦版MT4 不支援MT5、手機、平板 指標只顯示當日進場箭頭 非直播指標顯示歷史箭頭 (直播為展示用) 指標為交易輔助性質 非EA自動交易 無跟單功能 指標只標示進場位置 無出場(止盈)指示 進場止損點位設定30-50 PIPS 或是前高前低做為防守 止損不需拉太遠 紅色箭頭為多方進場訊號 綠色箭頭為空方進場訊號 撐阻力強度用箭頭大小表示 此指標適用於波段策略 不適合當沖策略盤整 多空反轉時不適用 指標載入後 右下角都會預設顯示盤整 載入指標一小時後 才會顯示多空 加入Youtube頻道會員 可參加每個月一次實體抽獎活動(台灣以外地區,獎品折現金用Paypal匯出) 每月抽獎時間為非農數據公布當週的週末盤勢分析(2100) 得獎者必須抽獎時在線上,逾期不候
Bomb Bank Signal
Igor Pereira Calil
5 (1)
炸彈銀行訊號:您對 MetaTrader 4 的信心指標 Bomb Bank Signal 是 MetaTrader 4 的一個強大指標,旨在識別金融市場中最相關的趨勢。如果您正在尋找一種能夠準確預測運動的工具,那麼炸彈庫就是您需要的盟友。 運作原理: 該指標結合了三種不同的方法——成交量分析、蠟燭收盤價和對稱趨勢——來偵測和發出買賣機會訊號。當炸彈銀行識別出買入機會時,它就像一顆「炸彈」;當它偵測到賣出訊號時,它就像一個「頭骨」。 為什麼炸彈銀行不一樣? 完全可靠性:炸彈庫訊號不會刪除訊號。訊號一旦發出,就會一直存在,確保您不會錯過任何機會。 極為準確:炸彈庫不會發出錯誤訊號。它會即時更新您的訊息,隨著市場的變化進行調整,但保持先前訊號的透明度。 即時更新:訊號被即時識別並在必要時更新,使您能夠快速響應市場變化。 最大化您的結果: 炸彈銀行訊號是識別趨勢持續走勢的理想選擇。例如,如果您已經做空並且指標在 M15 發出買入訊號,那麼現在就是平倉或部分下單的最佳時機,反之亦然。 此外,經過仔細分析,我們建議您遵循M30、H1和H4上的訊號,停損僅50點。這使
Market Swing Index MSI
Elias Mtwenge
5 (1)
Septermber OFFER 85% OFF next price for unlimited version will be 2500$. This is the only time you can get this institutional and professional indicator at this price for unlimited version. Don't dare to miss this. The tool I am about to introduce to you you can't compare it with other tools due to its strategy and accuracy level in predicting the next price directional movement. This tool is designed for serious traders who have decided to make a difference through trading. Be the next person t
Swing Master Indicator
Elias Mtwenge
5 (1)
Dear Traders this is my another tool called " Swing Master Indicator ". As the name above the indicator is designed to help you in swing trading by capturing the low and highs of the price. You may us this tool with any trading strategy and style from scalping to position trading. It is made for level of traders including newbies and advanced traders even prop-firms, hedge funds and banks to help them make sold market analysis. I create tools for serious traders who want to make a difference in
Gann Signal Scaner
Kirill Borovskii
This indicator is based on the Gann Signal indicator and acts as a market scanner. All you need to do is fill in the selected currency pairs in the settings and that’s it. Next, the indicator itself will view all these currency pairs and time frames from M5 to D1 simultaneously. When a new signal appears, the indicator will give you an Alert and also draw the letter N where this new signal will be.
Connect Indicator
Sukunthakan Ngernbamrung
Connect Indicator is a tool used for connecting indicators between the MQL market and MT4. The connected indicators are made by our group and can be used for other applications, such as sending messages to the Line application or Telegram application. If you have any questions, please don't hesitate to ask us to receive support. Function and indicator buffer Buffer one is the high price of the previous candle. Buffer two is the high price of the previous candle. Usage To connect indicators to fu
Al in one level
Kundan Kumar Srivastava
5 (1)
This indicator is collection of important dynamic support and resistance giving a trader crystal clear idea , where to sell and where to buy. it completely complements trend lines, support, resistance, and sideways market and allow a trader to make sustainable profits. The thickness of lines suggests its strengths, the thicker the dynamic line, the stronger is rejection or pullback allowing a trader to make multi-fold profit, as they can clearly see them. Introducing Your Ultimate Trading Edge
这是最赚钱的指标。它的表现非常出色。无论市场上有什么兴趣,你都能看到。 几乎在所有情况下,它都只会给你一个长期的市场观点,但不要被愚弄,以为它是受事件约束的。不是这样的。它能找到市场上最大的利益所在,并将其展示给你。别忘了,最大的资金(利益)每天都不会在市场上出现。这是您没有遇到过的情况。月租金可能会给您一到两个信号,仅此而已。但当我们谈论大资金时,他们就是这样行事的。 如果您想了解更多,请点击这里。 这是最赚钱的指标。它的表现非常出色。无论市场上有什么兴趣,你都能看到。 几乎在所有情况下,它都只会给你一个长期的市场观点,但不要被愚弄,以为它是受事件约束的。不是这样的。它能找到市场上最大的利益所在,并将其展示给你。别忘了,最大的资金(利益)每天都不会在市场上出现。这是您没有遇到过的情况。月租金可能会给您一到两个信号,仅此而已。但当我们谈论大资金时,他们就是这样行事的。 如果您想了解更多,请点击这里。
Moving pivot Average Fibonacci The  indicator compares the selected period with its counterpart from the previous period. The indicator determines the moving Fibonacci levels for the day or any time interval to assess the price movement range from the time average. The indicator helps predict the expected high or low for the day based on historical time data. The pivot line can be considered an average trend line and use it in a variety of trading strategies. If you have any question about t
NOTE: PRICE WILL RISE VERY SOON. DON'T SKIP THIS OFFER! Dear traders I am glad to introduce the " Market Swing Scanner Board" indicator to you. This indicator was made mainly to be used in combination with the Market Swing Index Indicator. You use the  "Market Swing Scanner Board"  indicator to scan for trading opportunities on the  Market Swing Index Indicator . This tool is designed for serious traders who have decided to make a difference through trading. Be the next person to witness this st
Robot Choppiness
Diego Mauricio Padilla Mendez
3 (2)
Choppines 機器人作為指標載入到 MT4 指標資料夾中 建議使用5分鐘的蠟燭計時,建議的機器人到期時間為5分鐘。 機器人可設定為向 MT2、MX2、PRICEPRO 平台發送訊號。要發送訊號,您必須使用我們要使用的平台的連接器程式。 若要在連接器上安裝,請執行下列程序(隨附映像描述 MT2 平台連接器的配置):  1.- 在 MT4 平台上載入任何貨幣對 2.- 將蠟燭放在 M5 時間上 3.- 載入或拖曳 Robot-Chopiness.ex4 檔案到螢幕上開啟的貨幣對。 4.- 將MT2 連接器(MX2,或PRICEPRO,一次一個)載入到螢幕上,設定檔名稱、訊號名稱、買入緩衝區(0)、賣出緩衝區(1),設定機器人到期時間= 5 分鐘。 5.- 將此配置保存在模板中,以便模板將其自動加載到您要使用的所有貨幣對中。 波動機器人也可以在場外交易市場工作,您現在可以使用我們的指標來操作綜合指數
Oni Scalper
Goh Cheng Wai
5 (2)
Dear Onis, This Indicator is used for   GBPUSD, US30 and GOLD on 1-Min Chart . For US30 , Depending on your broker, Minimum Lot Size will differ from 0.01 to 1.0 lots. My Current Account is trading at 1.0 lots at $1 per point . Please check with your Broker what's the Margin Required for your Minimum lot sizes before you trade on your Real account. I have Forward Tested the indicator for around 6 months before releasing it to the public. ( No Demo is available for the Indicator, Strategy
Automatic, live & interactive picture of all trendlines. Assign push, email and sound alerts to the lines of your choice and be informed about price rollback, breakout, rollback after breakout, number of rollbacks, line expiration by double breakout. Correct, drag or delete the lines and interactively tune the line system. https://youtu.be/EJUo9pYiHFA . Chart examples https: //www.mql5.com/en/users/efficientforex Price Interaction Events All events are effective immediately and only after on
The indicator displays the probable ( Support and resistance ) levels. The indicator draws horizontal and trend levels of support and resistance. The indicator settings: Trends - the mode for displaying trend lines or horizontal lines of support and resistance Yes - display trend lines only No - display horizontal lines only UseResource - use the resources built into the indicator. Yes - use the ZigZag indicator from the resources of the product. No - use a custom ZigZag indicator. HistoryBar -
The indicator of a Professional Trader is an arrow indicator for predicting the direction of price movement. I have been working on this indicator since 2014. You can use this indicator as your main indicator, use its entry signals, and use it as your only indicator to find entry points. About the product: Recommended TF [H4-D1-W1]   . The indicator predicts the direction of the next candle. Fits a variety of tools; Flexibility in settings for different instruments and intervals through the
THE GRAFF III
Antonin Skaryd
The [GRAFF] III manual trading system is based on multiple MetaTrader (MT4) indicators. Together, the entire PACK of GRAFF III indicators makes an advanced trading tool. The system consists of over 20 different custom-built indicators which have been carefully selected and tested in the long term to produce strong and efficient trading signals. The particular indicators are based on different mathematical formulas, so the entire system is calibrated to remove false signals from its own indicator
You can fins our other products from link : https://www.mql5.com/en/users/drbastem/seller   Also, you can ask all your questins from email : haskayafx@gmail.com or mobile : +90 530 867 5076 or @MehmetBastem    on telegram application This indicator is used to determine the trend. Standard Osma indicator is used. It has the indicator warning system: beep, e-mail and has three types of alerts, including messages to mobile phone. It shows the best performance on the chart of 5 minutes. When the
You can fins our other products from link : https://www.mql5.com/en/users/drbastem/seller   Also, you can ask all your questins from email : haskayafx@gmail.com or mobile : +90 530 867 5076 or @MehmetBastem    on telegram application This indicator is used to determine the trend. Standard Three Moving Average and ADX indicators are used. It has the indicator warning system (audio, e-mail) and three types of alerts, including messages to mobile phone. It shows the best performance on M5. When
This indicator is used to determine the trend. Standard Three Moving Average and ADX indicators are used. It has the indicator warning system (audio, e-mail) and three types of alerts, including messages to mobile phone. It shows the best performance on M5. When the trend value reaches the value set, the warning system is activated. This indicator works only with Forex symbols. Inputs SoundAlarm = true - Sound Alert Sendmail=true - Send an e-mail in case of a buy or sell signal Sendnotificatio
You can fins our other products from link : https://www.mql5.com/en/users/drbastem/seller   Also, you can ask all your questins from email : haskayafx@gmail.com or mobile : +90 530 867 5076 or @MehmetBastem    on telegram application This indicator is used to determine the trend. Standard MACD indicator is used. It has the indicator warning system: beep, e-mail and has three types of alerts, including messages to mobile phone. It shows the best performance on the chart of 5 minutes. When the
Smooth price for Monarch MT4
Konstantin Gruzdev
3.67 (3)
The Smooth Price technical indicator is used for plotting a smoothed line as close to the price of the financial instrument as possible, and serves to eliminate its noise components. The indicator is part of the Monarch trading system, but here it is presented as an independent technical analysis tool. The indicator is based on the cluster digital filter , which, unlike the ClusterSMA , is applied directly to the price time series. Smooth Price does not redraw (except the very last, zero bar) an
该指标提供了一种基于'回归通道工具'概念的强大市场分析方法。通过利用此工具,交易员可以在图表上对回归通道获得出色的控制,从而使他们能够做出更明智的交易决策。 '回归通道工具'是交易员工具箱中的一个强大工具。它旨在为价格趋势和潜在支撑和阻力水平提供有价值的见解。该工具特别适用于在趋势内部可视化修正波动,提供了对价格动态的综合视图。 以下是更详细地了解使用此指标的关键功能和优势: 通道水平和支撑/阻力: 该指标的主要优势之一是其能够生成作为动态支撑和阻力区域的通道水平。这些水平在确定潜在的入场和出场点方面至关重要,增强了交易策略的精确性。 修正波动水平: 通过启用修正波动水平,交易员可以在更大的趋势内识别潜在的修正。这个功能有助于识别回撤,并帮助交易员利用有利的价格波动。 直接控制: 该指标的控制面板允许无缝地操纵回归通道。交易员可以微调填充和射线选项等设置,提供符合其分析风格的通道定制视图。 更高时间框架分析: 为了获得更广泛的视角,该指标具有从更高时间框架加载数据的功能。这个功能可以帮助交易员评估不同时间尺度上的趋势和通道,促进对市场动态的更全面了解。 如何使用: 设置趋势线: 首先,
A simplistic indicator informing a user on RSI divergence by sending messages to mobile device and email. The indicator draws 2 vertical lines, marking two RSI extrema that formed the divergence. You get the alert, open the charts and make a decision. The indicator does not show past divergences, thus when you attach it to a chart for the first time you see nothing. Graphics and alerts will appear as soon as divergences do. Drop it in Tester to see how it works. Parameters: RSIPeriod - number of
Green Wall Arrows
Daniel Luchinger
1 (1)
The Name Green Wall : Arrows hits a lot of TP, by changing the idea of non using SL as something bad, but instead use Small TP and a lot of free Margin and Patience. Use micro TP and a lot of Free Margin with this indicator on Forex. It also can be used with Binary Options. This strategy is intended to be traded Manually. This Indicator runs on Open Bar, arrows will delete when price are against it. The only Indicator Parameter is Alerts true/false, all the rest is included inside the code. Arro
Golden Monowave
Ahmed Mohamed Ali
Golden Monowave is monowave indicator, the monowave theory is one of Elliott wave approach and one of most complicate and accurate method. Golden Monowave can shortcut many major steps to identify and describe the monowave. It works on any timeframe and with any trading instrument, including currencies, indices, futures, etc. Input Parameters initial_Bars - set the initial number of bars to calculate. wave_color - select the color of the wave. label_color - select the color of labels. temp_lab
Ticks Size
Viktor Kolmakov
This indicator displays in a separate window the difference between the number of points which increased the price, and the number of points that decreased the price during the time interval specified in the settings. The time interval for calculation is expressed as the number of bars of the chart the indicator is attached to. This approach allows you to evaluate the movement direction (growth or fall) of the instrument's price, the strength of the movement and the size of the movement in point
NostradamusMT4
Andrey Spiridonov
1 (1)
NostradamusMT4 is a powerful indicator from the set of professional trader. The indicator is based on Andrei Spiridonov's original price calculation method (ESTIMATED PRICE) for the current candle price. Advantages The indicator does not redraw. It works on any timeframes. Works with any trading instruments. Perfectly suitable for scalping and trading binary options. Parameters Color - color of the ESTIMATED PRICE FUTURE line. How to work with the indicator The indicator forms the ESTIMATE
BinaryIndicator
Andrey Spiridonov
BinaryIndicator is a highly accurate indicator for trading binary options. It shows excellent results in scalping. This indicator is based in multifactor analysis of trend indicators, as well as confirmation oscillators, which in the end gives an increased accuracy of signals. Advantages of the indicator Increased accuracy of signals. Excellent results when trading binary options with a short expiration time from M30 to M1 . It works on any timeframes. Works with any trade symbols. Parameter
作者的更多信息
[V 1.00] MTF NRPA 5 移动平均 RTD 已发布! 非重绘箭头实时仪表板。 如果您正在寻找最好的移动平均线指标,那么您来对地方了。 通常人们会设置两条移动平均线,因为两条移动平均线的交点(交叉)将决定下一个价格趋势的方向。 如果快速移动平均线与慢速移动平均线相交且快 > 慢则趋势向上。 相反,如果快速移动平均线与慢速移动平均线相交且快 < 慢,则趋势向下。 两条均线的缺点是看不到长期趋势。 这就是我开发此交易工具的原因。 解释如下: 在这个交易工具中,我使用了五个移动平均线。 是的,五个! 默认情况下,我将 MA 1 和 MA 2 设置在较大的时间范围内,即 H1。 MA 1 和 MA 2 的交集意味着 H1 时间帧上有趋势变化。 然后 MA 3 和 MA 4 我在当前时间范围(小)上设置,例如,您在 M5 上打开图表。 MA 3 和 MA 4 的交叉点表示当前时间范围 (M5) 有趋势变化。 然后为了确认趋势运动,我在当前时间范围内设置了 MA 5。 这个交易工具有很多令人惊奇的东西: 您可以根据自己的喜好更改五个 MA 的时间范围。 您可以
在一个窗口中分析货币对的多个时间范围可能会让您感到困惑。 要分析多个时间范围,您需要可靠的指标。 其中之一是使用 9TF MACD 曲线。 我夜以继日地工作,以创建简单但可靠的代码,并在一个指标中涵盖所有九个时间范围。 让我们看一下该指标的一些优点: 彩色直方图。 每个时间范围内的曲线颜色各不相同。 指示 MACD 主线和信号线交叉的箭头。 (注意:忽略出现的最后一个箭头!) 临界水平线。 实时 9TF 仪表板监视器。 9TF 仪表板监视器计算非常准确,即使您从一个时间范围更改为另一个时间范围也是如此。 监控哪条曲线高于临界水平,哪条曲线低于临界水平。 监控曲线是否主要 MACD 高于信号 MACD,反之亦然。 监控曲线是否有主 MACD 和信号 MACD 之间的交叉。 监视当前信号与先前信号的移动。 在上升或下降的过程中。 (注意:这是剥头皮非常重要的功能!) 一个非常重要的趋势栏功能,用于发现长期趋势。 改变颜色的能力。 能够选择要显示的曲线。 能够选择要显示的直方图。 能够选择显示哪个箭头。 能够将 9TF 仪表板显示器放置在您想要的位置。 只需单击一下按钮
在一个窗口中分析货币对的多个时间范围可能会让您感到困惑。 要分析多个时间范围,您需要可靠的指标。 其中之一是使用 9TF STOCH RSI。 我夜以继日地工作,以创建简单但可靠的代码,并在一个指标中涵盖所有九个时间范围。 让我们看一下该指标的一些优点: 彩色直方图。 每个时间范围内的曲线颜色各不相同。 指示 STOCHASTIC 主线和信号线交叉的箭头。 (注意:忽略出现的最后一个箭头!) OBOS水平线。 实时 9TF 仪表板监视器。 9TF 仪表板监视器计算非常准确,即使您从一个时间范围更改为另一个时间范围也是如此。 监控哪条曲线高于超买水平,哪条曲线低于超卖水平。 监测主 STOCH 是否高于信号 STOCH 的曲线,反之亦然。 监控主 STOCH 和信号 STOCH 之间是否有交叉的曲线。 监视当前信号与先前信号的移动。 在上升或下降的过程中。 (注意:这是剥头皮非常重要的功能!) 监测 RSI 线的运动。 一个非常重要的趋势栏功能,用于发现长期趋势。 改变颜色的能力。 能够选择要显示的曲线。 能够选择要显示的直方图。 能够选择显示哪个箭头。 能够将 9
Analyzing multiple time frames of a currency pair in one window can make you confused. To analyze multiple time frames, you need reliable indicators. One of them is using 9TF RSI MA . I've been working day and night to create code that is simple but reliable and covers all nine time frames in just one indicator .  Let's look at some of the advantages of this indicator: Colorful histogram . The color of the curve in each timeframe is different from one another.  Arrows indicating the crossing of
Analyzing multiple time frames of a currency pair in one window can make you confused. To analyze multiple time frames, you need reliable indicators. One of them is using 9TF MACD Limited Bar . I've been working day and night to create code that is simple but reliable and covers all nine time frames in just one indicator .  Attention! When first installed, the indicator does not look intact. Changing the timeframe will solve the problem. Let's look at some of the advantages of this indicator: C
Analyzing multiple time frames of a currency pair in one window can make you confused. To analyze multiple time frames, you need reliable indicators. One of them is using 9TF STOCH RSI LIMITED BAR . I've been working day and night to create code that is simple but reliable and covers all nine time frames in just one indicator .  Attention! When first installed, the indicator does not look intact. Changing the timeframe will solve the problem. Let's look at some of the advantages of this indicat
在一个窗口中分析货币对的多个时间范围可能会让您感到困惑。 要分析多个时间范围,您需要可靠的指标。 其中之一是使用 9TF Double RSI Double MA。 我夜以继日地工作,以创建简单但可靠的代码,并在一个指标中涵盖所有九个时间范围。 让我们看一下该指标的一些优点: 双 RSI,即 RSI 更快和 RSI 更慢。 双 MA,即更快的 MA 和更慢的 MA。 10 配色方案。 每个时间范围内的曲线颜色各不相同。 RSI 的 OBOS 水平线。 实时 9TF 仪表板监视器。 9TF 仪表板监视器计算非常准确,即使您从一个时间范围更改为另一个时间范围也是如此。 监控哪条 RSI 曲线高于超买水平,哪条低于超卖水平。 监控曲线是否 MA 快线高于 MA 慢线,反之亦然。 监控曲线是否有 MA 快线和 MA 慢线之间的交叉。 监视当前信号与先前信号的移动。 在上升或下降的过程中。 (注意:这是剥头皮非常重要的功能!) 一个非常重要的趋势栏功能,用于发现长期趋势。 改变颜色的能力。 能够选择要显示的曲线。 能够仅显示 RSI、仅 MA、仅显示仪表板等。 能够将 9T
在一个窗口中分析货币对的多个时间范围可能会让您感到困惑。 要分析多个时间范围,您需要可靠的指标。 其中之一是使用 9TF Double CCI Double MA。 我夜以继日地工作,以创建简单但可靠的代码,并在一个指标中涵盖所有九个时间范围。 让我们看一下该指标的一些优点: 双 CCI,即 CCI 更快和 CCI 更慢。 双 MA,即更快的 MA 和更慢的 MA。 10 配色方案。 每个时间范围内的曲线颜色各不相同。 CCI 的 OBOS 水平线。 实时 9TF 仪表板监视器。 9TF 仪表板监视器计算非常准确,即使您从一个时间范围更改为另一个时间范围也是如此。 监控哪条 CCI 曲线高于超买水平,哪条低于超卖水平。 监控曲线是否 MA 快线高于 MA 慢线,反之亦然。 监控曲线是否有 MA 快线和 MA 慢线之间的交叉。 监视当前信号与先前信号的移动。 在上升或下降的过程中。 (注意:这是剥头皮非常重要的功能!) 一个非常重要的趋势栏功能,用于发现长期趋势。 改变颜色的能力。 能够选择要显示的曲线。 能够仅显示 CCI、仅 MA、仅显示仪表板等。 能够将 9T
可以使用准确的 CCI 指标。 仪表板趋势栏智能级别 9TF 双 CCI。 双 CCI,即快速 CCI 和慢速 CCI 为什么需要第二个 CCI? 使用额外的指标将使我们在实时交易中更有说服力 9TF 快速 CCI 曲线 9TF 慢速 CCI 曲线 9TF实时CCI角度 9TF实时CCI值 9TF 实时 CCI 方向/相位 9TF 趋势栏 计算趋势条的新算法 开/关按钮。 只需单击一下即可显示/隐藏指标非常有用 实时 9TF 仪表板监视器 只能显示趋势栏 只能显示 CCI 曲线 只能显示仪表板 能够选择要显示的 CCI 曲线 能够选择趋势的箭头类型 能够选择 obos 线条样式 能够显示/隐藏图例 能够增加/减少栏的数量 能够选择配色方案级别 能够选择多达 10 种仪表板趋势栏配色方案 能够改变 CCI 曲线的颜色 该指标经历了一系列的试验。 编程代码是用心编写的。 使用最好的 DTSL 9TF 双 CCI 交易指标进行自信的输入。 立即获取并像专业人士一样进行交易。 谢谢你。
提供准确的 RSI 指标。 仪表板趋势栏智能级别 9TF 双 RSI。 双 RSI,即快速 RSI 和慢速 RSI 为什么需要第二个 RSI? 使用额外的指标将使我们在实时交易中更有说服力 9TF 快速 RSI 曲线 9TF 慢速 RSI 曲线 9TF实时RSI角度 9TF实时RSI值 9TF 实时 RSI 方向/相位 9TF 趋势栏 计算趋势条的新算法 开/关按钮。 只需单击一下即可显示/隐藏指标非常有用 实时 9TF 仪表板监视器 只能显示趋势栏 只能显示 RSI 曲线 只能显示仪表板 能够选择要显示的 RSI 曲线 能够选择趋势的箭头类型 能够选择 obos 线条样式 能够显示/隐藏图例 能够增加/减少栏的数量 能够选择配色方案级别 能够选择多达 10 种仪表板趋势栏配色方案 能够改变 RSI 曲线的颜色 该指标经历了一系列的试验。 编程代码是用心编写的。 使用最好的 DTSL 9TF 双 RSI 交易指标自信地入场。 立即获取并像专业人士一样进行交易。 谢谢你。
提供准确的 MACD 指标。 仪表盘趋势栏智能级别 9TF 双 MACD。 双 MACD,即快速 (MACD 1) 和慢速 (MACD 2) 为什么需要第二个 MACD? 使用额外的指标将使我们在实时交易中更有说服力 9TF 快速 MACD 1 曲线 9TF 慢 MACD 2 曲线 9TF实时MACD角度 9TF实时MACD值 9TF 实时 MACD 方向提供准确的 MACD 指标。 仪表盘趋势栏智能级别 9TF 双 MACD。 双 MACD,即快速 (MACD 1) 和慢速 (MACD 2) 为什么需要第二个 MACD? 使用额外的指标将使我们在实时交易中更有说服力 9TF 快速 MACD 1 曲线 9TF 慢 MACD 2 曲线 9TF实时MACD角度 9TF实时MACD值 9TF实时MACD方向/相位 9TF 趋势栏 计算趋势条的新算法 开/关按钮。 只需单击一下即可显示/隐藏指标非常有用 实时 9TF 仪表板监视器 只能显示趋势栏 只能显示 MACD 曲线 只能显示仪表板 能够选择要显示的 MACD 曲线 能够选择趋势的箭头类型 能够选择 obos 线条样式 能够显示
提供准确的随机指标。 仪表板趋势栏智能级别 9TF 双随机。 双随机,即快速随机和慢速随机 为什么需要第二个随机指标? 使用额外的指标将使我们在实时交易中更有说服力 9TF 快速随机曲线 9TF 慢速随机曲线 9TF实时随机角度 9TF实时随机值 9TF 实时随机方向/相位 9TF 趋势栏 计算趋势条的新算法 开/关按钮。 只需单击一下即可显示/隐藏指标非常有用 实时 9TF 仪表板监视器 只能显示趋势栏 只能显示随机曲线 只能显示仪表板 能够选择要显示的随机曲线 能够选择趋势的箭头类型 能够选择 obos 线条样式 能够显示/隐藏图例 能够增加/减少栏的数量 能够选择配色方案级别 能够选择多达 10 种仪表板趋势栏配色方案 能够改变随机曲线的颜色 该指标经历了一系列的试验。 编程代码是用心编写的。 使用最好的 DTSL 9TF 双随机交易指标进行自信的入场。 立即获取并像专业人士一样进行交易。 谢谢你。
[V 1.00] MTF NRPA 5 RSI RTD 已发布! 非重绘箭头实时仪表板。 如果您厌倦了使用各种 RSI 指标但发现它们不准确,那么试试这个工具。 通常人们只设置 1 个 RSI 来确定一个时间范围内的 OBOS 水平。 坏消息是您无法同时看到不同时间范围内的 OBOS 水平和趋势。 这就是我开发此交易工具的原因。 解释如下: 在这个交易工具上,我使用了五个 RSI。 是的,五个! 默认情况下,我在较大的时间范围内设置 RSI 1 和 RSI 2,即 M30。 RSI 1 和 RSI 2 的交集意味着 M30 时间框架上有趋势变化。 然后我在当前(小)时间范围内设置 RSI 3 和 RSI 4,例如您在 M5 上打开图表。 RSI 3 和 RSI 4 的交集意味着当前时间帧 (M5) 有趋势变化。 然后为了确保趋势运动,我在更高的时间框架 (H1) 上设置了 RSI 5。 当 RSI 5 越过 50 水平(您可以设置时间范围和 OBOS 水平)时,箭头将出现。 这个交易工具有很多令人惊奇的东西: 您可以根据自己的意愿更改五个 RSI 时间范围。
Introducing the advanced trading tools of 2023. MTF PPAAF Model S. This is sub window version of my best trading tool : MTF Precise Price Action Arrow Filtered.  Click here to learn more about MTF PPAAF . This trading tool is equipped with various powerful features : MTF = Multi Time Frame = Time Frame can be changed. On/off button. Non Repaint Arrows.  Customizable parameter, color etc.  Can show all time frame (ATF) crossover arrows of fast stochastic main line & fast stochastic signal line (
If you are curious about the position of the stochastic, RSI, CCI curve, whether it is at the OBOS level or not, then this trading tool is for you. Introducing the advanced trading tools of 2024. ATF Trend Following Trend Bar OBOS. This indicator is similar to MTF PPAAF Model S but have two layers.  Click here to learn more about MTF PPAAFS . This trading tool is equipped with various powerful features : MTF = Multi Time Frame = Time Frame can be changed. On/off button. Customizable parameter,
交易者您好。 介绍我最好的交易工具。 MTF PPAAF T 型。 多时间范围精确价格行为箭头过滤模型 T。  这个交易工具是我多年来制作各种交易工具后最好的作品。 为什么这个交易工具是最好、最可靠的?  1. 该工具使用6个指标:  双倍 CCI = 快 CCI x 慢 CCI 双随机 = 快随机(快随机主线 x 快随机信号线)& 慢随机(慢随机主线 x 慢随机信号线)  双MACD=快速MACD(快速MACD主线x快速MACD信号线)&慢速MACD(慢速MACD主线x慢速MACD信号线) 六条移动平均线 = MA 1 x MA 2 、MA 3 x MA 4 和 MA 5 x MA 6 Dual Double RSI = 快速 DRSI(快速 DRSI 主线 x 快速 DRSI 信号线)& 慢速 DRSI(慢速 DRSI 主线 x 慢速 DRSI 信号线) RSIMA = RSI x MA 2. 实时9TF仪表板监控(第一个仪表板)。 该仪表板将为您提供有关上述 6 个指标数据的实时信息。  主线是在信号线之上还是
使用此交易工具,您可以同时扫描 15 个市场。 介绍新的交易指标 2024: ️ 仪表板多货币多时间框架随机。 我创建这个交易工具至少有两个原因: 首先,我厌倦了只观察一个市场。 其次,我不想失去进入另一个市场的时机。 这就是为什么我想同时了解其他市场状况。 因此,我需要一台可以同时扫描多个市场状况的扫描仪。 我经常寻找随机主线>(或<=)随机信号线从M1到H4(或只是M1到M30)的市场。 如果您同意我的分析,那么这就是您一直在寻找的交易指标。 不要错过市场状况满足上述要求的时刻。 这是一个随机扫描仪或仪表板,具有许多出色的功能: 可显示随机主线数据 可显示随机信号线数据 可以显示随机主线和信号线的位置(信号线上方主线或信号线下方主线) 可以显示随机主线和信号线的数据水平(看涨、看跌、趋势向上、趋势向下、超买但仍向上、超卖但仍向下) 可显示从M1到MN1的实时数据 可显示15种货币对的数据(多币种外汇/商品/加密货币/股票) 可定制参数 可定制颜色 OBOS 级别 漂亮的20仪表板配色方案 配备开/关货币对转换器 配备蜡烛高时间框架 配
使用此交易工具,您可以同時掃描 15 個市場。 介紹新的交易指標 2024: ️ 儀表板多貨幣多時間框架雙 CCI。 我創建這個交易工具至少有兩個原因: 首先,我厭倦了只觀察一個市場。 其次,我不想失去進入另一個市場的機會。 這就是為什麼我想同時了解其他市場狀況。 因此,我需要一台可以同時掃描多個市場狀況的掃描器。 我經常尋找快速 CCI 線 >(或 <=)慢速 CCI 線從 M1 到 H4(或只是 M1 到 M30)的市場。 如果您同意我的分析,那麼這就是您一直在尋找的交易指標。 不要錯過市場狀況滿足上述要求的時刻。 這是一個隨機掃描器或儀表板,具有許多出色的功能: 可顯示快速CCI線數據 可顯示慢速CCI線數據 可顯示快CCI線和慢CCI線的位置(快線在慢線上方或快線在慢線下方) 可顯示快速CCI線和慢速CCI線的數據水準(看漲、看跌、趨勢向上、趨勢向下、超買但仍向上、超賣但仍向下) 可顯示從M1到MN1的即時數據 可顯示15種貨幣對的資料(多幣種外匯/商品/加密貨幣/股票) 可自訂參數 可自訂顏色 OBOS 級別 漂亮的20儀表板配
使用此交易工具,您可以同时扫描 15 个市场。 介绍新的交易指标 2024: ️ 仪表板多货币多时间框架双 RSI。 我创建这个交易工具至少有两个原因: 首先,我厌倦了只观察一个市场。 其次,我不想失去进入另一个市场的机会。 这就是为什么我想同时了解其他市场状况。 因此,我需要一台可以同时扫描多个市场状况的扫描仪。 我经常寻找快速 RSI 线 >(或 <=)慢速 RSI 线从 M1 到 H4(或只是 M1 到 M30)的市场。 我还经常寻找从 M1 到 M30 超卖/超买的市场。 如果您同意我的分析,那么这就是您一直在寻找的交易指标。 不要错过市场状况满足上述要求的时刻。 这是一个随机扫描仪或仪表板,具有许多出色的功能: 可以显示快速RSI线的数据 可以显示慢速RSI线的数据 可以显示快速RSI线和慢速RSI线的位置(快线在慢线上方或快线在慢线下方) 可以显示快速RSI线和慢速RSI线的数据水平(看涨、看跌、趋势向上、趋势向下、超买但仍向上和超卖但仍向下) 可显示从M1到MN1的实时数据 可显示15种货币对的数据(多币种外汇/商品/加
筛选:
无评论
回复评论
版本 5.10 2024.09.20
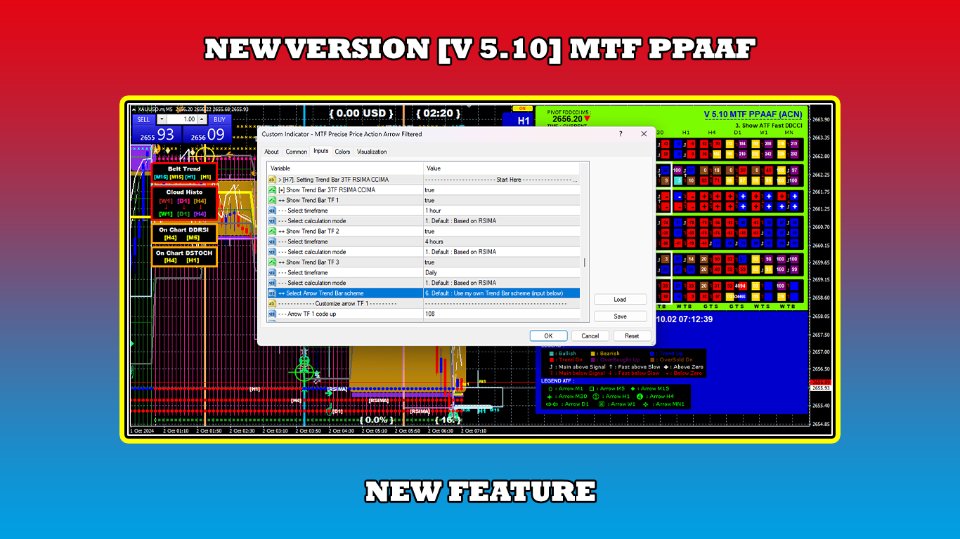
In this new Version V 5.10 :
- Adding Trend Bar 3TF RSIMA CCIMA arrows scheme
版本 5.0 2024.09.10
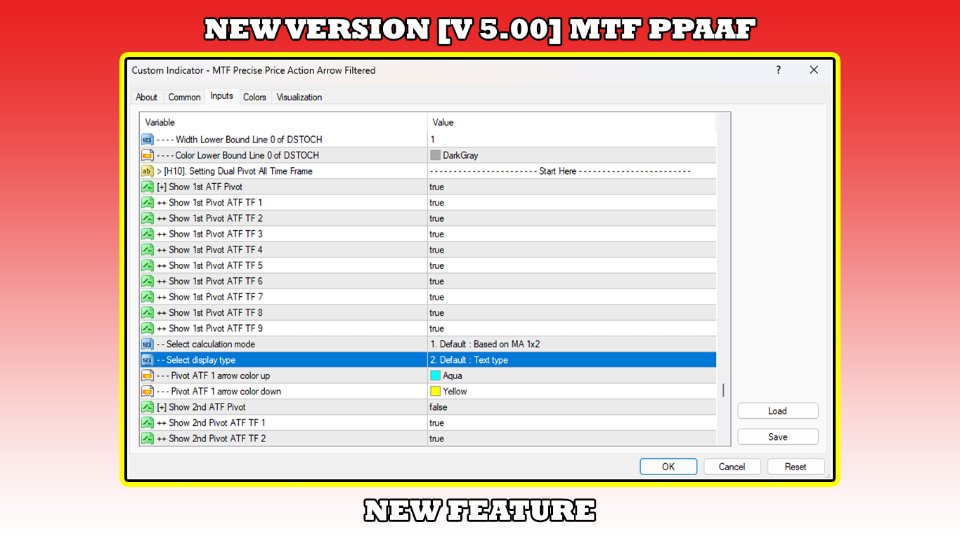
In this new Version V 5.00 :
- Replay system applicable to Dual Pivot ATF
- Adding display type to Dual Pivot ATF
版本 4.90 2024.08.26
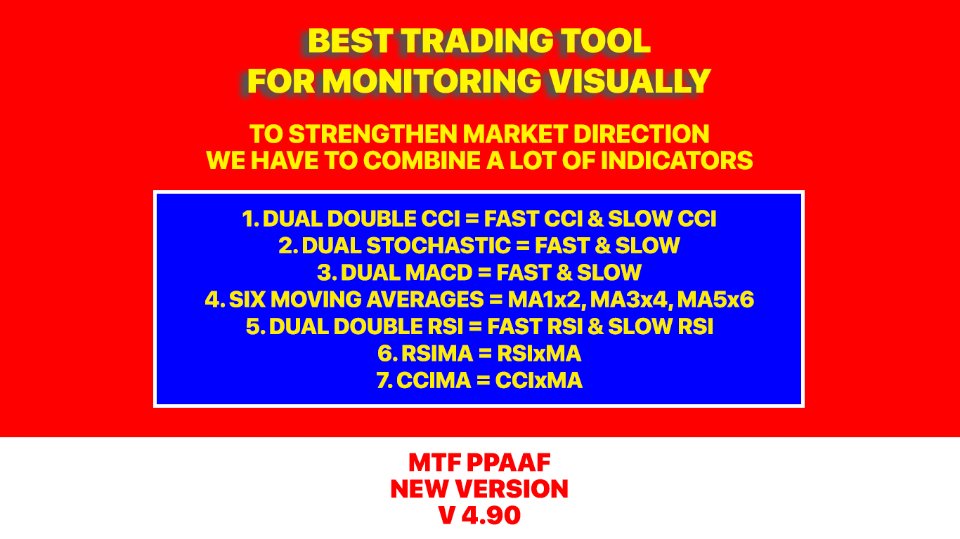
In this new Version V 4.90 :
- Adding Dual Double CCI
- Adding DCCI calculation mode
版本 4.80 2024.08.13
In this new Version V 4.80 :
- Deconstruct from the beginning
- Adding CCIMA indicator
- Adding triple MTF cloud histo
- Adding triple MTF confluence multi mode
- Adding trend bar 3TF RSIMA/CCIMA
- Adding dual pivot all time frame
- Adding color level scheme
- Customizing on chart feature
- Optimizing the loading time
版本 4.70 2024.04.03
In this new Version V 4.70 :
- Fixing pivot value horizontal line trading in the zone
- Customizing Dual MTF Cloud Histo
版本 4.60 2024.03.29
In this new Version V 4.60 :
- Changing MTF Belt Trend to Dual MTF Belt Trend
- Adding trend following feature to MTF Belt Trend
- Adding time frame scheme True RSIMA
- Customizing On Chart Dual DRSI
- Customizing On Chart Dual Stochastic
- Customizing On Chart True RSIMA
版本 4.50 2024.03.18
In this new Version V 4.50 :

- Deleting Super Trend Arrows (only dashboard available with lines and trend bar) to optimize the rendering time
- Deleting Trend Bar 3TF of SRCM (Stoch,RSI,CCI,MACD)
- Deleting Trend Bar 3TF of MA5 x MA6
- Deleting confluence 3TF of Stochastic
- Deleting confluence 3TF of MACD
- Deleting confluence 3TF of MA1 x MA2
- Deleting confluence 3TF of DRSI
- Deleting confluence Dual Stoch
- Deleting confluence Dual MACD
- Adding MTF Belt Trend
- Adding Dual MTF Cloud Histo
- Adding 3TF True RSIMA lines
- Adding 3TF True RSIMA trend bar
- Adding 3TF True RSIMA dashboard
- Adding horizontal line trading in the zone
- Adding pivot value horizontal line trading in the zone
- Fixing vertical lines trading in the zone
- Total mode right now is 13 (previously 9)
版本 4.40 2024.02.02
In this new Version V 4.40 :
- Adding trend bar feature of True RSIMA
- Adding dashboard feature of True RSIMA
- Adding vertical lines feature of trading in the zone
- Adding current time and broker time feature
- Modifying trend bar 3 time frame
- Fixing dashboard monitor position
- Fixing price index location
版本 4.30 2024.01.25
In this new Version V 4.30 :
- Fixing histogram of MTF Belt Trend
版本 4.20 2024.01.25
In this new Version V 4.20 :
- Fixing OBOS level of ATF dashboard
- Adding calculation mode of TB TRD FOL 3TF, i.e DCCI and FDMACD
- Adding histogram to MTF belt trend
版本 4.10 2024.01.10
In this new Version V 4.10 :
- Fixing ATF Stochastic and ATF MACD
- Fixing algorithm of confluence 3TF
- Fixing algorithm of STF Dual Stochastic and Dual MACD
版本 4.0 2024.01.03
In this new Version 4.00 :
- Adding background color to trend bar 3TF
- Adding Mode 8 : Show ATF MA 1x2 DRSI
- Adding timeframe scheme of trading in the zone
- Adding timeframe scheme of trend following STF
- Adding timeframe scheme of trend bar trend following 3TF
- Fixing dashboard of RSIMA
版本 3.90 2023.12.22
In this new Version 3.90 :
- Deleting favorite arrows
- Adding MTF Trendbar Trend Following 3 Time Frame FDSTOCH/DRSI
- Adding MTF Trendbar Average 3 Time Frame FDSTOCH/DRSI
- Adding MTF Trendbar Trend Following 3 Time Frame MA5 x MA6
- Adding MTF Trendbar Average 3 Time Frame MA5 x MA6
- Fixing status quo of trading in the zone
版本 3.80 2023.11.20
In this new version V 3.80 :
- I fixed the 1 minute RSIMA dashboard
- I limited the number of favorite arrow mode to three
版本 3.70 2023.11.16
In this new version V 3.70 :
- I fixed the RSIMA dashboard
- I added favorite arrow calculation modes
版本 3.60 2023.11.13
In this new version V 3.60 :
- I added favorite arrow feature
- I set up trading in the zone interface
- I added W1 timeframe scheme for trend following STF arrows
版本 3.50 2023.11.06
In this new version V 3.50 :
- I changed the symbol for MACD above zero and MACD below zero level.
- I changed the code of square STF trend following.
版本 3.40 2023.10.30
In this new Version 3.40 :
- I limited the number of candle high time frame
- I added arrow size option to trend following STF arrows
版本 3.30 2023.10.25
In this new Version 3.30 :
- I fixed the on off button sound
- I added trend bar 9TF of STA mode 2 from current time frame (0) to previous 5 bar ago (5)
- I fixed on chart dual stochastic channel
- I fixed dashboard position
- I modified algorithm in STA mode 1 & mode 2
- I added time frame scheme for trend following STF
版本 3.20 2023.10.19
In this new Version 3.20 :
- I changed the dashboard font so it looks clear
版本 3.10 2023.09.25
In this new Version 3.10 :
- Reduce total mode to only 8, i.e show all time frame crossover arrows and trading in the zone
- Modifying parameter setting
- Can show all time frame crossover arrows of fast CCI and slow CCI, i.e DCCI
- Modify the status for mode 8
- Can show trend following selected time frame of fast stochastic, RSI 1x2, CCI 1x2, fast macd and RSIxMA outside the modes.
版本 3.0 2023.09.06
In this new Version 3.00 :
- Modifying STA algorithm both for calculation mode 1 and mode 2
- Modifying dashboard color scheme
- Modifying parameter setting
版本 2.90 2023.09.04
In this new Version 2.90, I added new features :
- Adding Mode 29 : Show ATF Fast Stoch DRSI. With this feature monitoring all time frame arrows of stochastic and RSI is easy.
- Adding STA Calculation Mode. The first mode is based on crossover of RSI & MA and the second mode is based on crossover of fast RSI & slow RSI.
版本 2.80 2023.08.30
In this new Version 2.80, I added new feature :
- Adding Time Spread Profit Info (TSPI) indicator
版本 2.70 2023.08.21
In this new Version 2.70, I make monitoring visually Stoch RSI easy :
- Modifying on chart dual stochastic
- Modifying on chart double rsi
- Modifying on chart rsioma
- Modifying color level
版本 2.60 2023.08.13
In this new Version 2.60, I added new feature :
- Adding STF belt trend
- Fixing on chart range
- Changing arrow code DRSI and DCCI
版本 2.50 2023.07.31
In this new Version 2.50, I added new feature :
- Adding confluence of 3TF MA 1x2
- Changing arrow code for trend following double CCI
- Changing arrow code for trend following double RSI
版本 2.40 2023.07.25
In this new Version 2.40, I added new features :
- Adding confluence of 3TF Fast DSTOCH
- adding confluence of 3TF Fast DMACD
- Adding trend following STF of DRSI
- Adding STA monitor, i.e (from top to bottom) H1,H4,D1,W1,MN1
版本 2.30 2023.07.18
In this new Version 2.30, I added new features :
- Added mode 28 : show trading in the zone
- Added 9TF double CCI dashboard monitor
- Added selected timeframe of double CCI crossover arrows
- Added STA monthly arrows
- Added three new dashboard color scheme
- Fixing STA, dual stochastic & dual MACD algorithm
版本 2.20 2023.07.11
In this new Version 2.20, I added new features :
- Added upper bound 100 & lower bound 0 for on chart dual stochastic
- Added upper bound 100 & lower bound 0 for on chart double rsi
- Fixing trading in the zone four MA
- Added timeframe scheme for four MA
- Fixing RSIMA dashboard
版本 2.10 2023.07.04
In this new Version 2.10 :
- Fixing DRSI arrow TF MN1
- Fixing color super trend arrows
- Fixing arrow MA 3 x MA 4
- Added timeframe scheme D1,W1,MN1 for conflux DRSI
版本 2.0 2023.07.03
In this new Version 2.00, I added new features :
- Added confluence arrows of 3 timeframe double RSI
- Added 12 timeframe scheme to choose from for confluence of double RSI
- Fixing algorithm for trend following dual stoch and dual macd
版本 1.90 2023.06.26
In this new Version 1.90, I added new features :
- Added super trend arrows higher timeframe
- Added MACD above or below zero level into dashboard
- Fixing MTF feature
版本 1.80 2023.06.20
In this new Version 1.80, I've made a lot of changes :
- Change the appearance of the dashboard from a circle to a square shape.
- Fixing color OBOS of slow stochastic and slow drsi.
- Added feature on chart slow stochastic.
- Added feature pivot value of all time frame of Fast Stoch.
- Added feature pivot value of all time frame of Fast MACD.
- Added feature pivot value of all time frame of MA 1,2.
- Added feature pivot value of all time frame of Double RSI.
- Added feature pivot value of all time frame of RSIMA.
- Added feature MTF candle high time frame.
- Ability to change/shift the starting time to monitor in real time 9TF dashboard.
版本 1.70 2023.06.02
In this new Version 1.70, I've added the ability to monitor visually :
- On chart stochastic makes it easy for us to observe the movement of stochastic main line and stochastic signal line along the OBOS channel.
- On chart four MA makes it easy for us to observe the movement of MA 1 cross MA 2 and MA 3 cross MA 4.
- On chart double RSI makes it easy for us to observe the movement of RSI fast line and RSI slow line along the OBOS channel.
- On chart true RSIMA makes it easy for us to observe the movement of RSI line and MA line along the OBOS channel.
This on chart double RSI or on chart true RSIMA will make monitoring RSI divergence much more accurate than installing RSIMA on sub window.
And also I changed the appearance of the 10 dashboard color scheme to be more attractive.
版本 1.60 2023.05.23
In this new Version 1.60, I've made trading in the zone much more easy :
- Added four MA dashboard monitor (not just two MA!)
- Added four MA lines on chart (by default : MA 1x2 on current timeframe and MA 3x4 on M30)
- Customizable four MA lines
- Button can be located on sub window
版本 1.50 2023.05.03
In this new Version 1.50, I've made a lot of reconstruction :
- Total mode up to 27
- New feature : Show Trend Following ATF TWOMA Filtered By Trend Following Selected TF of FAST STOCH
- New feature : Show Trend Following ATF TWOMA Filtered By Trend Following Selected TF of FAST MACD
- New feature : Show Trend Following ATF TWOMA Filtered By Trend Following Selected TF of DRSI
- New feature : Show Trend Following ATF TWOMA Filtered By Trend Following Selected TF of RSIMA
- Trend following = non repaint arrows!
- Fixing algorithm of button
- Adding color level type
版本 1.40 2023.04.11
In this new Version 1.40, I've made a lot of reconstruction :
- Total mode up to 23
- New feature : Show Trend Following All Timeframe of Two MA
- New feature : Show Trend Following All Timeframe of Double RSI
- New feature : Show Trend Following All Timeframe of RSIMA
- New feature : Show Trend Following Selected Timeframe of Two MA
- New feature : Show Trend Following Selected Timeframe of Double RSI
- New feature : Show Trend Following Selected Timeframe of RSIMA
- New feature : Show Trend Following Selected Timeframe of Dual Stoch
- New feature : Show Trend Following Selected Timeframe of Dual MACD
- Trend following = non repaint arrows!
- Fixing algorithm of mode 21 : Show Selected TF of STOCH,MACD,TWOMA,DRSI Filtered By Trend Following RSIMA
- Parameter values can be hide/show
版本 1.30 2023.03.30
In this new Version 1.30, I've made a lot of reconstruction :
- Added dual stochastics dashboard monitor (fast stoch = stochastic 1 and slow stoch = stochastic 2)
- Added dual macd dashboard monitor (fast macd = macd 1 and slow macd = macd 2)
- Fixing MA Phase of RSIMA
- Change arrow code
- New feature : showing trend following arrows of stochastics and macd
- Dashboard monitor can be hide
版本 1.20 2023.03.12
In this new Version 1.20, I've made a lot of reconstruction :
- Fixing daily arrow of MACD
- Fixing arrow of RSIMA
- New algo in determining the up and down arrows
- New feature : showing arrows of Stochastic, MACD, Two MA and RSIMA at once
- Adding the RSIMA 9TF dashboard monitor
- Beautify the dashboard monitor
版本 1.10 2023.02.27
New version 1.10 with new feature available:
- Adding the ability to filter price action by all time frame (ATF) Two Moving Average
- Adding the ability to filter price action by all time frame (ATF) Double RSI
- Adding the value of Stochastic on all time frame
- Adding the value of CCI on all time frame