SPTforMT4
- 指标
- Shao Qun Lu
- 版本: 1.0
- 激活: 5
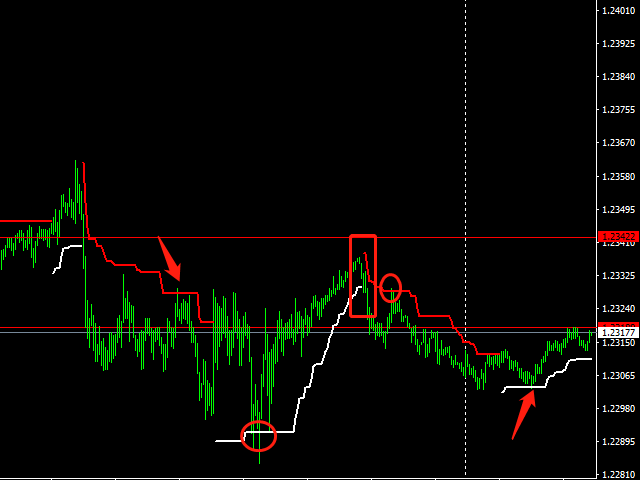
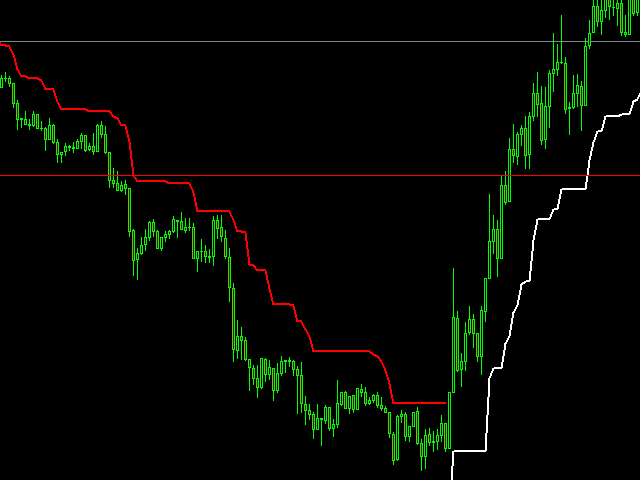
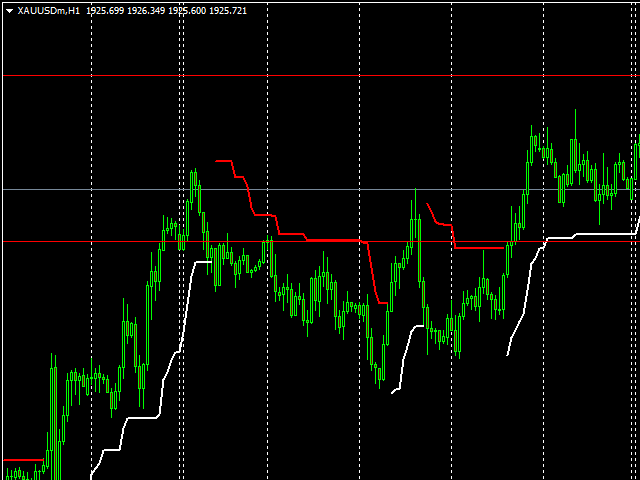
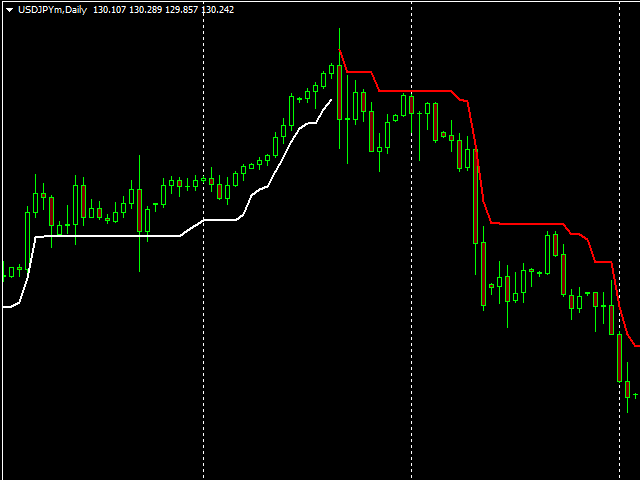
SPT是一个明确的趋势指标.
金十网站推出的交易大师版,SPT指标是最大的卖点.
它基于ATR指标进行编写,以明确的趋势线标明了趋势正在进行的方向和趋势转换位置.
不同手法的交易者对此指标的理解可能会形成两种不用的用途.
1.基于趋势的交易者会在趋势线转换时开始或者结束一段趋势交易,
2.基于震荡区间进行抄底摸顶的交易者会根据此指标标识的最后支撑或者阻力位进行区间交易.该指标的支撑阻力会随着趋势的进行而不断提升或者下降,使得以更小更合理的止损设定追随趋势的进行.
指标参数如下:
Multiplier:ATR的倍数
Period :ATR周期,此周期越小则指标越敏感,无效性也越高,但止损也越小
要安装MT4 Supertrend Line指示器,请遵循以下说明:
1.下载指标存档文件。
2.打开MetaTrader 4数据文件夹(通过文件->打开数据文件夹)。
3.打开MQL4文件夹。
4.将存档中的所有文件夹直接复制到MQL4文件夹。
5.重启MetaTrader 4或右键单击平台的导航子窗口并选择刷新,刷新指标列表。
为使本指标在各位朋友手中发挥更好的效力,请购买的后的朋友联系版主加入指标讨论群,版主将另送一套PinBar检测器工具.
版主QQ66923285 微信 forex-lu