DC Donchian Channel Turtle Trade
- 指标
- Emin Ulucanli
- 版本: 1.10
- 更新: 7 三月 2023
DONCHIAN CHANNEL DC
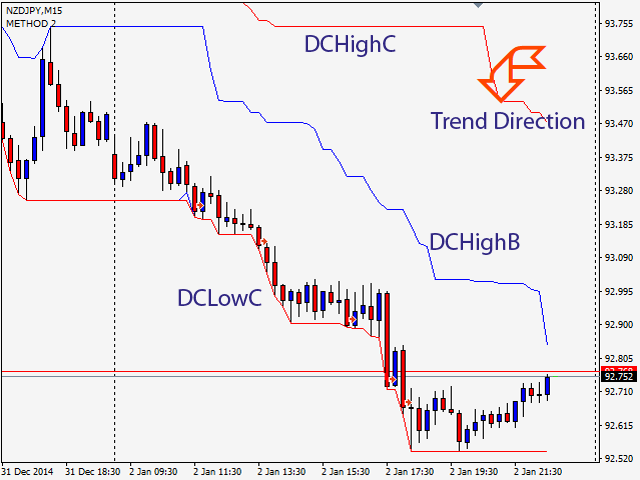
It is a trend indicator developed by “Richard Donchian”, consisting of 3 layers, the upper channel, the lower channel and the middle channel. It is created on the Donchian Channel by plotting the highest and lowest prices reached in the past period on the price chart. It is also used to measure the volatility of the market, as it is an expanding/contracting channel according to the increase/decrease of price volatility.
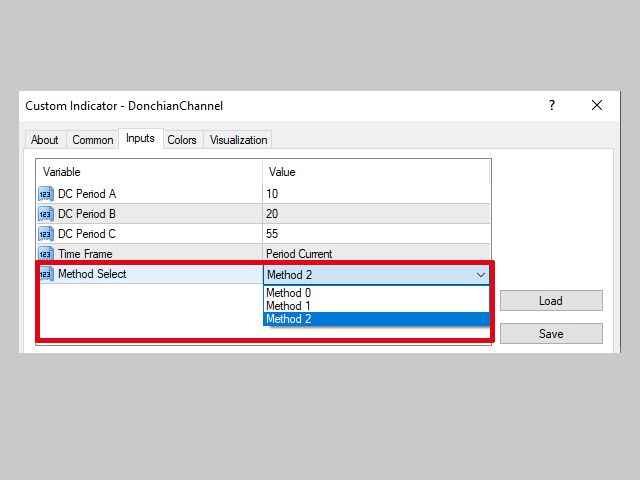
Method 0; Donchian channel indicator drawing.
BUY/SELL Signals;
Method 1; A strategy using 20 - period (20DC) and 10- period channels (10DC)),
- When the bar closes above the upper (20DC)), the BUY signal begins. If the bar returns and closes below the lower (10DC), BUY ends.
- When the bar closes below the lower (20DC)), the SELL signal starts. If the bar returns and closes above the upper (10DC), SELL ends.
Method 2; A strategy using 55 - period (55DC) and 20- period (20DC)) channels,
- When the bar closes above the upper (55DC)), BUY signal starts. If the bar returns and closes below the lower (20DC), BUY ends.
- When the bar closes below the lower (55DC)), SELL signal starts. If the bar returns and closes above the upper (20DC), SELL ends.
Indicator Default Values;
DCHighA-DCLowA; Period; 10 Colors; sea water
DCHighB-DCLowB; Period; 20 Colors; Blue
DCHighC-DCLowC; Period; 55 Colors; Red
用户没有留下任何评级信息