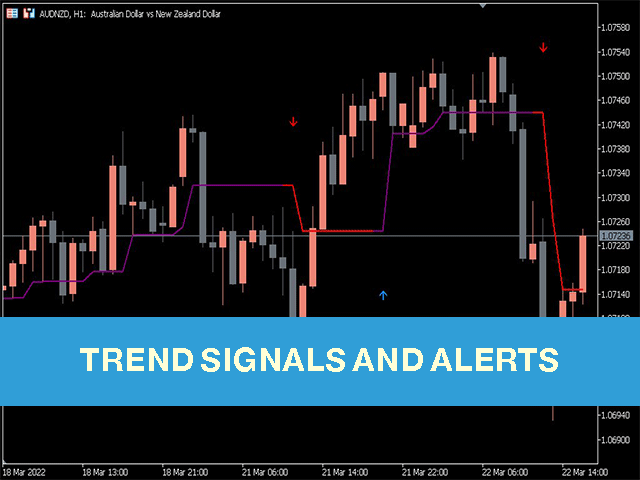
Trend Signals Alerts
- 指标
- Obaida Kusibi
- 版本: 1.0
- 激活: 5
趋势跟踪和非重绘外汇交易指标。
它的信号以完全自动的方式计算和提供,并基于移动平均线交叉点。 这是一个对新手友好的工具,因为这些信号以简单的买入/卖出箭头的形式呈现。 尽管如此,信号可靠性非常可靠。 您可以将它与任何外汇交易策略结合使用。
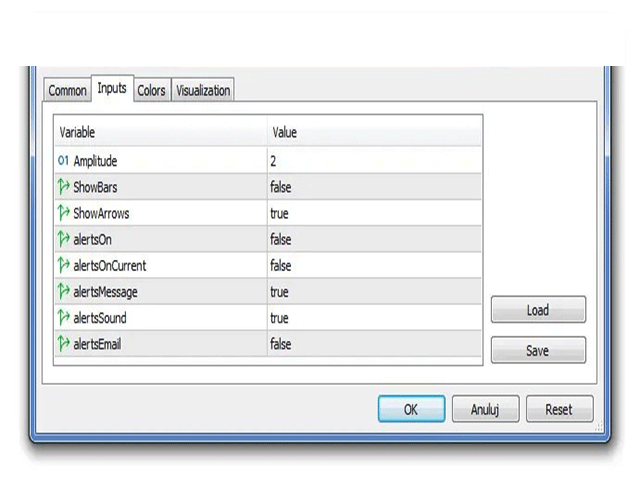
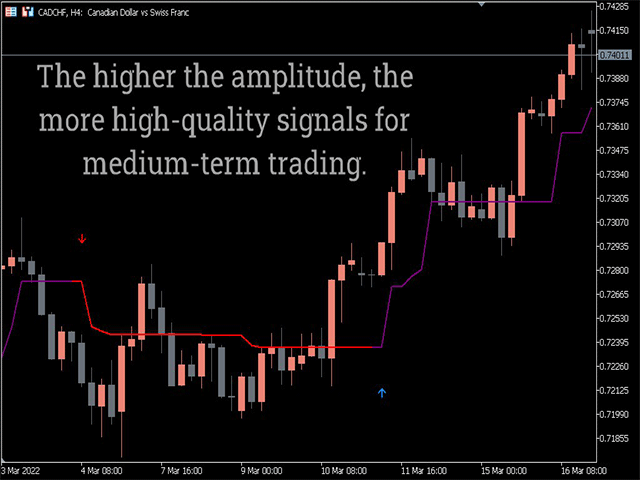
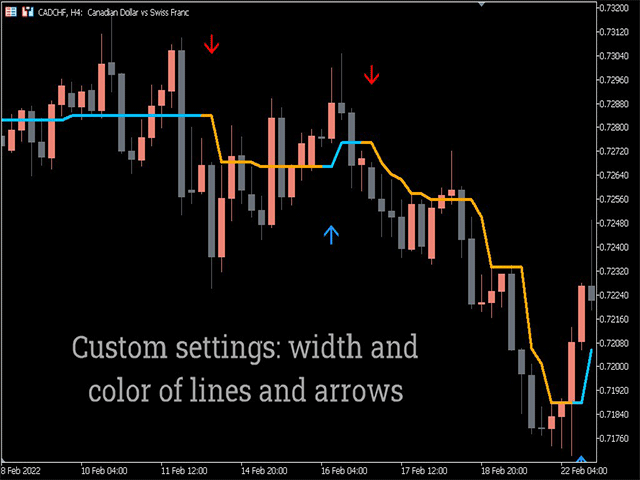
Trend Signals Alerts Indicator 适用于各种时间框架和货币对。 它直接显示在主交易图表上。 可以直接从输入选项卡修改默认设置。
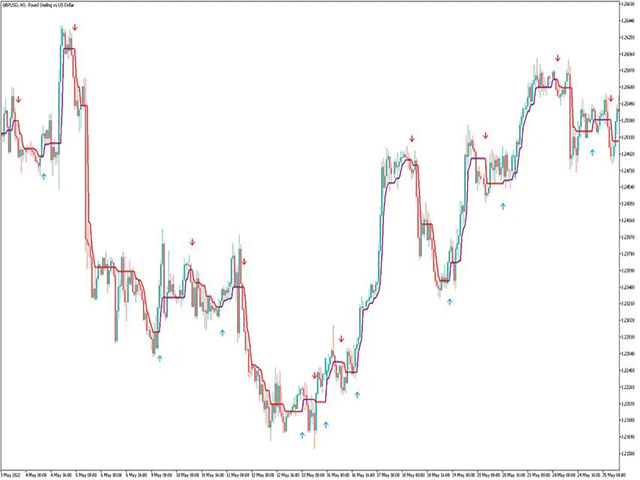
仔细查看趋势信号警报指标
该指标背后的主要思想是提供一种简单的方法来展示市场趋势和交易信号。 结果,初学者和高级交易者都可以利用该工具。 只需看看屏幕截图中在 MT5 中激活时的外观。
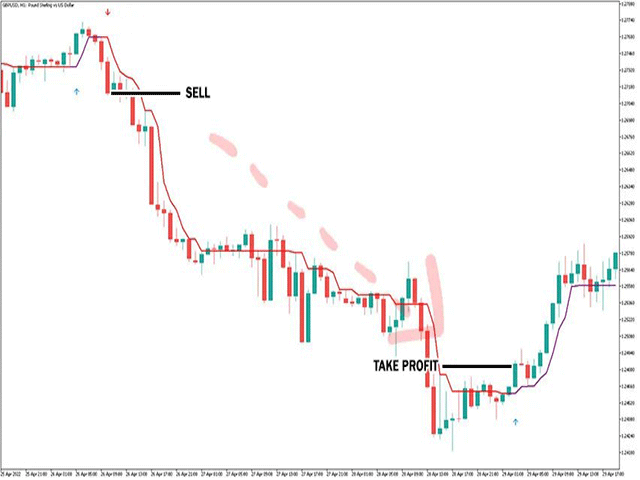
趋势信号警报指标剖析
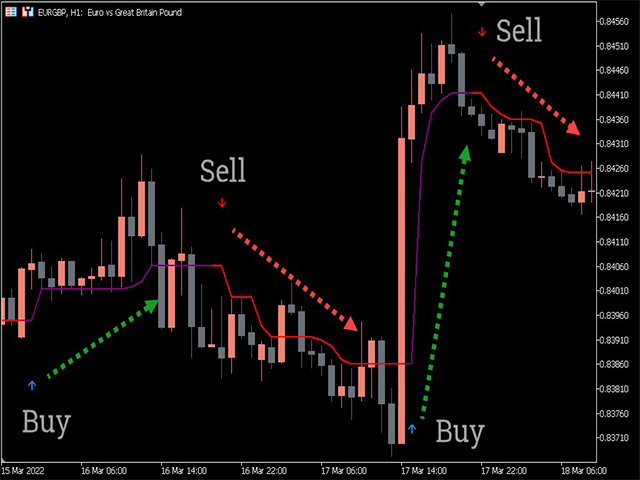
如您所见,它只是一条带有买入/卖出箭头的线,可以进行相应的交易。 箭头位于移动平均线相交的同一位置。 但是,不能更改这些移动平均线的周期。
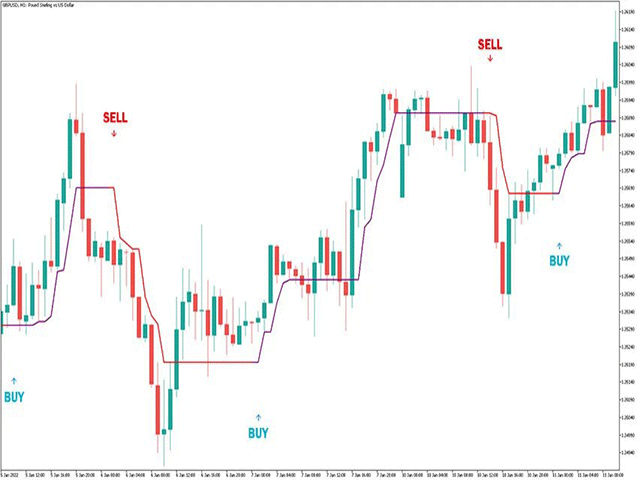
趋势信号警报指标:买入信号
请按照以下提示获取多头交易信号:
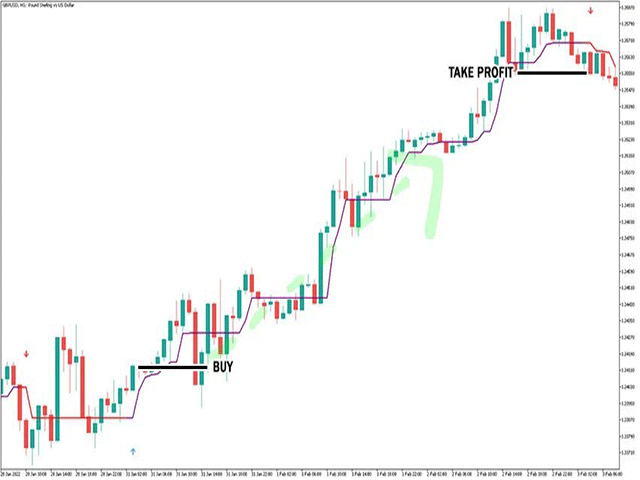
1.向上箭头出现
2.触发收盘后开启买入交易
3.将止损设置在最近市场低点下方几个点
4.保持仓位直到出现相反的信号或使用您自己的交易退出策略
半趋势买入卖出指标:卖出信号
请按照以下提示获取空头交易信号:
1.向下箭头出现
2.触发收盘后开启卖出交易
3.将止损设置在最近市场高点上方几个点
4.保持仓位直到出现相反的信号或使用您自己的交易退出策略