Key Price Levels MT5
- 指标
- Wafa Mohammed Omar Abou Alwafa
- 版本: 1.1
- 更新: 23 十二月 2022
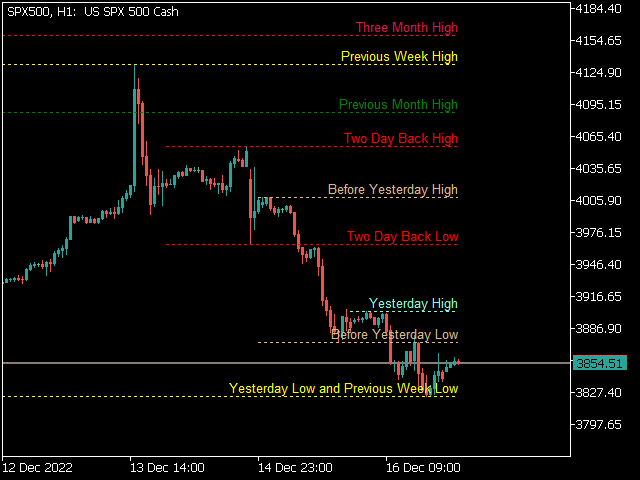
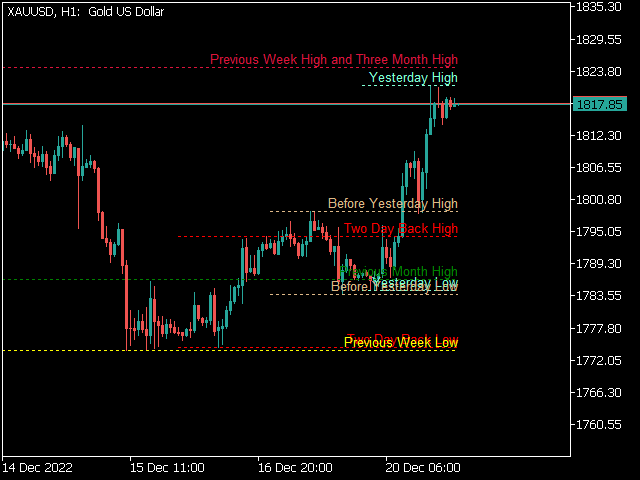
Key Price Levels Indicator
Indicator that shows the highs and lows for the significant price levels for past periods that could be potentially considered as reaction levels.
The indicator displays the following price levels:
- Yesterday high and low
- The day before yesterday high and low
- Two days back high and low
- Last week high and low
- Last month high and low
- Last three month high and low (Quarter)
- Last year high and low


Thanks you!