NoRepaint Signals
- 指标
- Obaida Kusibi
- 版本: 5.0
- 更新: 6 二月 2023
- 激活: 5
在 V2 上添加警报
Metatrader 4 的 NoRepaint Signals 指标是一个完整的外汇交易系统,可在图表上打印准确的买卖箭头。
该指标使用多个指标来生成高赢信号交易
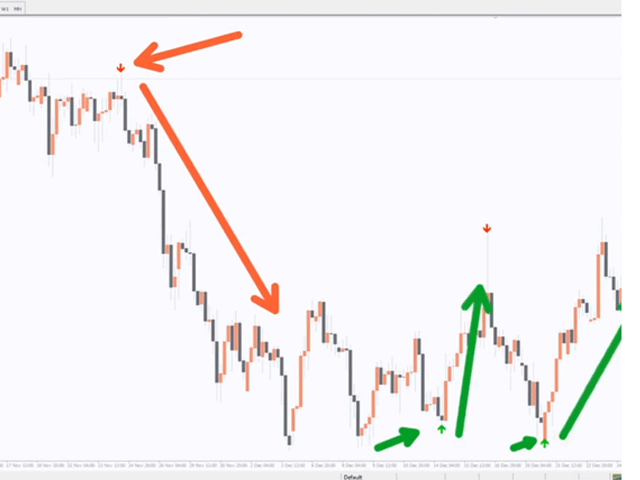
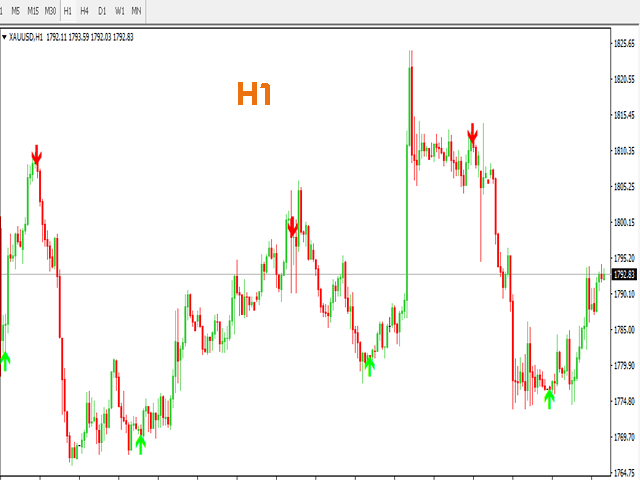
该指标在主 MT4 图表窗口中显示为绿色和红色箭头。
使用单个指标生成的信号在交易时可能会有风险。 这是因为仅使用一个指标进行交易会给出更多错误信号。 因此,许多外汇交易者使用三个或更多指标来过滤掉良好的交易设置。
然而,对信号使用多个指标也可能会变得复杂和混乱。 当这些指标产生相互矛盾的信号时尤其如此。 然而,NoRepaint Signals 指标通过使用多个指标提供良好的信号。 因此,MT4 的 NoRepaint Signals 指标避免了指标矛盾的问题。
这些指标组合起来就是移动平均线、相对强度指数、布林带、魔术过滤器、赫尔和我自己的两个个人指标。
只需按照指示器显示的信号操作即可!
交易信号:
绿色箭头是买入信号。
红色箭头是卖出信号。
NoRepaint Signals 指标可用于交易进入和退出,或用作其他策略和系统的趋势确认信号指标。
该指标同样适用于所有货币对(主要货币对、次要货币对和外来货币对),如果使用得当,它会显示出可喜的结果。
指标规格和输入:
货币对:适用于任何货币对
时间范围:适用于任何时间范围
交易风格:适用于剥头皮交易、日内交易和波段交易
输入参数:变量(输入选项卡)、颜色设置和样式
指标类型:信号
指标是否重绘? 不。


REPAINT INDICATOR (STAY AWAY)