• 概述
  • 评论 (5)
  • 评论 (18)
  • 新特性

Trend Reversal Scanner MT5

5

** All Symbols x All Timeframes scan just by pressing scanner button **

*** Contact me to send you instruction and add you in "Trend Reversal group" for sharing or seeing experiences with other users.

Introduction:

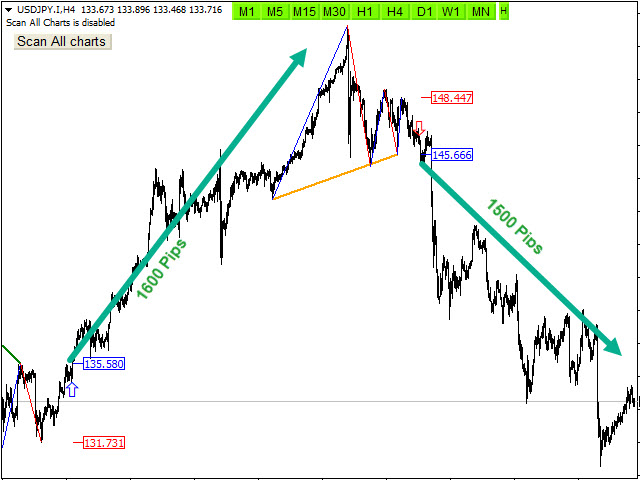
Trendlines are the most famous technical analysis in trading. Trendlines continually form on the charts of markets across all the different timeframes providing huge opportunities for traders to jump in and profit on the action. In the other hand, The trendline reversal strategy has high win rate on the price action in the market that let You catch the big fish at the edge of the waterfall.

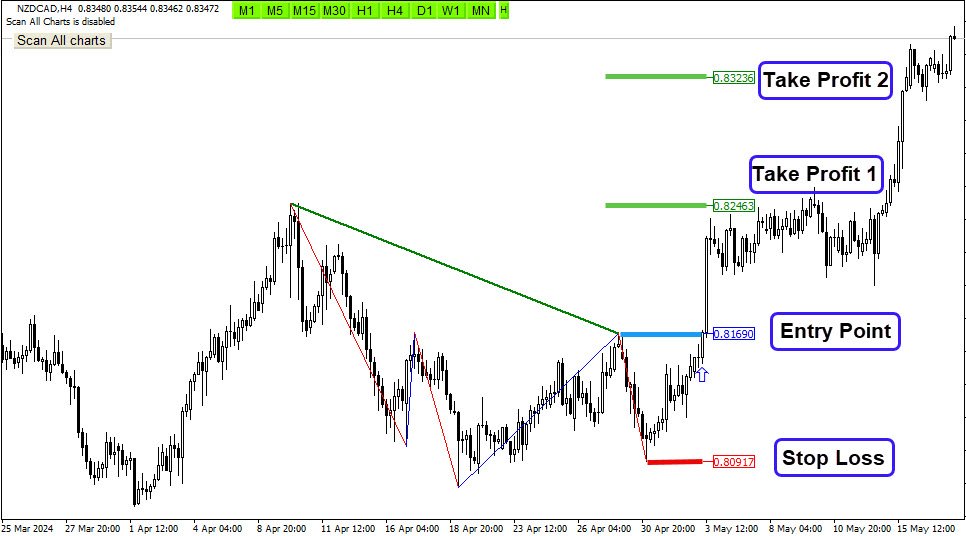
The Trend Reversal indicator Scans All charts just by pressing one click. It has stop loss, entry point and take profit levels with using Fibonacci levels and candlestick checking to find the best entry point of trading. It finds signals immediately with alarm and notification for easy trading.It is included powerful Three Drives or 5W pattern based on RTM concepts.

Main Features:

  • Detect the best and most common successful point of reversal trend
  • Easy-to-use and user-friendly indicator
  • NO repaint
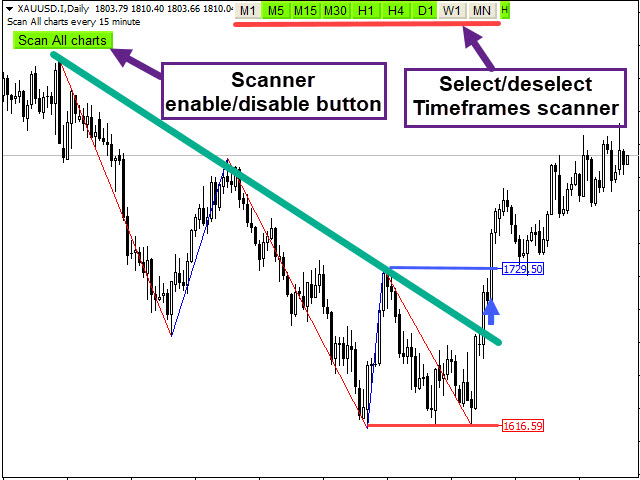
  • Scan All charts button ( Forex, Crypto, Indices and commodities )
  • Select and deselect time frames button for scan (M1,M5,M15,M30,H1,H4,D1,W1,MN)
  • It displays and pushes notification stop-loss, TP and entry-point levels
  • Real Statistics Dashboard
  • Candlestick check for the best entry point
  • Use Fibonacci levels
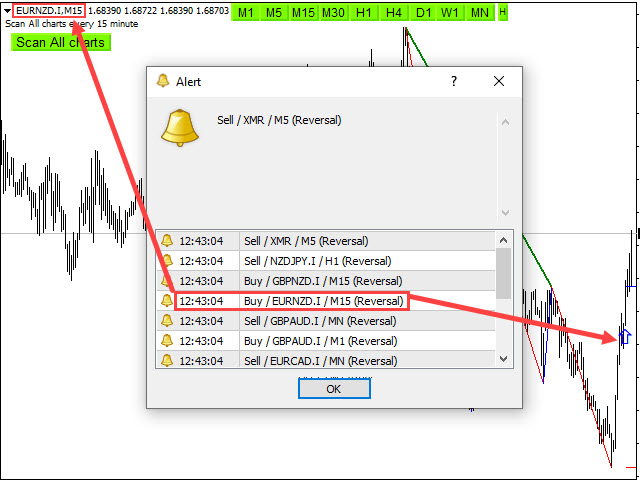
  • Sending the alert and push notification
  • Alert enable/disable base on your setting time
  • Adjust the pattern setting
  • Risk to Reward : at least 1:2

Input Parameters :

=========Scanner============

  • Scan All Charts – Enable
  • Scan the number of candles – Amount of history bars to evaluate
  • Re-scan Timer – Re-scan all charts in all time frames after passing time
=======Display/style Options============
  • Display Options – Display or do not  SL, TP & Entry levels
  • Statistics dashboard - Display or do not display Statistics dashboard
  • Stop Loss levels and Breakout Style - Set the Fonts and colors of patterns

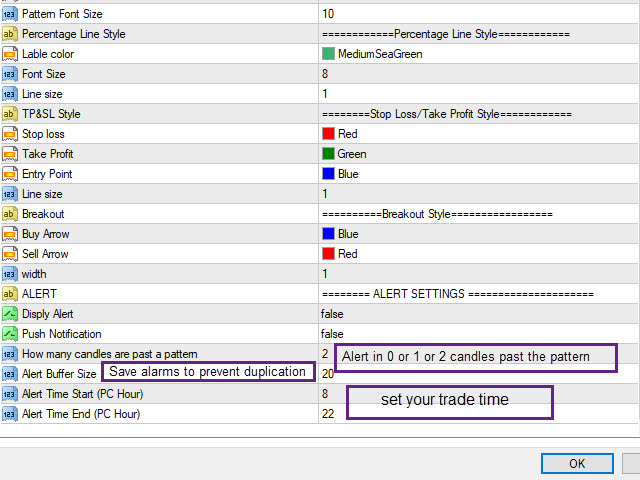
    ========ALERT SETTINGS ==========

    • Display Alert or Push Notification – Enable or disable Alert or Push Notification
    • How many candles are past a pattern – Maximum Number of candles Passed from a pattern to allow alert
    • Alert Buffer Size – Maximum save alert to prevent duplicate alerts
    • Alert start/end time  – Determine trading hours based on the computer clock to activate and deactivate the alarm


      评论 5
      toulong
      39
      toulong 2024.08.07 06:25 
       

      Indicateur super très sympa

      Ekaterina Rachel Keren Brooke
      427
      Ekaterina Rachel Keren Brooke 2024.07.23 20:14 
       

      very good!!

      31416
      333
      31416 2024.06.18 07:03 
       

      I find it useful :)

      推荐产品
      Blahtech Market Profile MT5
      Blahtech Limited
      5 (9)
      Was: $249  Now: $99   Market Profile defines a number of day types that can help the trader to determine market behaviour. A key feature is the Value Area, representing the range of price action where 70% of trading took place. Understanding the Value Area can give traders valuable insight into market direction and establish the higher odds trade. It is an excellent addition to any system you may be using. Inspired by Jim Dalton’s book “Mind Over Markets”, this indicator is designed to suit the
      Order Book, known also as Market Book, market depth, Level 2, - is a dynamically updated table with current volumes of orders to buy and to sell specific financial instument at price levels near Bid and Ask. MetaTrader 5 provides the means for receiving market book from your broker, but in real time only, without access to its history. The indicator OrderBook Cumulative Indicator accumulates market book data online and visualizes them on the chart. In addition, the indicator can show the market
      PZ Penta O MT5
      PZ TRADING SLU
      The Penta-O is a 6-point retracement harmonacci pattern which usually precedes big market movements. Penta-O patterns can expand and repaint quite a bit. To make things easier this indicator implements a twist: it waits for a donchian breakout in the right direction before signaling the trade. The end result is an otherwise repainting indicator with a very reliable trading signal. The donchian breakout period is entered as an input. [ Installation Guide | Update Guide | Troubleshooting | FAQ | A
      该指标建立当前报价,可以与历史报价进行比较,并在此基础上进行价格走势预测。指示器有一个文本字段,用于快速导航到所需日期。 选项: 符号 - 选择指标将显示的符号; SymbolPeriod - 选择指标从中获取数据的时段; IndicatorColor - 指示器颜色; HorisontalShift - 由指标绘制的报价移动指定的柱数; Inverse - true 反转引号,false - 原始视图; ChartVerticalShiftStep - 图表垂直移动(键盘上的向上/向下箭头); 接下来是文本字段的设置,您可以在其中输入日期,您可以通过按“回车”立即跳转到该日期。 接下来是文本字段的设置,您可以在其中输入日期,您可以通过按“回车”立即跳转到该日期。
      Trading Utility for Forex Currency Pairs Only not for Gold  Functions Auto Lot Calculation based on Risk Auto stoploss  Auto TakeProfit Breakeven Auto Close Half % Close in percentage with respect to the PIPs Pending Orders BuyLimit Sell Limit with distances BuyStop Sell Stop    with distances Trading Informations Risk in percentage For Multiple trades Combine Takeprofit and Combine Stoplosses
      BoxChart MT5
      Evgeny Shevtsov
      5 (7)
      The market is unfair if only because 10% of participants manage 90% of funds. An ordinary trader has slim changes to stand against these "vultures". This problem can be solved. You just need to be among these 10%, learn to predict their intentions and move with them. Volume is the only preemptive factor that faultlessly works on any timeframe and symbol. First, the volume appears and is accumulated, and only then the price moves. The price moves from one volume to another. Areas of volume accumu
      Blahtech Supply Demand MT5
      Blahtech Limited
      4.54 (13)
      Was: $299  Now: $99   Supply Demand uses previous price action to identify potential imbalances between buyers and sellers. The key is to identify the better odds zones, not just the untouched ones. Blahtech Supply Demand indicator delivers functionality previously unavailable on any trading platform. This 4-in-1 indicator not only highlights the higher probability zones using a multi-criteria strength engine, but also combines it with multi-timeframe trend analysis, previously confirmed swings
      Wapv Price and volume
      Eduardo Da Costa Custodio Santos
      VR Grid Mt5
      Vladimir Pastushak
      3.43 (7)
      VR 网格指示器 设计 用于创建具有用户定义设置的图形网格。与 标准网格 不同,VR 网格用于构建 圆形关卡 。根据用户的选择,轮次级别之间的步长可以是任意的。此外,与其他指标和实用程序不同,即使时间段发生变化或终端重新启动,VR Grid 也能保持网格的位置 。 设置、设置文件、演示版本、说明、问题解决,可以从以下位置获取 [博客] 您可以在以下位置阅读或撰写评论 [关联] 版本为 [MetaTrader 4] 垂直级别 基于实际时间间隔并 忽略缺失 或不存在的周期。因此,级别之间的步长严格对应于用户选择的值。 使用 VR 网格指标时,交易者 可以更改任何级别的垂直线和水平线的样式 、颜色和粗细。这使您可以控制金融工具的 回合水平 。 整数位是 以两个或多个零结尾 的价格(例如:1.23500、5.65900、1923.200)。人们相信,这样的水平 经常充当 作为支撑或阻力的强点。 Horizontal line settings Horizontal line step Horizontal line color Horizontal line style Horizon
      FREE
      POC level MT5
      Mikhail Nazarenko
      The indicator automatically calculates       and displays the level of the maximum       real   volume Point Of Control (POC) of the Market Profile for the   array of candles   highlighted by a rectangular area. This will significantly increase the accuracy of your position entries when trading POC bounces and reversals. Attention when testing the demo version!   In the MT5 strategy tester , there is no possibility of dragging a rectangle and this is a problem of limitations of the MT5 strategy
      Crash 1000 Scalping Indicator for the Crash 1000 Deriv Synthetic Index. Introduction The Crash 1000 Scalping Indicator is a specialized tool designed for the Crash 1000 index on the Deriv Synthetic market. This indicator is particularly useful for scalping on the M1 timeframe, helping traders to identify precise entry and exit points for buy positions. It is designed to be non-repainting, providing clear signals with audible alerts and push notifications, and is compatible with mobile devices th
      Renko Plus
      Eadvisors Software Inc.
      With Renko Plus you can use the features in the Indicator functionality, just add it to the Metatrader5 chart.             The Renko chart is a type of chart, developed by the Japanese, that is constructed using price movement rather than standardized prices and time intervals like most charts. It is believed to be named after the Japanese word for bricks, "renga", as the graphic looks like a series of bricks.             A new brick is created when the price moves a specified p
      Value Chart Candlesticks
      Flavio Javier Jarabeck
      4.7 (10)
      The idea of a Value Chart indicator was presented in the very good book I read back in 2020 , " Dynamic Trading Indicators: Winning with Value Charts and Price Action Profile ", from the authors Mark Helweg and David Stendahl. The idea is simple and the result is pure genius: Present candlestick Price analysis in a detrended way! HOW TO READ THIS INDICATOR Look for Overbought and Oversold levels. Of course, you will need to test the settings a lot to find the "correct" one for your approach.
      FREE
      Key level wedge MT5
      Presley Annais Tatenda Meck
      The   Key level wedge MT5   indicator automatically draws rising wedge pattern and falling wedge pattern for you on the chart. This pattern is really good when used as a confirmation entry at key support & resistance, supply & demand and reversal zones. Advantages  The   Key level wedge MT5   block DOES NOT RE-PAINT, giving you confidence when a signal appears and also helps when looking back.  The   Key level wedge MT5   includes an on/off button on the chart to easily keep the charts cle
      True Weis Wave
      Atila Goncalves Firmino
      A version based on David Waves' description in his book 'Trade About to Happen' of his adaptation of the Wyckoff wave chart. The indicator directionally accumulates volume, adding to each brick or candle close, with color indication for up and down. it can be used it with tick or real volume, it also changes color when the accumulated value of the previous wave is exceeded, being the trade signal. Yellow color is used for doji candlestick, it will continue with accumulation without zero the sum
      VolumeDeltaBars
      Stanislav Korotky
      This indicator is a conventional analytical tool for tick volumes changes. It calculates tick volumes for buys and sells separately, and their delta on every bar, and displays volumes by price clusters (cells) within a specified bar (usually the latest one). The algorithm used internally is the same as in the indicator VolumeDeltaMT5 , but results are shown as cumulative volume delta bars (candlesticks). Analogous indicator for MetaTrader 4 exists - CumulativeDeltaBars . This is a limited substi
      Mt5 Market Profile
      Mcblastus Gicharu Ndiba
      Market Profile Introducing the Market Profile MetaTrader Indicator—your gateway to mastering market dynamics with precision and insight. This powerful tool delivers a classic Market Profile analysis, revealing price density over time and highlighting crucial levels, including the value area and control value for any trading session.  Compatible with timeframes from M1 to D1, it adapts to daily, weekly, monthly, or even intraday sessions, offering you unmatched flexibility. Lower timeframes pro
      本指标可以让您享受两个最流行的产品来分析在感兴趣的价位的请求量和市场成交量: 真实市场深度图表 真实报价足迹成交量图表 本产品结合两个指标的效力,并以单个文件提供。 反危机出售。今日低价。赶紧! 真实的 COMBO 市场深度功能和报价成交量图表,完全等同于原始指标。您将享受这两款产品结合为单一超级指标的力量!下面是您将得到的功能: 真实市场深度图表 股民专用工具现已在 MetaTrader 5 上可用。 真实市场深度图表 指标在图表上以直方条的形式显示可视化的市场深度,并在实时模式下刷新。 利用 真实市场深度图表 指标您可以正确评估市场请求并从图表上看到大的市场。这可以 100% 的精确剥头皮和设置持仓止损。 指标以两种相应颜色的水平直方条形式显示买和卖的请求 (买-卖)。价格图表上给定级别的显示条和它们的长度与请求的交易量相应。此外, 它指示买卖请求的最大交易量。 此指标显示买卖请求总数量作为堆积面积图。这可以评估当经过下一价位时将会执行的请求总量。买卖请求总数量也显示在图表上。 省缺, 指标显示在图表背景上, 且它不会干扰任何其它指标。当使用指标交易时, 建议使用实际交易量。
      Description The indicator uses market profile theory to show the most relevant trading zones, on a daily basis. The zones to be shown are LVN (low volume nodes) and POC (point of control). An LVN zone is one which represents price areas with the least time or volume throughout the day. Typically, these areas indicate a supply or demand initiative, and in the future, they can turn into important breakout or retracement zones. A POC zone is one which represents price areas with the most time or vo
      Owl Smart Levels MT5
      Sergey Ermolov
      4.07 (28)
      MT4版本  |   FAQ Owl Smart Levels Indicator 是一個完整的交易系統,包含 Bill Williams 的高級分形、構建正確的市場波浪結構的 Valable ZigZag 以及標記準確入場水平的斐波那契水平等流行的市場分析工具 進入市場和地方獲利。 策略的详细说明 指示灯使用说明 顾问-贸易猫头鹰助手助理 私人用户聊天 ->购买后写信给我,我会将您添加到私人聊天中,您可以在那里下载所有奖金 力量在於簡單! Owl Smart Levels 交易系統非常易於使用,因此適合專業人士和剛開始研究市場並為自己選擇交易策略的人。 策略和指標中沒有隱藏的秘密公式和計算方法,所有策略指標都是公開的。 Owl Smart Levels 允許您快速查看進入交易的信號,突出顯示下訂單的水平並向您發送有關已出現信號的通知。 優點很明顯: 清楚地顯示主要和更高時間框架的趨勢方向。 指示儀器信號的出現。 標記開單、止損設置和固定利潤的水平。 沒有多餘的,只有必要的結構! ZigZag 表示全球趨勢的方向,因此也表示貿易方向。 市場反轉點的短線清楚地表明在什麼水平上構建斐波
      Introduction to Chart Pattern MT Chart Pattern MT is a chart pattern scanner to detect the triangle pattern, falling wedge pattern, rising wedge pattern, channel pattern and so on. Chart Pattern MT uses highly sophisticated chart pattern detection algorithm. However, we have designed it in the easy to use with intuitive user interface. Chart Pattern MT will show all the patterns in your chart in the most efficient format for your trading. You do not have to do tedious manual pattern detection an
      Automatic Fibonacci Static
      Avydel Talbo Doctolero
      Discover the Power of Automatic Fibonacci Analysis! Elevate your trading strategy with our free Fibonacci Retracement Indicator – a dynamic tool designed to streamline your technical analysis and enhance your decision-making process. Key Features: Smart Automatic Drawing: Say goodbye to manual calculations! Our indicator intelligently identifies swing highs and lows, instantly drawing Fibonacci levels for you. Real-Time Updates: Stay ahead of the market with Fibonacci levels that automatically a
      FREE
      该指标将向您显示您已经为图表上的每个订单设置的 TP 和 SL 值(以该货币表示)(接近交易/订单行),这将帮助您估算每个订单的利润和损失。它还会向您显示 PIP 值。显示的格式是“我们的损益/PIP 值的货币值”。 TP 值将以绿色显示,SL 值将以红色显示。 如有任何问题或了解更多信息,请随时通过 fxlife.asia@hotmail.com 或 fxlife.asia@yahoo.com 与卖家联系 (而指标中即将加入的下一个功能是“自动或半自动TP和SL设置”,我们的客户将免费获得更新版本。谢谢...^_^) (或者如果您认为在指示中应该增加一些功能,请随时告诉我们) ========================================================
      Market Profile 3 ForexArby com
      Hussien Abdeltwab Hussien Ryad
      3.83 (12)
      Market Profile 3 MetaTrader 5 indicator  version 4.70— is a classic Market Profile implementation that can show the price density over time, outlining the most important price levels, value area, and control value of a given trading session. This indicator can be attached to timeframes between M1 and D1 and will show the Market Profile for daily, weekly, monthly, or even intraday sessions. Lower timeframes offer higher precision. Higher timeframes are recommended for better visibility. It is als
      FREE
      Cumulative Delta NG
      Anton Polkovnikov
      Cumulative delta indicator As most traders believe, the price moves under the pressure of market buying or selling. When someone redeems an offer standing in the cup, the deal is a "buy". If someone pours into the bid standing in the cup - the deal goes with the direction of "sale". The delta is the difference between purchases and sales. A cumulative delta - the difference between the cumulative sum of purchases and sales for a certain period of time. It allows you to see who is currently contr
      No Demand No Supply MT5
      Trade The Volume Waves Single Member P.C.
      No Demand No Supply   This indicator identifies   No Demand –No Supply candles to your chart and plots volume bars colored according to the signal. It can be applied to all timeframes or to a specific one only. It can also be used as regular volume indicator  with exceptional future of WEIGHTED VOLUME. Furthermore is has an alert notification, sound and email when a signals occurs. The indicator does not repaint but the alert will come on two candles back due to the definition of No Demand No Su
      Weis Waves
      Flavio Javier Jarabeck
      2.76 (17)
      The original author is David Weis, an expert in the Wyckoff Method. The Weis Wave is a modern adaptation of the 1930's Wyckoff Method, another expert in Tape Reading techniques and Chart Analysis. Weis Waves takes market volume and stacks it into waves according to price conditions giving the trader valuable insights about the market conditions. If you want to learn more about this subject you can find tons of videos in YouTube. Just look for "The Wickoff Method", "Weis Wave" and "Volume Spread
      FREE
      Volumes Direction MT5
      William Oswaldo Mayorga Urduy
      卷方向 MT5 通常,当当前音量高于前一音量时,音量指示器具有默认的颜色变化,这很重要但不是很有用。 出于这个原因,这个指标的创建是为了除了正常的交易量之外,当蜡烛看涨或看跌时,它会为它们绘制不同的颜色,默认情况下看涨的蓝色和看跌的红色,但这些颜色可以定制为 商人的味道。 不要忘记查看我的其他指标,它们将帮助您改善交易。 卷方向 MT5 通常,当当前音量高于前一音量时,音量指示器具有默认的颜色变化,这很重要但不是很有用。 出于这个原因,这个指标的创建是为了除了正常的交易量之外,当蜡烛看涨或看跌时,它会为它们绘制不同的颜色,默认情况下看涨的蓝色和看跌的红色,但这些颜色可以定制为 商人的味道。 不要忘记查看我的其他指标,它们将帮助您改善交易。
      Terra Infinity
      Ivan Simonika
      Terra Infinity is a flat indicator. This improved version of the CalcFlat indicator has three additional lines that significantly increase its effectiveness. Unlike its predecessor with two static levels, Terra Infinity adds three dynamic lines above the main histogram, which are interpreted as follows: base signal line, minimum signal line, maximum signal line. These lines are formed using the additional parameter Avg, which is the average value of the histogram. Averaging produces a line
      该产品的买家也购买
      TPSpro RFI Levels MT5
      Roman Podpora
      4.73 (11)
      指示       俄罗斯 -        英语   建议 与指示器一起使用     -       TPSpro 趋势专业版 -   MT4版本       交易中的一个关键要素是做出买卖交易工具决定的区域或水平。尽管主要参与者试图隐藏他们在市场中的存在,但他们不可避免地会留下痕迹。我们的任务是学习如何识别这些痕迹并正确解释它们。 主要功能: 向卖家和买家显示活跃区域! 该指标显示所有正确的初始买入和卖出脉冲水平/区域。激活这些水平/区域后,开始寻找切入点,水平会改变颜色并填充特定阴影。此外,还会显示箭头,以便更直观地了解情况。 显示更高时间范围内的级别/区域(MTF 模式) 添加了使用更高时间间隔显示级别/区域的功能。此外,该指标还具有自动趋势检测功能(   TPSproTREND PRO   )。 用于交易的单独专业的逐步算法。 该算法专为日内交易而设计,既可顺势交易,也可逆势交易。每个活动模板均提供详细说明。 适用于多种时间范围 。 TPSpro RFI 水平指标可用于图表上的任何时间范围,从一分钟(M1)开始一直到每月(MN)。 图形和声音警报。 该指标提供图形和声音指示
      首先,值得强调的是,这个交易系统是一个非重绘、非重画和非滞后的指标,这使得它非常适合手动和机器人交易。 在线课程,手册和下载预设。 “智能趋势交易系统 MT5”是专为新手和经验丰富的交易者量身定制的综合交易解决方案。它结合了超过 10 个优质指标,具有 7 多个强大的交易策略,使其成为适用于各种市场条件的多功能选择。 趋势跟随策略:提供精确的入场和止损管理,以有效地跟随趋势。 反转策略:识别潜在的趋势反转,使交易者能够利用区域市场的机会。 剃头策略:专为快速准确的日内交易和短期交易而设计。 稳定性:所有指标都不会重绘、不会重画和不会滞后,确保可靠的信号。 定制:支持自定义策略,以满足个人交易偏好。超过 7 种策略和组合可帮助您找到最佳策略。 信号清晰度:提供箭头信号,以指示清晰的入场和退出点。 实时警报:通过交易进出警报使交易者保持了解。 深入分析:提供更高时间框架的趋势分析和实时交易监控。 自适应颜色编码:利用蜡烛颜色编码来显示成交量、趋势和反转蜡烛信号。通过蜡烛颜色分析市场方向。 “智能趋势交易系统 MT5”赋予交易者必要的工具,以便在各种市场条件下做出明智和战略性的交易决策。无论
      Atomic Analyst MT5
      Issam Kassas
      4.42 (19)
      首先值得强调的是,该交易指标是非重绘、非延迟的指标,这使其成为手动和机器人交易的理想选择。 用户手册:设置、输入和策略。 Atomic Analyst是一种PA价格行动指标,利用价格的力量和动量来寻找市场上更好的机会。配备了高级过滤器,可帮助去除噪音和假信号,并提高交易潜力。使用多层复杂的指标,Atomic Analyst扫描图表,并将复杂的数学计算转化为任何初学者都能理解并用来做出一致交易决策的简单信号和颜色。 “Atomic Analyst”是专为新手和经验丰富的交易者量身定制的综合交易解决方案。它将高级指标和一流功能融合为一体的交易策略,使其成为所有类型交易者的多功能选择。 日内交易和剥头皮策略:专为快速准确的日内交易和短期交易而设计。 日内和摆动交易策略:可用作追求价格大幅波动的日内和摆动交易者的可靠工具。 多货币和市场:凭借其可靠的精度,在不同的工具和市场上运作。 多个时间框架:可在多个时间框架上使用,性能良好。 稳定性:所有指标均不重绘、不重绘和不滞后,确保可靠的信号。 信号清晰度:提供箭头信号,用于清晰的入场和出场点。 实时警报:通过交易入场、SL和TP警报通知交
      Gold Stuff mt5
      Vasiliy Strukov
      4.92 (166)
      Gold Stuff mt5 是专为黄金设计的趋势指标,也可用于任何金融工具。 该指标不会重绘,也不会滞后。 推荐时间框架 H1。 购买后立即联系我以获得设置和个人奖励!   你可以在我的个人资料中找到它。   重要! 购买后立即与我联系,以获得说明和奖金!   您可以免费收到我们的强力支持和趋势扫描指标的副本,请私信。大部头书!   设置 绘制箭头 - 打开关闭。 在图表上绘制箭头。 警报 - 打开关闭声音警报。 电子邮件通知 - 打开关闭。 电子邮件通知。 Puch-notification - 打开关闭。 推送通知。 接下来,调整色域。 Gold Stuff mt5 是专为黄金设计的趋势指标,也可用于任何金融工具。 该指标不会重绘,也不会滞后。 推荐时间框架 H1。 购买后立即联系我以获得设置和个人奖励!   设置 绘制箭头 - 打开关闭。 在图表上绘制箭头。 警报 - 打开关闭声音警报。 电子邮件通知 - 打开关闭。 电子邮件通知。 Puch-notification - 打开关闭。 推送通知。 接下来,调整色域。
      FX Power MT5 NG
      Daniel Stein
      5 (5)
      通过 mql5 和 Telegram 上 的晨间简报获取每日市场更新,包括详细信息和屏幕截图 ! FX Power MT5 NG 是我们长期以来非常受欢迎的货币强度计算器 FX Power 的下一代产品。 这款下一代强度计算器能提供什么?您所喜爱的原版 FX Power 的所有功能 附加功能 黄金/XAU 强度分析 更精确的计算结果 可单独配置的分析周期 可自定义计算限制,以获得更好的性能 为希望查看更多信息的用户提供特殊的多实例设置 无尽的图形设置,可在每个图表中设置您最喜欢的颜色 无数的通知选项,让您再也不会错过任何重要信息 采用 Windows 11 和 macOS 风格的全新圆角设计 神奇的移动指标面板 FX Power 主要功能 所有主要货币的完整强势历史 所有时间框架内的货币强弱历史 所有经纪商和图表的计算结果完全相同 100% 可靠的实时计算 -> 无重绘 可通过下拉列表选择分析时段 通过自定义模式单独配置分析时段 可在一个图表中使用多个实例 可移动 FX Power 显示屏(通过拖放) 适用于高分辨率 QHD、UHD 和 4K 显示器 自动终端配置 针对平板电脑
      FxaccurateLS
      Shiv Raj Kumawat
      WHY IS OUR FXACCCURATE LS MT5 THE PROFITABLE ? PROTECT YOUR CAPITAL WITH RISK MANAGEMENT Gives entry, stop and target levels from time to time. It finds Trading opportunities by analyzing what the price is doing during established trends. POWERFUL INDICATOR FOR A RELIABLE STRATEGIES We have made these indicators with a lot of years of hard work. It is made at a very advanced level. Established trends provide dozens of trading opportunities, but most trend indicators completely ignore them!
      Trend Screener Pro MT5
      STE S.S.COMPANY
      4.87 (63)
      使用趋势筛选指标释放趋势交易的力量:由模糊逻辑和多货币系统提供支持的终极趋势交易解决方案! 使用趋势筛选器(由模糊逻辑提供支持的革命性趋势指标)提升您的趋势交易。 它是一个强大的趋势跟踪指标,结合了超过 13 种高级工具和功能以及 3 种交易策略,使其成为使您的 Metatrader 成为趋势分析器的多功能选择。 限时优惠:趋势筛选指标终身仅需 50 美元。 ( 原价 250$ ) (优惠延长) 体验趋势筛选器 100% 无需重新绘制的准确性,确保您的交易决策不受过去价格变化的影响。 释放多时间框架和多货币功能的多功能性,使您能够以无与伦比的信心在外汇、商品、加密货币和指数领域进行交易。 利用 Trend Screener 的综合策略套件增强您的交易: - 趋势跟踪策略和趋势延续策略 :趋势筛选器的趋势跟踪策略提供清晰的趋势延续信号,让您有效捕捉趋势走势并管理风险。 - 反转策略和早期入场点策略 :趋势筛选器的反转策略可检测市场方向的潜在变化,使您能够预测趋势反转并利用疲弱的市场趋势。通过早期入场点,您可以在潜在的趋势变化之前定位自己 获取可观的利润。 - 倒卖策略: 趋势筛选器的倒卖
      Quantum Trend Sniper
      Bogdan Ion Puscasu
      4.8 (49)
      介绍   量子趋势狙击指标 ,突破性的 MQL5 指标,正在改变您识别和交易趋势反转的方式!由拥有超过13年交易经验的资深交易员团队开发,     量子趋势狙击指标   旨在通过其创新的方式以极高的准确度识别趋势反转,将您的交易之旅推向新的高度。 ***购买量子趋势狙击指标,即可免费获得量子突破指标!*** 当量子突破指标识别出趋势反转时,它会向您发出警报和信号箭头,并建议您三个止盈水平。 它既适合新手交易者,也适合专业交易者。 量子 EA 通道:       点击这里 MT4版本:       点击这里 建议: 时间范围: 所有时间范围。为了获得最佳结果,我们建议在 M15、M30 和 H1 时间范围内使用它。 货币对:欧元兑美元、英镑兑美元、澳元兑美元、欧元兑英镑、, EURAUD,  XAUUSD 账户类型:ECN、Raw 或 Razor,点差极低 经纪时间:任意 经纪商:IC Markets、Pepperstone with Raw 和 Razor 的点差最低 建议止损:50 点 建议止盈水平:20 点、50 点和
      首先,值得强调的是,这个交易工具是非重绘、非重画和非滞后的指标,非常适合专业交易。 在线课程,用户手册和演示。 智能价格行动概念指标是一个非常强大的工具,既适用于新手,也适用于经验丰富的交易者。它将超过20个有用的指标合并到一个指标中,结合了高级交易思想,如内圈交易员分析和智能资金概念交易策略。该指标侧重于智能资金概念,提供有关大型机构交易方式的见解,帮助预测它们的动向。 它在流动性分析方面尤其擅长,有助于理解机构的交易方式。它擅长预测市场趋势,并仔细分析价格波动。通过将您的交易与机构策略对齐,您可以更准确地预测市场走向。该指标多才多艺,擅长分析市场结构,识别重要的订单区块,并识别各种模式。 它擅长识别BOS和CHoCH等模式,理解动量的转变,并突出显示供需强劲的关键区域。它还擅长发现强大的不平衡,并分析价格创造更高高点或更低低点的模式。如果您使用斐波那契回撤工具,该指标可以满足您的需求。它还可以识别相等的高点和低点,分析不同的时间框架,并通过仪表板显示数据。 对于使用更高级策略的交易者,该指标提供了工具,如公平价值差指标和优惠和折扣区域的识别。它特别关注高时间框架订单
      该仪表盘显示所选符号的最新可用谐波形态,因此您可以节省时间并提高效率 /  MT4 版本 。 免费指标:  Basic Harmonic Pattern 指标列 Symbol:   显示所选符号 Trend:     看涨或看跌 Pattern:    形态类型(Gartley、蝴蝶、蝙蝠、螃蟹、鲨鱼、Cypher 或 ABCD) Entry:     入口价格 SL: 止损价 TP1: 第一止盈价 TP2: 第二次获利价格 TP3: 第三次获利价格 Current price:    当前价格 Age (in bars):   最后绘制的模式的年龄 主要输入 Symbols :   从 "28 种主要货币对 "或 "选定符号 "中选择。 Selected Symbols :   希望监控的符号,用逗号分隔("EURUSD,GBPUSD,XAUUSD")。如果您的经纪商为货币对设置了后缀或前缀,您必须在以下两个参数中添加(货币对前缀或货币对后缀)。 Max Iteration:   调整模式的最大迭代次数(如果该值越小,则模式越少,性能越快;如果该值越大,则模式越多,性能
      Entry Points Pro for MT5
      Yury Orlov
      4.46 (124)
      这款指标用于 MT5,可提供准确的入场交易信号,且无重绘。 它可应用在任何金融资产:外汇、加密货币、贵金属、股票、指数。 它将提供极其精准的评估,并告诉您何时开仓和平仓的最佳时机。 观看 视频 (6:22),其中包含一个仅处理单一信号的示例,该信号即可值回指标购价! 大多数交易者在 Entry Points Pro 指标的帮助下,在第一个交易周内即改善了他们的交易结果。 订阅我们的 Telegram 群 ! Entry Points Pro 指标的益处。 入场信号无重绘 如果信号出现,并得到确认,则它不会再消失;不像是重绘指标,它会导致重大的财产损失,因为它们可以在显示信号后再将其删除。 无差错开仓 指标算法可令您找到入场交易(买入或卖出资产)的理想时机,从而提高每位交易者的成功率。 Entry Points Pro 可操作任何资产 它允许您在 MT5 平台上交易任何经纪商的加密货币、股票、贵金属、指数、大宗商品和货币。 提供任何方向的信号 Entry Points Pro 指标提供针对任意价格走势的入场交易信号 - 上涨、下跌或横盘(横向)。
      Advanced Supply Demand MT5
      Bernhard Schweigert
      4.5 (14)
      任何新手或专业交易者的最佳解决方案! 该指标是一款独特、高质量、且价格合理的交易工具,因为我们已经整合了许多专有功能和新公式。 依据此更新,您将能够显示双重时间帧区域。 您不仅可以显示一个较高的时间帧,还可以同时显示图表时间帧,加上更高的时间帧:显示嵌套时区。 供需双方所有交易者都会喜欢它。 :) 重要信息披露 高级供需的最大潜力,请访问 https://www.mql5.com/zh/blogs/post/720245   想象您的交易如何得以改善,是因为您能够精准定位入场或目标位吗? 构建于新的底层算法,它可以更轻松地识别出买卖双方之间的潜在失衡。 这是因为它以图形方式展示供需最强劲区域,及其过去的表现(显示旧区域)。 这些功能旨在帮助您更轻松地发现最佳入场区域和价位。 现在您可以针对您的交易品种和时间帧来优化和编辑区域强度! 高级供需指标适用于所有产品和时间帧。 它是一个新的公式,非常新的功能是两个区域强度函数可由用户输入进行调整! 这在交易中是一大优势。 当您学习如何使用专有功能,例如带有价格游离最小 X 因子的区域强度时,您能够判断该区域强劲与否。 供需区域用作警报触发器
      Auto Order Block with break of structure based on ICT and Smart Money Concepts (SMC) Futures Break of Structure ( BoS )             Order block ( OB )            Higher time frame Order block / Point of Interest ( POI )    shown on current chart           Fair value Gap ( FVG ) / Imbalance   -  MTF      ( Multi Time Frame )    HH/LL/HL/LH  -  MTF      ( Multi Time Frame )  Choch  MTF      ( Multi Time Frame )  Volume Imbalance     ,  MTF          vIMB Gap’s Power of 3 Equal High
      TPA True Price Action indicator reveals the true price action of the market makers through 100% non-repainting signals strictly at the close of a candle! TPA shows entries and re-entries, every time the bulls are definitely stronger than the bears and vice versa. Not to confuse with red/green candles. The shift of power gets confirmed at the earliest stage and is ONE exit strategy of several. There are available now two free parts of the TPA User Guide for our customers. The first "The Basics"
      AT Forex Indicator MT5
      Marzena Maria Szmit
      5 (4)
      The AT Forex Indicator MT5 is a sophisticated trading tool designed to provide traders with a comprehensive analysis of multiple currency pairs. This powerful indicator simplifies the complex nature of the forex market, making it accessible for both novice and experienced traders. AT Forex Indicator uses advanced algorithms to detect trends, patterns and is an essential tool for traders aiming to enhance their forex trading performance. With its robust features, ease of use, and reliable signal
      Fxaccurate TCT
      Shiv Raj Kumawat
      WHY IS OUR FXACCCURATE TCT MT5 THE PROFITABLE ? Gives entry, stop and target levels from time to time. It finds Trading opportunities by analyzing what the price is doing during established trends. We have made these indicators with a lot of years of hard work. It is made at a very advanced level. Established trends provide dozens of trading opportunities, but most trend indicators completely ignore them! The trend reveals trading indicator represents an average of 10 different trades per trend
      MetaForecast M5
      Vahidreza Heidar Gholami
      5 (2)
      MetaForecast能够根据价格数据中的谐波来预测和可视化任何市场的未来走势。虽然市场不总是可预测的,但如果价格中存在模式,MetaForecast可以尽可能准确地预测未来。与其他类似产品相比,MetaForecast通过分析市场趋势可以生成更精确的结果。 输入参数 Past size (过去的尺寸) 指定MetaForecast用于创建生成未来预测模型的柱数量。该模型以一条黄色线绘制在所选柱上。 Future size (未来的尺寸) 指定应预测的未来柱数量。预测的未来以粉色线表示,并在其上绘制了蓝色回归线。 Degree (程度) 此输入确定了MetaForecast将在市场上进行的分析级别。 Degree 描述  0 对于程度0,建议使用较大的值来设置“过去的尺寸”输入,以覆盖价格中的所有高峰、低谷和细节。  1 (建议的) 对于程度1,MetaForecast可以理解趋势,并通过较小的“过去的尺寸”生成更好的结果。  2 对于程度2,除了趋势,MetaForecast还可以识别反转点。对于大于1的程度,必须使用较高的“细节”和“噪音减少”输入值。  大于2 不建议使用大
      FX Volume MT5
      Daniel Stein
      4.93 (14)
      通过 mql5 和 Telegram 上 的 " 晨间简报 "获取每日市场更新,包括详细信息和屏幕截图 ! 外汇交易量(FX Volume)是第一个也是唯一一个从经纪商角度真正洞察市场情绪的交易量指标。 直接在您的图表上看到这些信息是真正改变游戏规则和突破性的交易解决方案。 受益于独特的市场数据洞察,如 比率(Ratios )显示货币多头和空头头寸的比率(百分比 比率变化 显示所选时间段内的多头比率及其百分比变化 总交易量 显示货币的总交易量(多头和空头),以手为单位 多头 交易量显示货币所有多头头寸的交易量 空头 交易量显示所有货币空头头寸的交易量 净多头 显示净多头交易量,即所有多头头寸减去所有空头头寸(以手为单位)。 净多头百分比 显示货币净多头交易量的变化 请阅读我们的基本教程 -> "如何使用外汇交易量进行交易 " 获取更多信息,如常见问题、交易技巧和教程视频,请访问我们的 外汇交易量公共信息频道 请 安装并运行 SI Connect 以建立与我们数据中心的持续连接 背景信息 我们都知道,外汇是一个分散的市场。这就是为什么我们必须打破常规思维,开发一个独
      Gartley Hunter Multi
      Siarhei Vashchylka
      5 (8)
      Gartley Hunter Multi - An indicator for searching for harmonic patterns simultaneously on dozens of trading instruments and on all possible timeframes. Manual (Be sure to read before purchasing) | Version for MT4 Advantages 1. Patterns: Gartley, Butterfly, Shark, Crab. Bat, Alternate Bat, Deep Crab, Cypher 2. Simultaneous search for patterns on dozens of trading instruments and on all possible timeframes 3. Search for patterns of all possible sizes. From the smallest to the largest 4. A
      Matrix Arrow Indicator MT5
      Juvenille Emperor Limited
      5 (12)
      矩阵箭头指标 MT5   是一种独特的 10 合 1 趋势,遵循   100% 非重绘多时间框架指标 ,可用于所有符号/工具: 外汇 、 商品 、 加密货币 、 指数 、 股票 。 Matrix Arrow Indicator MT5 将在其早期阶段确定当前趋势,从多达 10 个标准指标中收集信息和数据,它们是: 平均定向运动指数 (ADX) 商品渠道指数 (CCI) 经典 Heiken Ashi 蜡烛 移动平均线 移动平均收敛散度 (MACD) 相对活力指数 (RVI) 相对强弱指数 (RSI) 抛物线SAR 随机振荡器 威廉姆斯的百分比范围 当所有指标给出有效的买入或卖出信号时,相应的箭头将打印在图表上,在下一根蜡烛/柱线开盘时,指示强劲的上升趋势/下降趋势。用户可以选择使用哪些指标,并可以单独调整每个指标的参数。 Matrix Arrow Indicator MT5 仅从选定的指标中收集信息,并仅根据其数据打印箭头。   Matrix Arrow Indicator MT5   还可以为所有新信号发送终端、推送通知或电子邮件警报。无论您是黄牛、日内交易者还是波段交易者, Mat
      TrendMaestro5
      Stefano Frisetti
      note: this indicator is for METATRADER4, if you want the version for METATRADER5 this is the link:  https://www.mql5.com/it/market/product/108106 TRENDMAESTRO ver 2.4 TRENDMAESTRO recognizes a new TREND in the bud, he never makes mistakes. The certainty of identifying a new TREND is priceless. DESCRIPTION TRENDMAESTRO identifies a new TREND in the bud, this indicator examines the volatility, volumes and momentum to identify the moment in which there is an explosion of one or more of these data a
      Boom and Crash Trend Detector is a  Non-Repaint   MT5 trading system usually being sold for 50 0$ . Most people use this for Deriv but can be used to forex too. The boom and crash spike indicator is a spike detecting software, with Multiple features, these features include. Spike Alert ( from 10 to 100-second warning before spike) Continues spike Alert (for double or continuous spikes at a time) supports all Boom/crash Indices M6 time frame works best here . Bigger time frame trend pointer f
      我们创新的基本烛台形态仪表盘专为自动识别图表上的盈利烛台形态而设计。该仪表盘使用先进的算法实时扫描价格图表,并检测从经典到复杂的各种烛台形态。此外,它还有一个易于使用的界面,允许您在不同的时间框架上对检测到的形态进行可视化,从而轻松做出明智的决策/ MT4 版本 免费指标:   Basic Candlestick Patterns 包括谐波形态 看涨形态 Hammer  Inverse hammer Bullish engulfing Morning star 3 White soldiers 看跌形态 Hanging man Shooting star Bearish engulfing Evening star 3 Black crows 指标列 Symbol:   将显示所选符号 Pattern:   形态类型(锤子型、反向锤子型、看涨吞没型......) Bar:   自检测到该形态以来所经过的柱状图数量 Age (in minutes):   自检测到该形态以来的年龄 主要输入 Symbols :   从 "28 种主要货币对 "或 "选定符号
      Golden Spikes Premium
      Kwaku Bondzie Ghartey
      5 (1)
      Golden Spikes Detector Acknowledgement and Dedications:  The name of this indicator was Inspired by an Original; Mr Grant Koopman; a Knowledgeable and experienced Synthetics trader. I dedicate this indicator to Mr Grant.  Overview: The Golden Spikes Premium is a groundbreaking trading indicator meticulously crafted for the Boom and Crash indices on the Deriv market. Tailored to meet the needs of discerning traders, this powerful tool operates exclusively on the one-minute timeframe, providin
      Trend Forecaster
      Alexey Minkov
      5 (6)
      The Trend Forecaster indicator utilizes a unique proprietary algorithm to determine entry points for a breakout trading strategy. The indicator identifies price clusters, analyzes price movement near levels, and provides a signal when the price breaks through a level. The Trend Forecaster indicator is suitable for all financial assets, including currencies (Forex), metals, stocks, indices, and cryptocurrencies. You can also adjust the indicator to work on any time frames, although it is recommen
      该指标分析过去的价格走势以预测市场的买入和卖出压力:它可以通过回顾过去并分析当前价格附近的价格高峰和低谷来做到这一点。这是最先进的确认指示器。 [ 安装指南 | 更新指南 | 故障排除 | 常见问题 | 所有产品 ] 预测市场的买卖压力 避免陷入购买狂潮的陷阱 无需设置也无需优化 该指标在所有时间范围内均有效 极易使用 潜在的供求价格是指许多市场参与者可能持有其亏损头寸,希望在收支平衡时清算的价格。因此,在这些价格水平上有大量活动。 供需双方都量化为数字 如果供应高于需求,则可以预期卖压 如果供应低于需求,则可以预期购买压力 当供应高于需求时寻找空头 当供应低于需求时寻找多头 输入参数 范围:当前价格附近的波动率乘数,用于搜索过去的高峰和低谷。 作者 ArturoLópezPérez,私人投资者和投机者,软件工程师,零零点交易解决方案的创始人。
      TrendDecoder Premium MT5
      Christophe Pa Trouillas
      5 (3)
      确定范围和下一步可能的走势    |     获得早期信号和趋势强度   |     在反转之前获得明确的退出   |     了解价格将测试哪些斐波水平   |  非重绘、非延迟指标 - 手动和自动交易的理想选择 - 适用于所有资产和所有时间单位 剩余 5 份,售价 $69   - 然后 $99 购买后,请联系我以获取您的 免费 TrendDECODER_Scanner MT4 版本: 点击此处 使用 BladeSCALPER 和 PowerZONES 获取我们的完整方法 它是什么? TrendDECODER 集多种创新于一身,使趋势监测变得简单易行。 投射趋势线(Projective TrendLine )--快速参考即将到来的趋势 实时趋势线(RealTime TrendLine) 与投射趋势线(Projective TrendLine)的对比 - 与之前的同方向走势相比,市场是加速还是放缓? 实时趋势线交叉 -   趋势正在偏离轨道 使用 GreyBox -   市场不再是趋势并进入新的过渡序列 使用 DecoderSignals 和 Blue/Orang
      TW Trend Sniper
      Altan Karakaya
      介绍 “TW Trend Sniper” 指标,这是一种强大的指标,通过使用 “Trade Wizards” 独家指标公式以及价格行为、货币交易时段检测、斐波那契和检测功能以及高精度人工智能噪音消除方法,用于识别主要趋势。该策略由由经验丰富的交易员和专家程序员组成的 “Trade Wizards ” 设计,现在可供交易员使用,以推进您的交易之旅。 更多详情请阅读文章《TW Trend Sniper》   。 该产品使用以下策略提供完整的信号: 价格行为(智能货币规定) 特定时间段(由人工智能检测) 斐波那契水平和动态支撑和阻力 移动平均线 交易精灵独家指标公式 AI去噪方法 技术规格: 它不会以任何方式改变信号、止损和止盈以及指标本身 不重绘! 它可以高精度地检测变化趋势 它以图表中的闪光和入口点的警报的形式向您发出警告。 提供带有 TP 和 SL 的信号(无需修改或篡改) 它提供了 4 个利润目标领域 它在安全的地方提供 SL 关闭信号的能力 信号呈现表及过去目标的计算(可在测试仪中进行测试) 可用于所有货币 可以在时间范围 5 及以上使用 建议: 根据您的风险
      成交量突破震荡指标是一种以震荡指标的形式将价格变动与成交量趋势相匹配的指标。 我想将成交量分析整合到我的策略中,但大多数成交量指标都令我失望, 例如 OBV、资金流量指数、A/D,还有成交量加权 Macd 和许多其他指标。 因此,我为自己编写了这个指标,我对它的实用性感到满意,因此我决定将其发布到市场上。 主要特点: 它突出显示了价格在成交量增加(突破)支持下朝某个方向移动的阶段。 它突出显示了成交量增加停止并因此市场收缩的阶段。 它突出显示了价格和成交量均未移动的阶段,尤其是在时间范围(<=15 分钟)的日内交易中,因此市场已为未来的运行做好准备。 当其他 EA 发出的虚假信号不受交易量增加的支持时,会将其过滤掉。 它使趋势和区间阶段的可视化变得非常容易 输入参数: 计算设置: 计算类型:快速、正常、慢速,用于监控短期、中期和长期,保持在同一时间范围内。 计算周期:计算周期 交易量设置: 交易量类型:TickVolume(主要用于外汇)和 RealVolume(用于股票市场) 信号设置: 信号周期:信号线周期 突破水平:突破信号的阈值水平 警报设置 警报类型:收盘价或即
      作者的更多信息
      The 1 2 3 Pattern Scanner MT5
      Reza Aghajanpour
      5 (18)
      ** All Symbols x All Timeframes scan just by pressing scanner button ** *** Contact me  to send you instruction and add you in "123 scanner group" for sharing or seeing experiences with other users. After 17 years of experience in the markets and programming, Winner indicator is ready. I would like to share with you! Introduction The 123 Pattern Scanner indicator with a special enhanced algorithm is a very repetitive common pattern finder with a high success rate . Interestingly, this Winner in
      Market Structure
      Reza Aghajanpour
      4.85 (26)
      ** All Symbols x All Timeframes scan just by pressing scanner button ** *** Contact me  to send you instruction and add you in "Market Structure group" for sharing or seeing experiences with other users. Introduction: Market structure is important for both new and professional traders since it can influence the liquidity and price action of a market (Breakout and Retest). It’s also one of the most commonly used techniques to understand trends, identify potential reversal points, and get a feel f
      Market Structure MT5
      Reza Aghajanpour
      5 (3)
      **   All Symbols   x   All Timeframes   scan just by pressing scanner button ** *** Contact me  to send you instruction and add you in "Market Structure group" for sharing or seeing experiences with other users. Introduction: Market structure is important for both new and professional traders since it can influence the liquidity and price action of a market. It’s also one of the most commonly used techniques to understand trends, identify potential reversal points, and get a feel for current mar
      ABCD Pattern Scanner
      Reza Aghajanpour
      5 (19)
      ** All Symbols x All Timeframes scan just by pressing scanner button ** *** Contact me  to send you instruction and add you in "ABCD scanner group" for sharing or seeing experiences with other users. Introduction This indicator scans AB=CD retracement patterns in all charts. The ABCD is the basic foundation for all harmonic patterns and highly repetitive with a high success rate . The ABCD Scanner indicator is a scanner reversal ABCD pattern that helps you identify when the price is about to ch
      The 1 2 3 Pattern Scanner
      Reza Aghajanpour
      4.8 (54)
      ** All Symbols x All Timeframes scan just by pressing scanner button ** After 17 years of experience in the markets and programming, Winner indicator is ready. I would like to share with you! *** Contact me  to send you instruction  and add you in "123 scanner group" for sharing or seeing experiences with other users. Introduction The 123 Pattern Scanner indicator with a special enhanced algorithm is a very repetitive common pattern finder with a high success rate . Interestingly, this Winner in
      M W Scanner MT5
      Reza Aghajanpour
      5 (6)
      **   All Symbols   x   All Timeframes   scan just by pressing scanner button ** *** Contact me  to send you instruction and add you in "M W Scanner group" for sharing or seeing experiences with other users. Introduction: Double Top(M) and Double Bottom(W) is a very repetitive common type of price reversal patterns. Double Top resembles M pattern and indicates bearish reversal whereas Double Bottom resembles W pattern and indicates a bullish reversal that they have  high win  rate. The M W Scanne
      Trend Reversal MT4
      Reza Aghajanpour
      5 (6)
      **   All Symbols   x   All Timeframes   scan just by pressing scanner button ** *** Contact me  to send you instruction and add you in "Trend Reversal group" for sharing or seeing experiences with other users. Introduction: Trendlines are the most famous technical analysis in trading . Trend lines continually form on the charts of markets across all the different timeframes providing huge opportunities for traders to jump in and profit on the action. In the other hand,  The trend line reversal s
      M W Scanner
      Reza Aghajanpour
      5 (8)
      **   All Symbols   x   All Timeframes   scan just by pressing scanner button ** *** Contact me  to send you instruction and add you in "M W Scanner group" for sharing or seeing experiences with other users. Introduction: Double Top(M) and Double Bottom(W) is a very repetitive common type of price reversal patterns. Double Top resembles M pattern and indicates bearish reversal whereas Double Bottom resembles W pattern and indicates a bullish reversal that they have  high win  rate. The M W Scanne
      Wolfe Wave Scanner MT5
      Reza Aghajanpour
      5 (5)
      **  All Symbols  x  All Timeframes  scan just by pressing scanner button ** *** Contact me  to send you instruction and add you in "Wolfe Wave Scanner group" for sharing or seeing experiences with other users. Introduction: A Wolfe Wave is created with five-wave patterns in price. It shows supply and demand and a fight towards a balance price. T hese waves of price actions can help traders identify the boundaries of   the trend . Also  It helps forecast how the price will move in the near futu
      RSI Divergences Scanner MT5
      Reza Aghajanpour
      4.73 (11)
      ** All Symbols x All Timeframes scan just by pressing scanner button ** ***Contact me to send you instruction and add you in "RSI scanner group" for sharing or seeing experiences with other users. Introduction RSI divergence is a main technique used to determine trend reversing when it’s time to sell or buy because prices are likely to drop or pick in the charts. The RSI Divergence indicator can help you locate the top and bottom of the market. This indicator finds Regular divergence for pullba
      Harmonic Pattern Scanner
      Reza Aghajanpour
      4.67 (15)
      ** All Symbols x All Time frames scan just by pressing scanner button ** *** Contact me  to send you instruction and add you in "Harmonic Scanner group" for sharing or seeing experiences with other users. Introduction Harmonic Patterns are best used to predict turning point. Harmonic Patterns give you high win rate and high opportunities for trade in during one day. This indicator detects the best and successful patterns base on Harmonic Trading books . The Harmonic Patterns Scanner Scans All ch
      QM Pattern Scanner MT5
      Reza Aghajanpour
      5 (3)
      Contact me  to send you instruction and add you in group. QM (Quasimodo) Pattern is based on Read The Market(RTM) concepts. The purpose of this model is to face the big players of the market (financial institutions and banks), As you know in financial markets, big traders try to fool small traders, but RTM prevent traders from getting trapped. This style is formed in terms of price candles and presented according to market supply and demand areas and no price oscillator is used in it. RTM con
      MACD Divergence Scanner
      Reza Aghajanpour
      5 (2)
      ** All Symbols x All Time frames scan just by pressing scanner button ** *** Contact me  to send you instruction and add you in "Divergence group" for sharing or seeing experiences with other users. Introduction MACD divergence is a main technique used to determine trend reversing when it’s time to sell or buy because prices are likely to drop or pick in the charts. The MACD Divergence indicator can help you locate the top and bottom of the market. This indicator finds Regular divergence for pul
      ABCD Pattern Scanner MT5
      Reza Aghajanpour
      5 (9)
      ** All Symbols x All Timeframes scan just by pressing scanner button ** *** Contact me  to send you instruction and add you in "ABCD scanner group" for sharing or seeing experiences with other users. Introduction This indicator scans AB=CD retracement patterns in all charts. The ABCD is the basic foundation for all harmonic patterns and highly repetitive with a high success rate . The ABCD Scanner indicator is a scanner reversal ABCD pattern that helps you identify when the price is about to cha
      QM Pattern Scanner MT4
      Reza Aghajanpour
      4.8 (5)
      Contact me  to send you instruction and add you in group. QM (Quasimodo) Pattern is based on Read The Market(RTM) concepts. The purpose of this model is to face the big players of the market (financial institutions and banks), As you know in financial markets, big traders try to fool small traders, but RTM prevent traders from getting trapped. This style is formed in terms of price candles and presented according to market supply and demand areas and no price oscillator is used in it. RTM con
      Head and Shoulder MT4
      Reza Aghajanpour
      5 (4)
      **   All Symbols   x   All Timeframes   scan just by pressing scanner button ** *** Contact me  to send you instruction and add you in "Head & Shoulders Scanner group" for sharing or seeing experiences with other users. Introduction: Head and Shoulders   Pattern  is a very repetitive common type of price reversal patterns. The pattern appears on all time frames and can be used by all types of traders and investors.   The  Head and Shoulders  Scanner indicator  Scans All charts just by pressing o
      Swing Scanner MT5
      Reza Aghajanpour
      5 (6)
      **   All Symbols   x   All Time frames   scan just by pressing scanner button ** *** Contact me  to send you instruction and add you in "Swing scanner group" for sharing or seeing experiences with other users. Introduction: Swing Scanner   is the indicator designed to detect swings in the direction of the trend and possible reversal swings. The indicator studies several price and time vectors to track the aggregate trend direction and detects situations in which the market is oversold or overbou
      Swing Scanner
      Reza Aghajanpour
      4.6 (20)
      ** All Symbols x All Time frames scan just by pressing scanner button ** *** Contact me  to send you instruction and add you in "Swing scanner group" for sharing or seeing experiences with other users. Introduction: Swing Scanner is the indicator designed to detect swings in the direction of the trend and possible reversal swings. The indicator studies several price and time vectors to track the aggregate trend direction and detects situations in which the market is oversold or overbought and r
      Wolfe Wave Scanner MT4
      Reza Aghajanpour
      4.56 (9)
      **  All Symbols  x  All Timeframes  scan just by pressing scanner button ** *** Contact me  to send you instruction and add you in "Wolfe Wave Scanner group" for sharing or seeing experiences with other users. Introduction: A Wolfe Wave is created with five-wave patterns in price. It shows supply and demand and a fight towards a balance price. T hese waves of price actions can help traders identify the boundaries of   the trend . Also  It helps forecast how the price will move in the near future
      All Divergence Scanner MT4
      Reza Aghajanpour
      4.93 (15)
      ** All Symbols x All Timeframes scan just by pressing scanner button ** *** Contact me  to send you instruction and add you in "All Divergences scanner group" for sharing or seeing experiences with other users. Introduction Divergence is a main technique used to determine trend reversing when it’s time to sell or buy because prices are likely to drop or pick in the charts. All Divergence indicator can help you locate the top and bottom of the market. This indicator finds Regular divergences for
      Channel Scanner MT5
      Reza Aghajanpour
      5 (1)
      **   All Symbols   x   All Timeframes   scan just by pressing scanner button ** *** Contact me  to send you instruction and add you in "Channel Scanner group" for sharing or seeing experiences with other users. Introduction: The Channel pattern is described as the area located between two trend lines. This area is used for a measure of a trading range. In this case, the upper trend line connects price highs while the lower trend line connects price lows. Also when it comes to breakout points, it
      Order Block Scanner
      Reza Aghajanpour
      5 (2)
      ** All Symbols x All Time frames scan just by pressing scanner button ** *** Contact me  to send you instruction and add you in "Order Block group" for sharing or seeing experiences with other users. Introduction: The central banks and financial institutions mainly drive the market, Order block is considered a market behavior that indicates accumulation of orders from banks and institutions, then the market tends to make a sharp move(Imbalance) on either side once the order block is completed. O
      Harmonic Patterns Scanner MT5
      Reza Aghajanpour
      4.2 (5)
      ** All Symbols x All Time frames scan just by pressing scanner button ** *** Contact me  to send you instruction and add you in "Harmonic Scanner group" for sharing or seeing experiences with other users. Introduction Harmonic Patterns are best used to predict turning point. Harmonic Patterns give you high win rate and high opportunities for trade in during one day. This indicator detects the best and successful patterns based on Harmonic Trading concepts . The   Harmonic Patterns   Scanner   Sc
      AI Next Level
      Reza Aghajanpour
      5 (1)
      The next generation G P T AI model quickly gained significant attention with its broad range of capabilities and versatility, We used its expertise in assisting prediction prices in formulating and applying improved trading strategies. Our AI core is capable of extracting data insights from financial news, Sentiment Analysis , specific formula, Oscillators and indicators status and other unstructured data sources. This information can then be used in conjunction with other datasets to make our
      Introduction RSI divergence is a main technique used to determine trend reversing when it’s time to sell or buy because prices are likely to drop or pick in the charts. The RSI Divergence indicator can help you locate the top and bottom of the market. This indicator finds Regular divergence for pullback the market and also finds hidden RSI Divergence to show continuing trend. This indicator shows divergence on the RSI that is a strong hint for an excellent entry point and finds immediately with
      FREE
      RSI Divergence Scanner
      Reza Aghajanpour
      4.46 (13)
      ** All Symbols x All Timeframes scan just by pressing scanner button ** *** Contact me  to send you instruction and add you in "RSI scanner group" for sharing or seeing experiences with other users. Introduction RSI divergence is a main technique used to determine trend reversing when it’s time to sell or buy because prices are likely to drop or pick in the charts. The RSI Divergence indicator can help you locate the top and bottom of the market. This indicator finds Regular divergence for pu
      EA Gold Avatar
      Reza Aghajanpour
      5 (4)
      Gold Avatar is a Fully Automated for Trading XAUUSD/Gold. It will be 300$, only the first 4 sales are 199$. ** New Update = Version 3 ** Live signal monitoring: myfxbook.com/portfolio/gold-avatar/10941196 Contact me immediately after the purchase to send you instruction and add you in group. Default Settings for XAUUSD M15 FEATURES: Easy-to-use, just add EA on chart without any setting. News Filter and Auto GMT Time are  supported XAUUSD - M15 Sets are provided  Limited number of Buyers
      Market Heartbeat
      Reza Aghajanpour
      5 (7)
      Market Heartbeat in your hand! Introduction The Market Heartbeat indicator with a special enhanced algorithm (volume, money flow, cycle of market and a secret value) is a very repetitive trend finder with a high success rate . Interestingly, this Winner indicator indicates that the trend has changed its direction or the end of a trend retracement or even appears at the range market. The Market Heartbeat can use in scalping trading or trend trading. It finds immediately with alarm, notification a
      **   All Symbols   x   All Timeframes   scan just by pressing scanner button ** *** Contact me  to send you instruction and add you in "Head & Shoulders Scanner group" for sharing or seeing experiences with other users. Introduction: Head and Shoulders   Pattern  is a very repetitive common type of price reversal patterns.   The pattern appears on all time frames and can be used by all types of traders and investors.   The  Head and Shoulders  Scanner indicator  Scans All charts just by pressing
      MACD Divergences Scanner MT5
      Reza Aghajanpour
      4.25 (4)
      ** All Symbols x All Time frames scan just by pressing scanner button ** *** Contact me  to send you instruction and add you in "Divergence group" for sharing or seeing experiences with other users. Introduction MACD divergence is a main technique used to determine trend reversing when it’s time to sell or buy because prices are likely to drop or pick in the charts. The MACD Divergence indicator can help you locate the top and bottom of the market. This indicator finds Regular divergence for pul
      筛选:
      toulong
      39
      toulong 2024.08.07 06:25 
       

      Indicateur super très sympa

      Ekaterina Rachel Keren Brooke
      427
      Ekaterina Rachel Keren Brooke 2024.07.23 20:14 
       

      very good!!

      31416
      333
      31416 2024.06.18 07:03 
       

      I find it useful :)

      shifuoogway
      149
      shifuoogway 2024.02.23 08:26 
       

      This is a hidden gem. I came across this indicator after using Reza's "The 123 Pattern Scanner" which is nicely priced with many users and good reviews. I liked what I saw there and thought the Trend Reversal indicator might be an interesting addition to my trading environment. Not many reviews or comments at the time. I took the punt. Although having only used the Trend Reversal indicator for a short period, I'm pretty impressed. In the 9 hours since the beginning of trade today, 23 Feb 2024, the indicator made five calls on GBPUSD M1 with an 80% success rate where success is having the opportunity to quickly eliminate risk at breakeven then having the opportunity to take profits, of course depending on one's exit strategy. On another note, I wanted a shorter notification string for the 123 indicator to reduce information overflow. Reza liked that suggestion and provided a new option that day. That's what I called a great service!

      Olesya
      139
      Olesya 2023.03.30 14:57 
       

      用户没有留下任何评级信息

      Reza Aghajanpour
      86255
      来自开发人员的回复 Reza Aghajanpour 2023.03.30 18:35
      Thank you for your warm feedback. ⛱️🏖️🥇🌹🙏
      Enjoy your trading.⭐⭐⭐⭐⭐
      回复评论
      版本 1.8 2024.09.26
      -Added TP levels in push notification
      版本 1.7 2024.05.11
      - Added Statistic dashboard
      - Fixed an issue
      版本 1.6 2024.05.10
      - Added TP Levels
      版本 1.5 2024.04.15
      - Added symbol for scan in input setting
      - Fixed some issues
      版本 1.4 2023.08.11
      - Improved Strategy Tester
      版本 1.3 2023.03.03
      - Fixed a bug
      版本 1.2 2023.02.05
      - Added new option : Select Time Frames for scan in input setting
      版本 1.1 2023.01.29
      - Enhanced Printing Message