Forex Sword Indicator
- 指标
- Elias Mtwenge
- 版本: 1.0
- 激活: 20
WARNING!! THIS SWORD IS TOO SHARP!
ONLY 10 COPIES LEFT FOR THE NEXT PRICE TO BE 8,000$ FOR UNLIMITED PLAN.
Dear traders I am very glad once again to introduce to you my other tool called "Forex Sword Indicator". In short this tool is meant to give you an edge over the market that you have been waiting for so long. Now, here it is. It is a very very simple tool but yet a dangerous sword. I call it a Holy grail indicator!. I will not talk a lot about this tool. Just let the tool speak by itself in-front of your eyes!
I am not going to say that this tool acts like a magnet or it has some sort of Super powers but what I can say just let the indicator speak by itself and you will speak about it after you experience what it will have done for you. I am not saying it will make you rich overnight no! what I can say is just give it a chance and see what will happen in-front of your eyes!
NOTE: YOU DON'T NEED A COMPLEX TOOL TO SUCCEED. WHAT YOU NEED IS THE SWORD (THE VERY SHARP EDGE!). TRADING SHOULD NOT BE COMPLICATED BY HAVING 10 INDICATORS ON YOUR CHART. YOU JUST NEED A TOOL WITH A SHARP EDGE!!!
Purpose
- Of course for making money!
Made for who?
- Of course for struggling traders and serious businessmen and women.
Is it worth it?
- Try and see how it performs miracle in-front of your eyes!
Design
- Not complex. No stress. It is too simple just lines
Inputs
- No complicated inputs
Markets
- All markets but most recommended is Forex
Pairs
- All Forex Pairs
Timeframes
- Works on all timeframes
Trading Strategy?
- All trading styles or strategy can be used.
When do you open a buy trade?
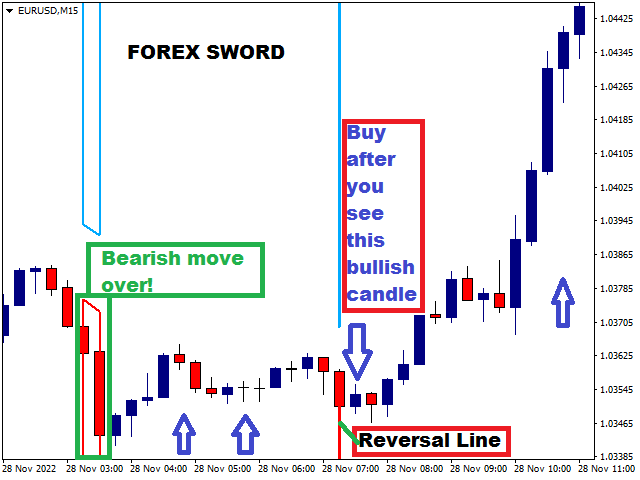
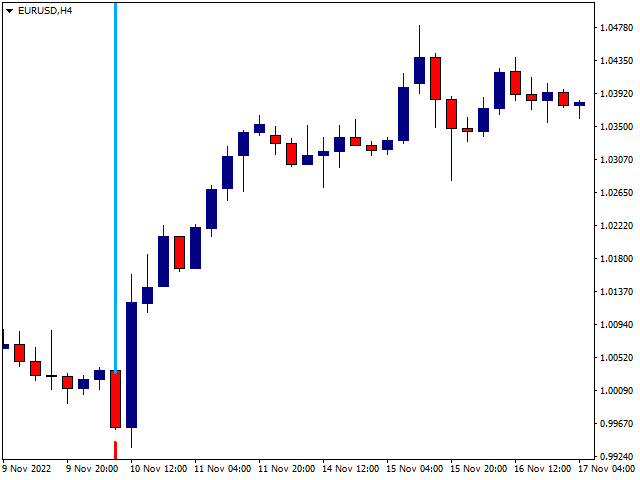
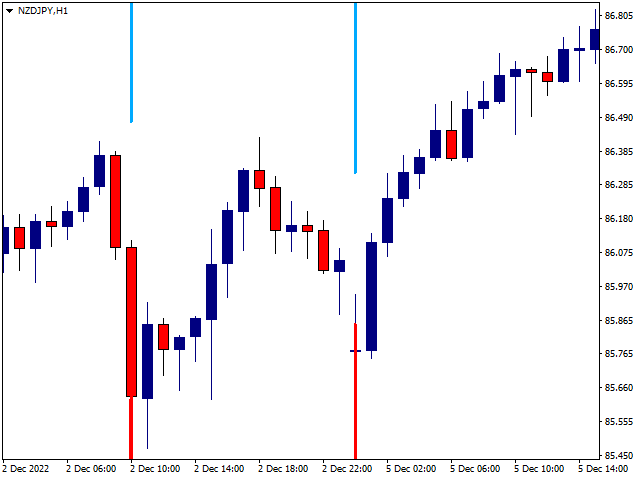
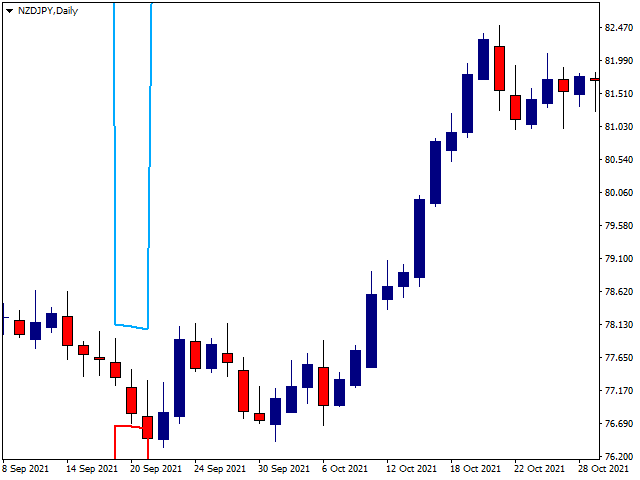
- You open a buy trade after you see a vertical blue red line then followed by a bullish candle. Remember to check the screenshots for more details.
When do you open a sell trade?
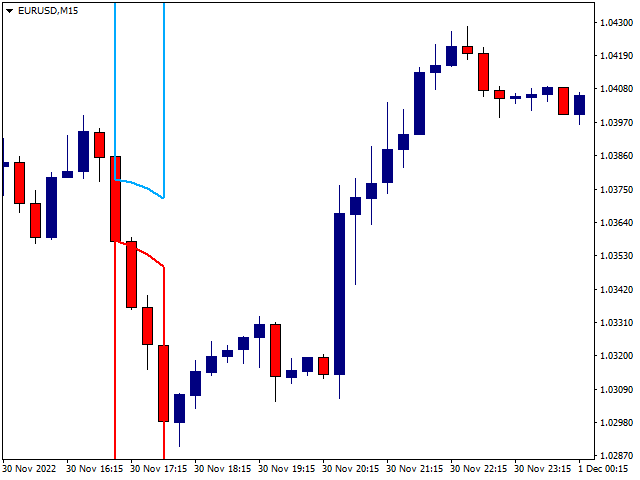
- You open a sell trade after you see blue red lines joined at the middle separately by either a blue or red line. Normally a good selling time is when you see this kind of lines at the top or near the top of the bullish move. Remember to check the screenshots for more and clear info.
- I will also add a video to explain more.
When to stay out of the market with this tool?
- You have to stay out of the market when you see a series of several lines happening close to each other and especially this happens in a down trend. You will wait until you see non joined blue red line then followed by bullish candles. This will be the best time to make a buy trade.
Last Word
Don't spoil the legitimacy of this tool by trying to act as a gambler with it hoping to make huge sum of gain in short time. Take time learn it, try it and enjoy it. Not taking enough time to learn about this tool may result to unexpected losses. Be careful your capital is at risk and you are responsible for your trading actions! Otherwise I wish you the best of the best experience with this tool.
If you think you need more help you may send me a text message and I will be glad to help! All the best.


