• 概述
  • 评论 (3)
  • 评论 (32)
  • 新特性

Price Action Entry Alerts

5
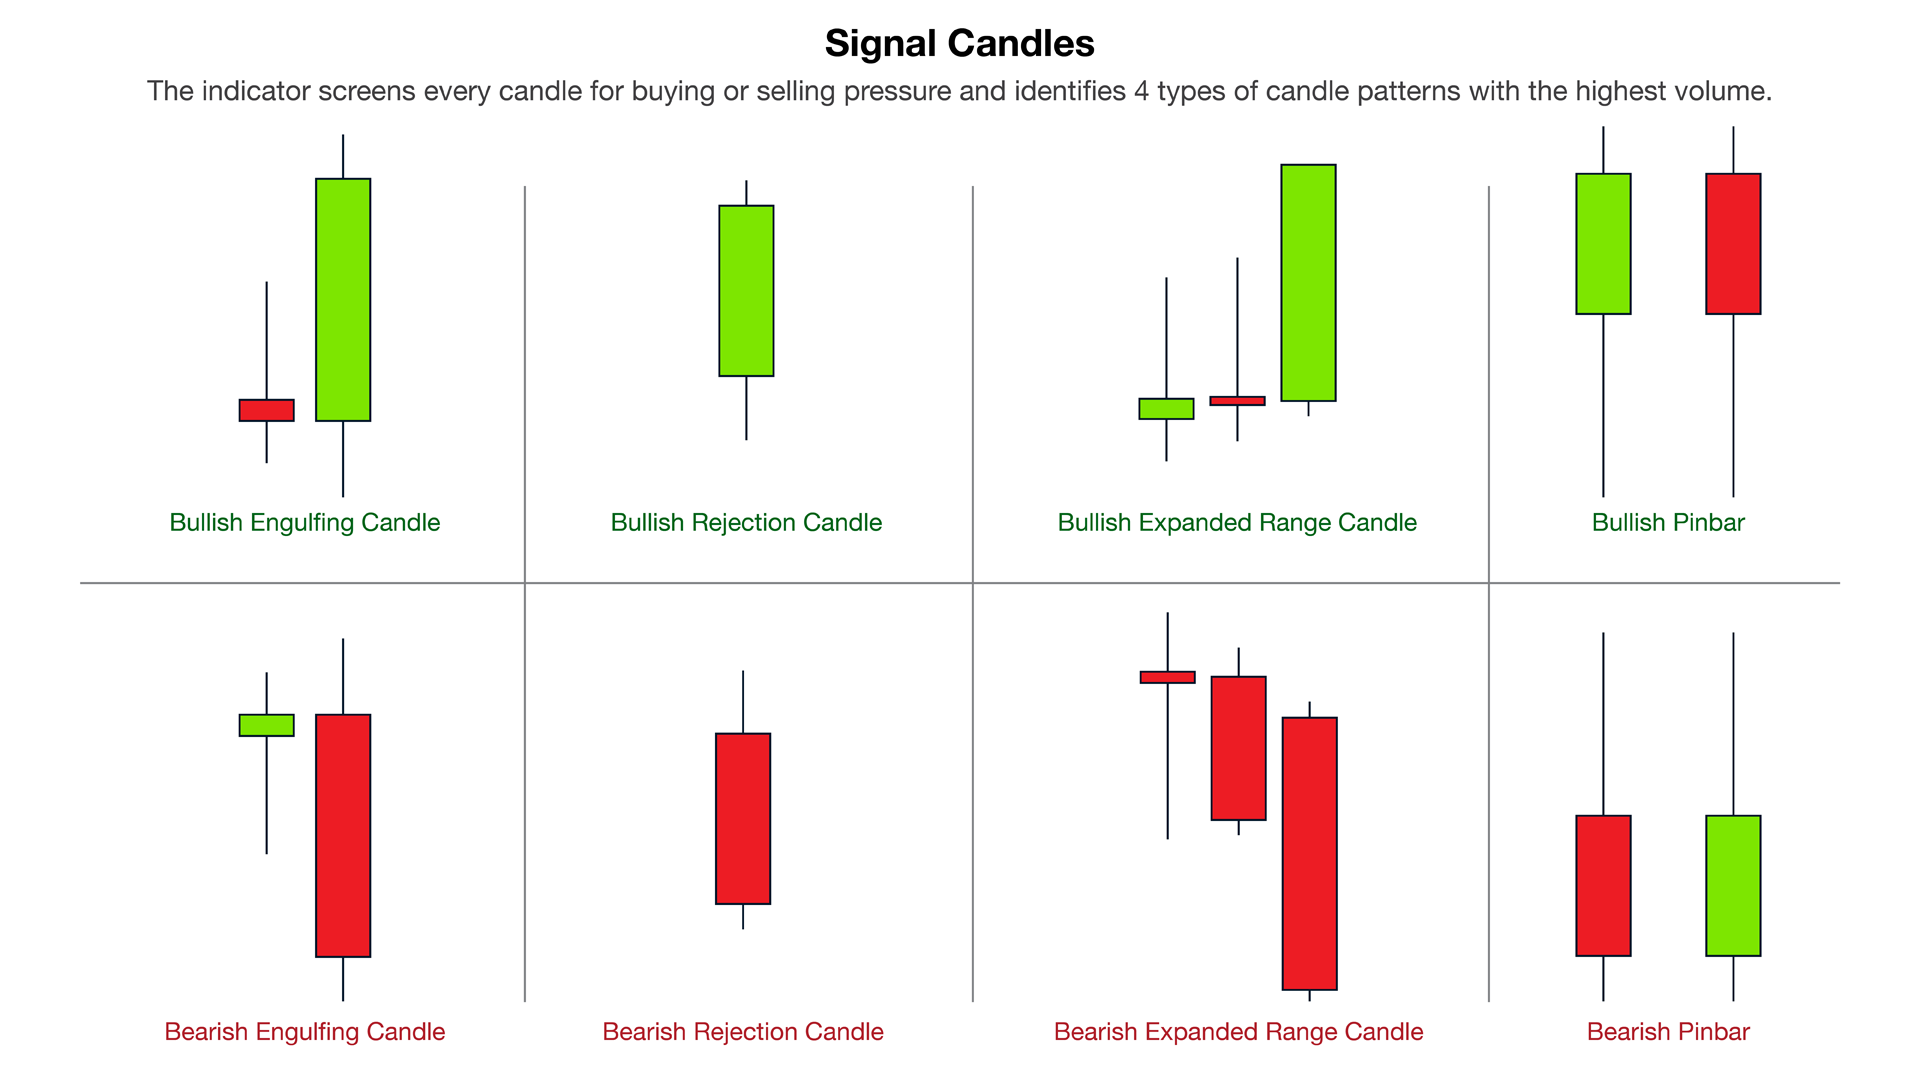
该指标筛选每个柱的买入或卖出压力,并识别 4 种具有最高交易量的蜡烛形态。然后使用多个线性过滤器过滤这些蜡烛以显示买入或卖出信号。结合更高的时间框架方向以及在高交易量时段进行交易时,信号效果最佳。所有过滤器都是可定制的并且独立工作。单击按钮即可查看单个方向的信号。
该指标还包含最重要的价格行为和智能货币概念,可以帮助您的决策过程。信号和交易教育集于一工具之中。

特征
  • 信号不会重新绘制。
  • 识别吞没蜡烛、拒绝蜡烛、扩展范围蜡烛和 Pinbar 蜡烛。
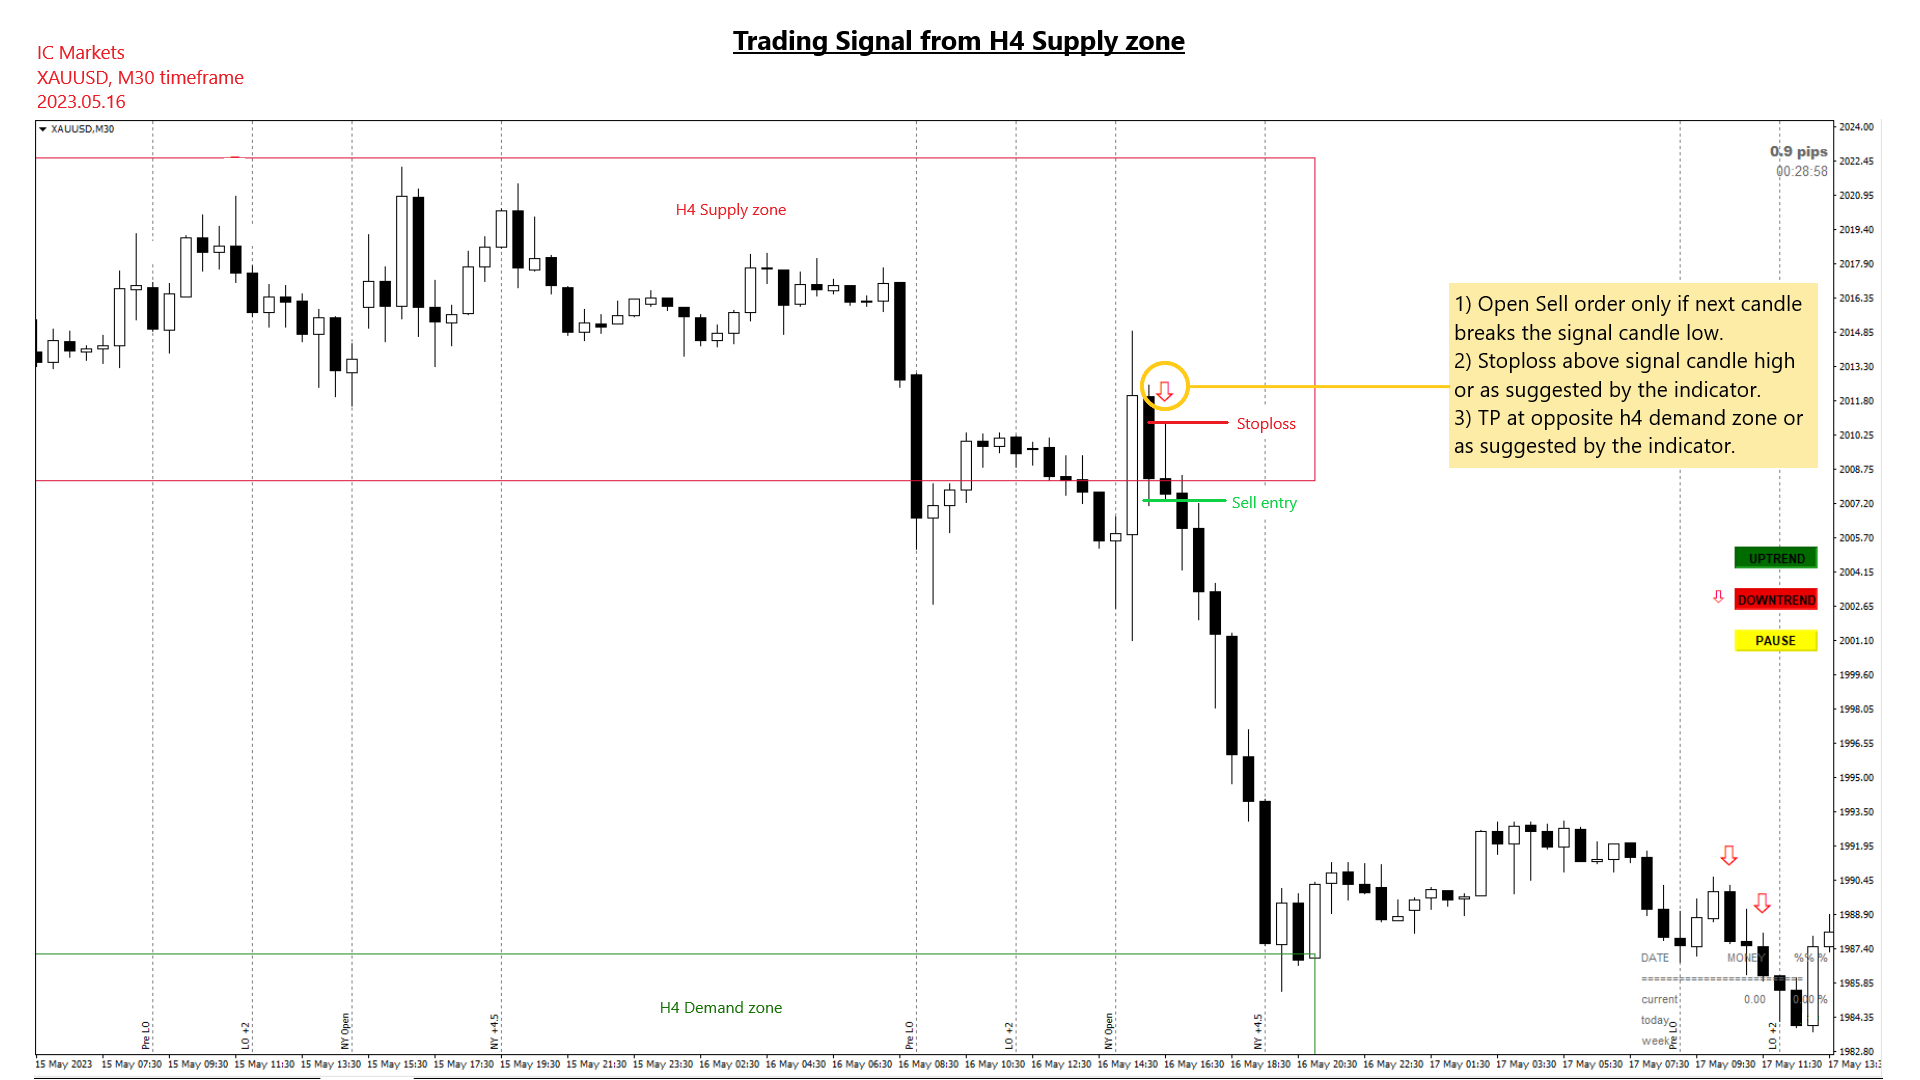
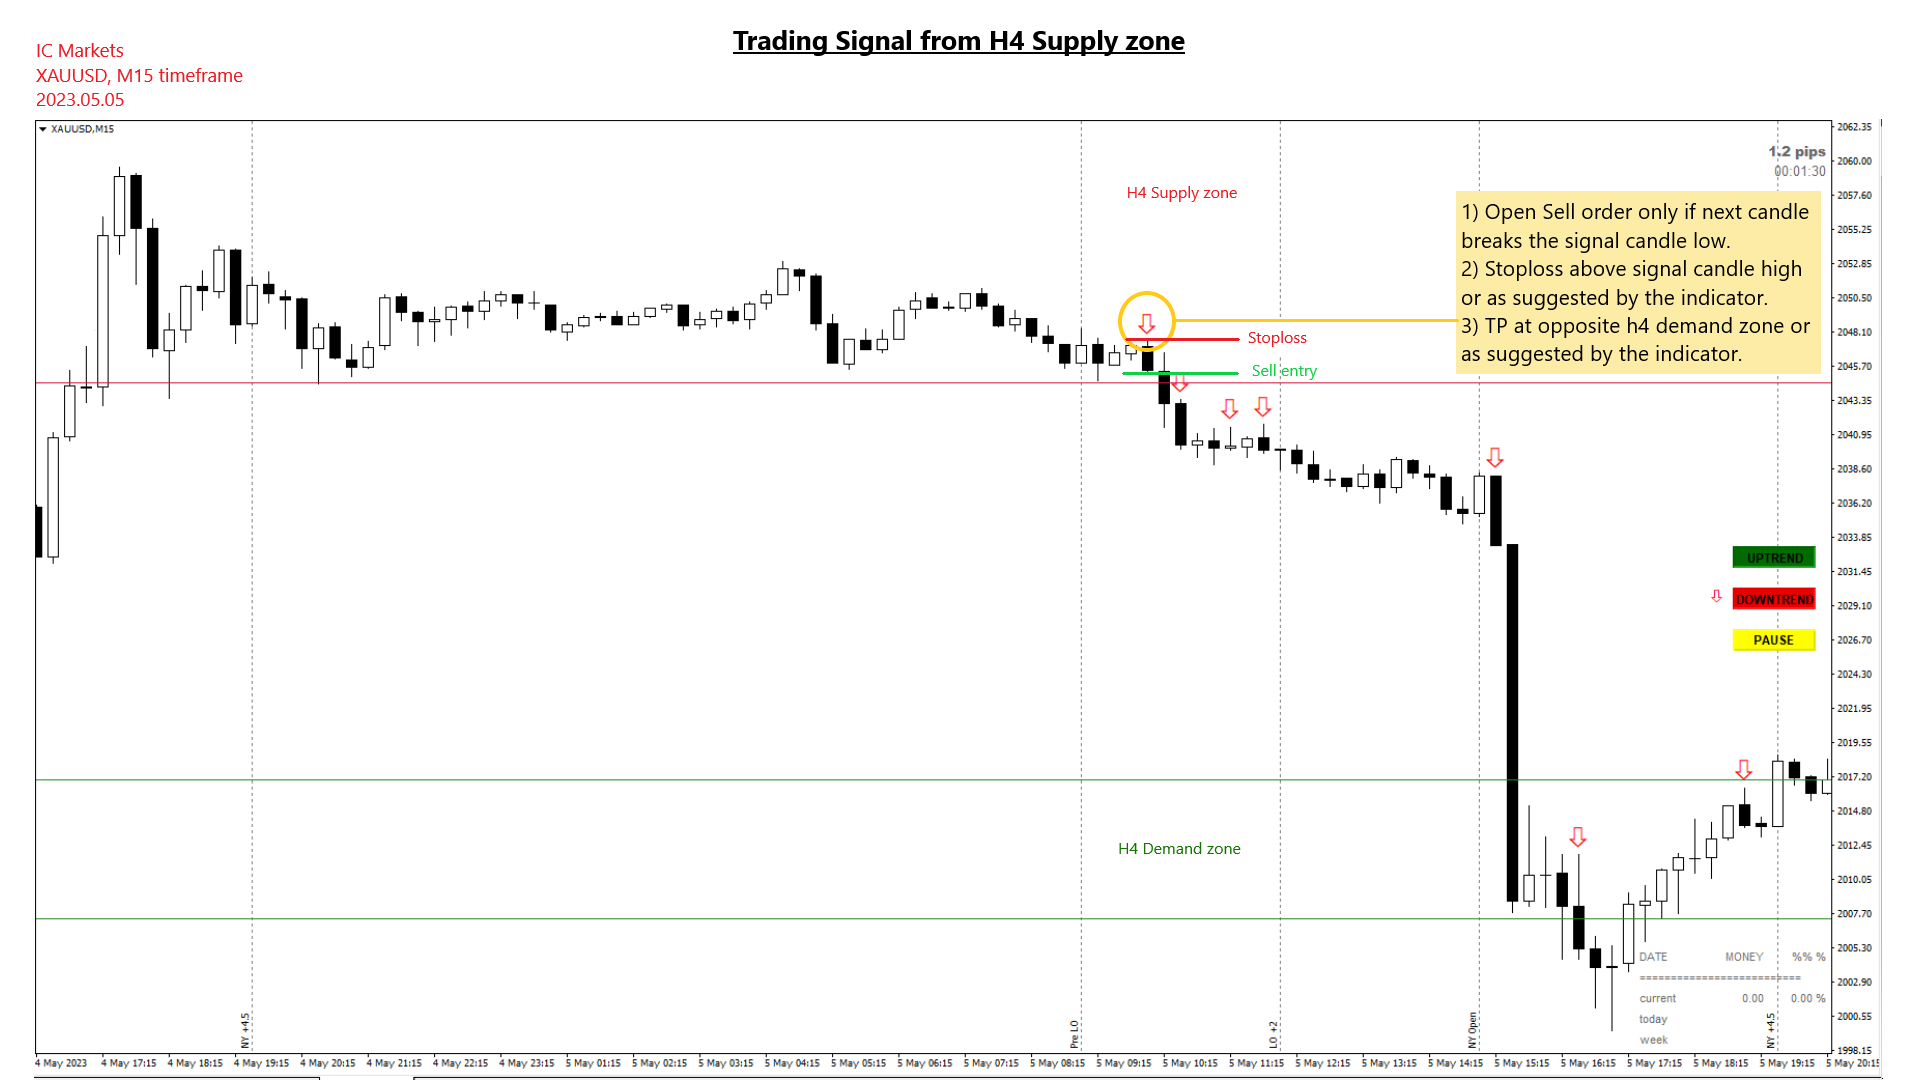
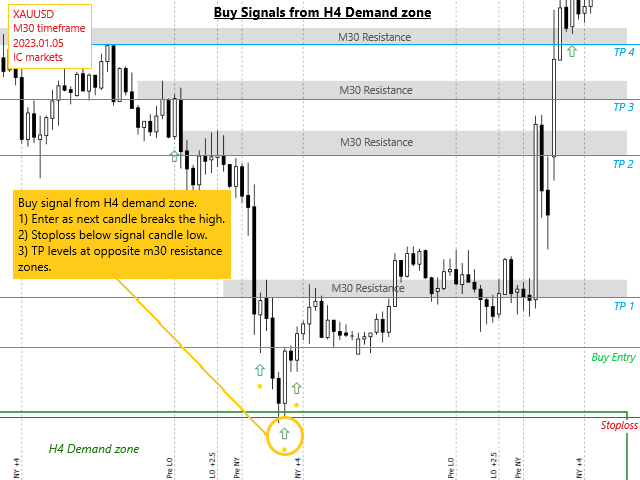
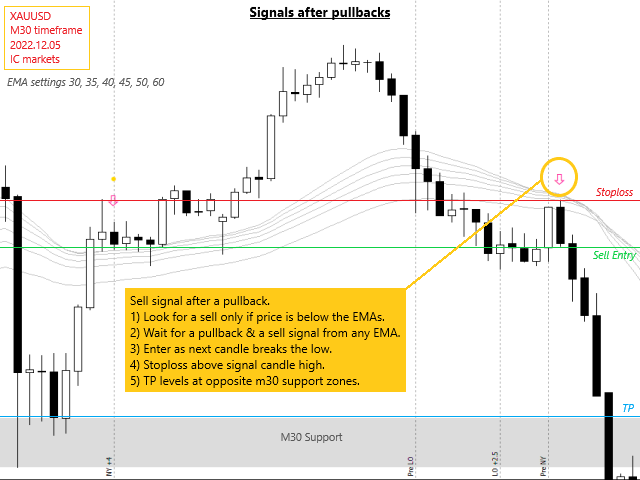
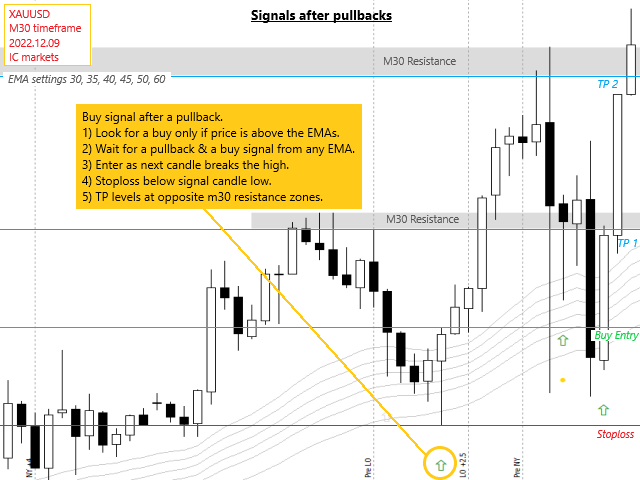
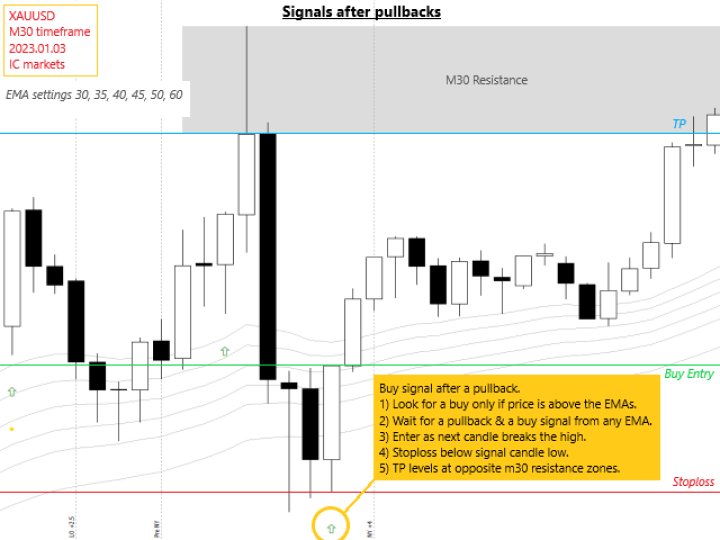
  • 显示每个有效信号的多个入场点、止损和多个止盈水平。
  • 按高容量会话进行过滤。
  • 按支撑/阻力位和蜡烛结构过滤。
  • 按 MACD 柱状图过滤。
  • ICT 买方和卖方流动性水平(亚洲突袭/伦敦突袭/犹大摇摆)。
  • 洁净空间或间隙检测。
  • 识别停止搜寻级别。
  • 基于纯粹的价格行为自动绘制支撑/阻力位。
  • 前一日高点和前日低点。
  • 心理数字和整点、半点和四分之一点的图表水平。
  • 显示基于动态移动平均线的价格交叉和回调。
  • 每日开盘价。
  • 识别 HH、HL、LL 和 LH 点。
  • 内置蜡烛倒计时和符号传播。
  • 内置损益信息面板。

私人导师小组访问。

包括教育、分析和支持(仅英文版)。

警告!!!

  1. 如果您不能或不想阅读用户手册,请勿购买。用户手册仅提供英文版本。
  2. 在购买之前,请在策略测试器上测试免费版本,并熟悉每个设置及其工作原理。
  3. 我强烈建议租用 1 个月并进行广泛测试,看看它是否适合您的交易风格。
  4. 您必须在模拟账户上测试此工具 2-3 周,然后才能在真实账户上使用。

重要的!!!

  1. 购买后请在mql5私信索要用户手册和我的自由贸易计划。
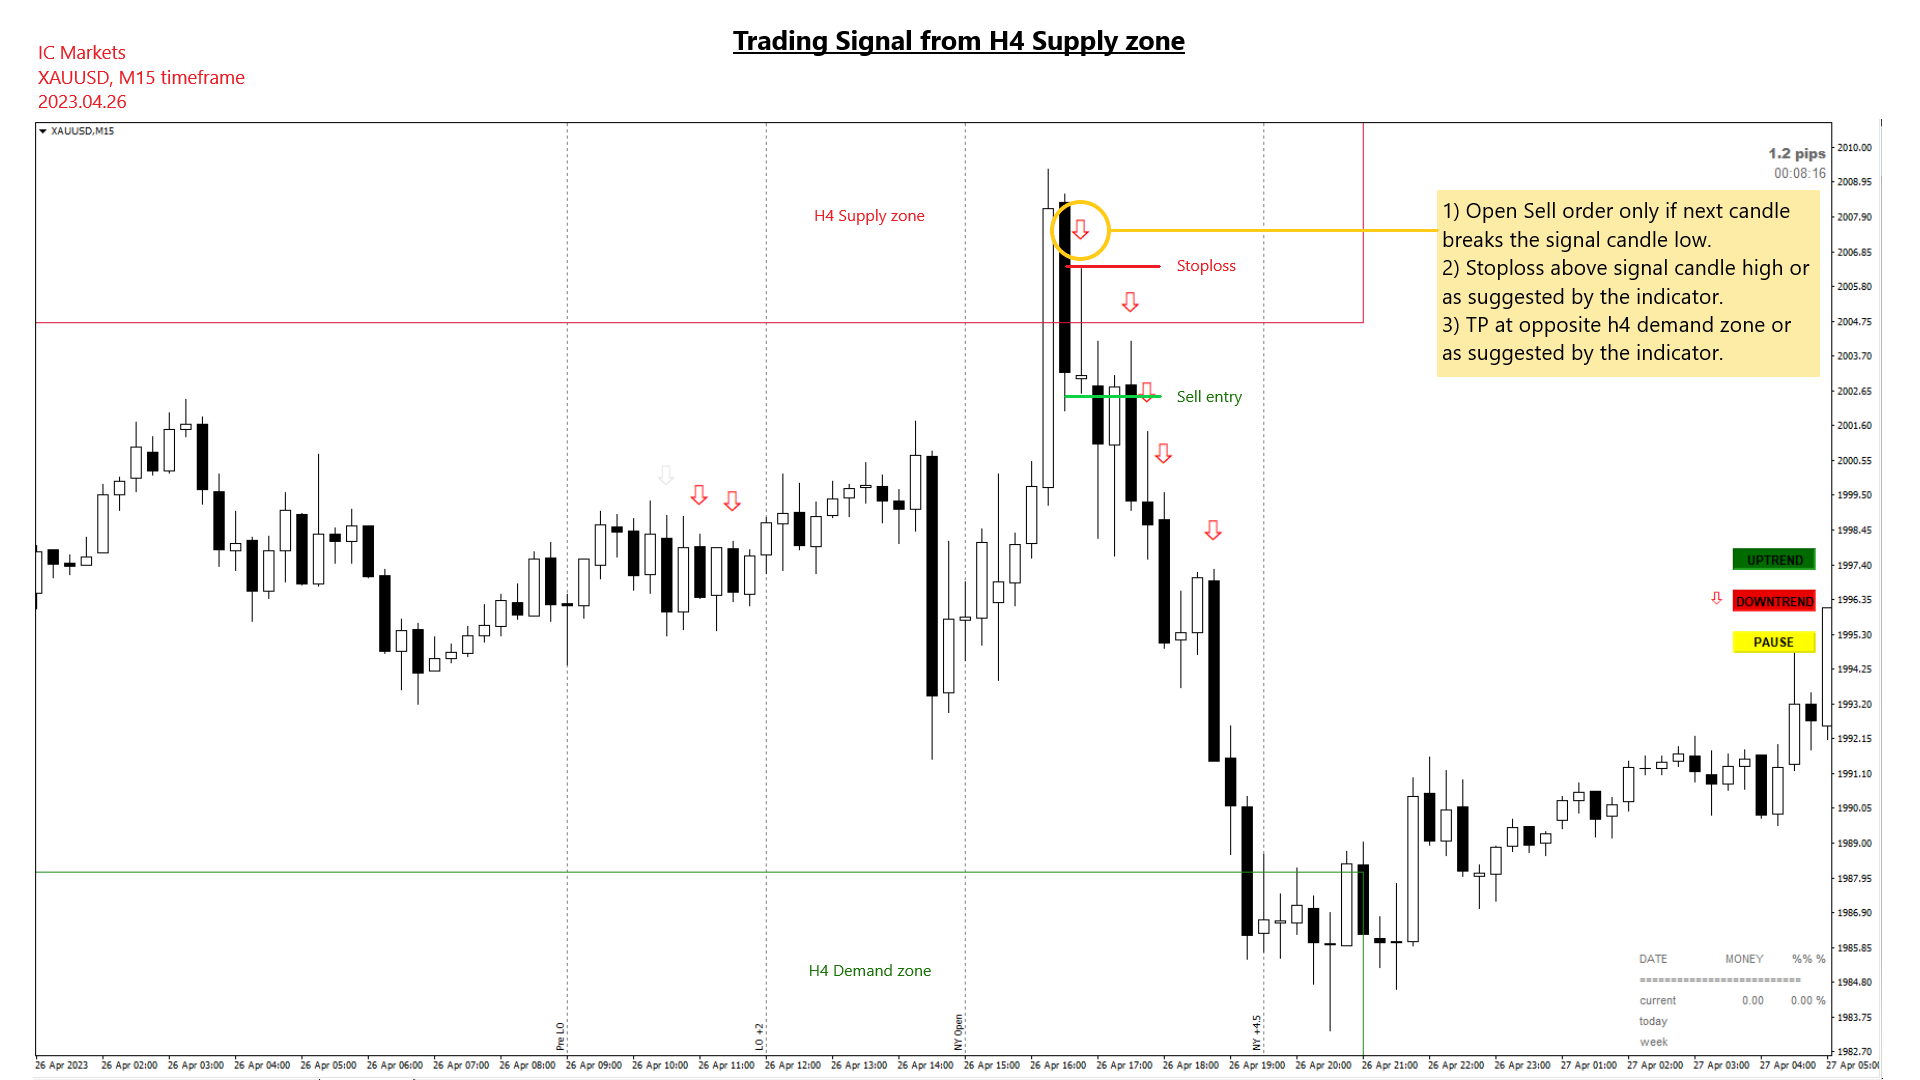
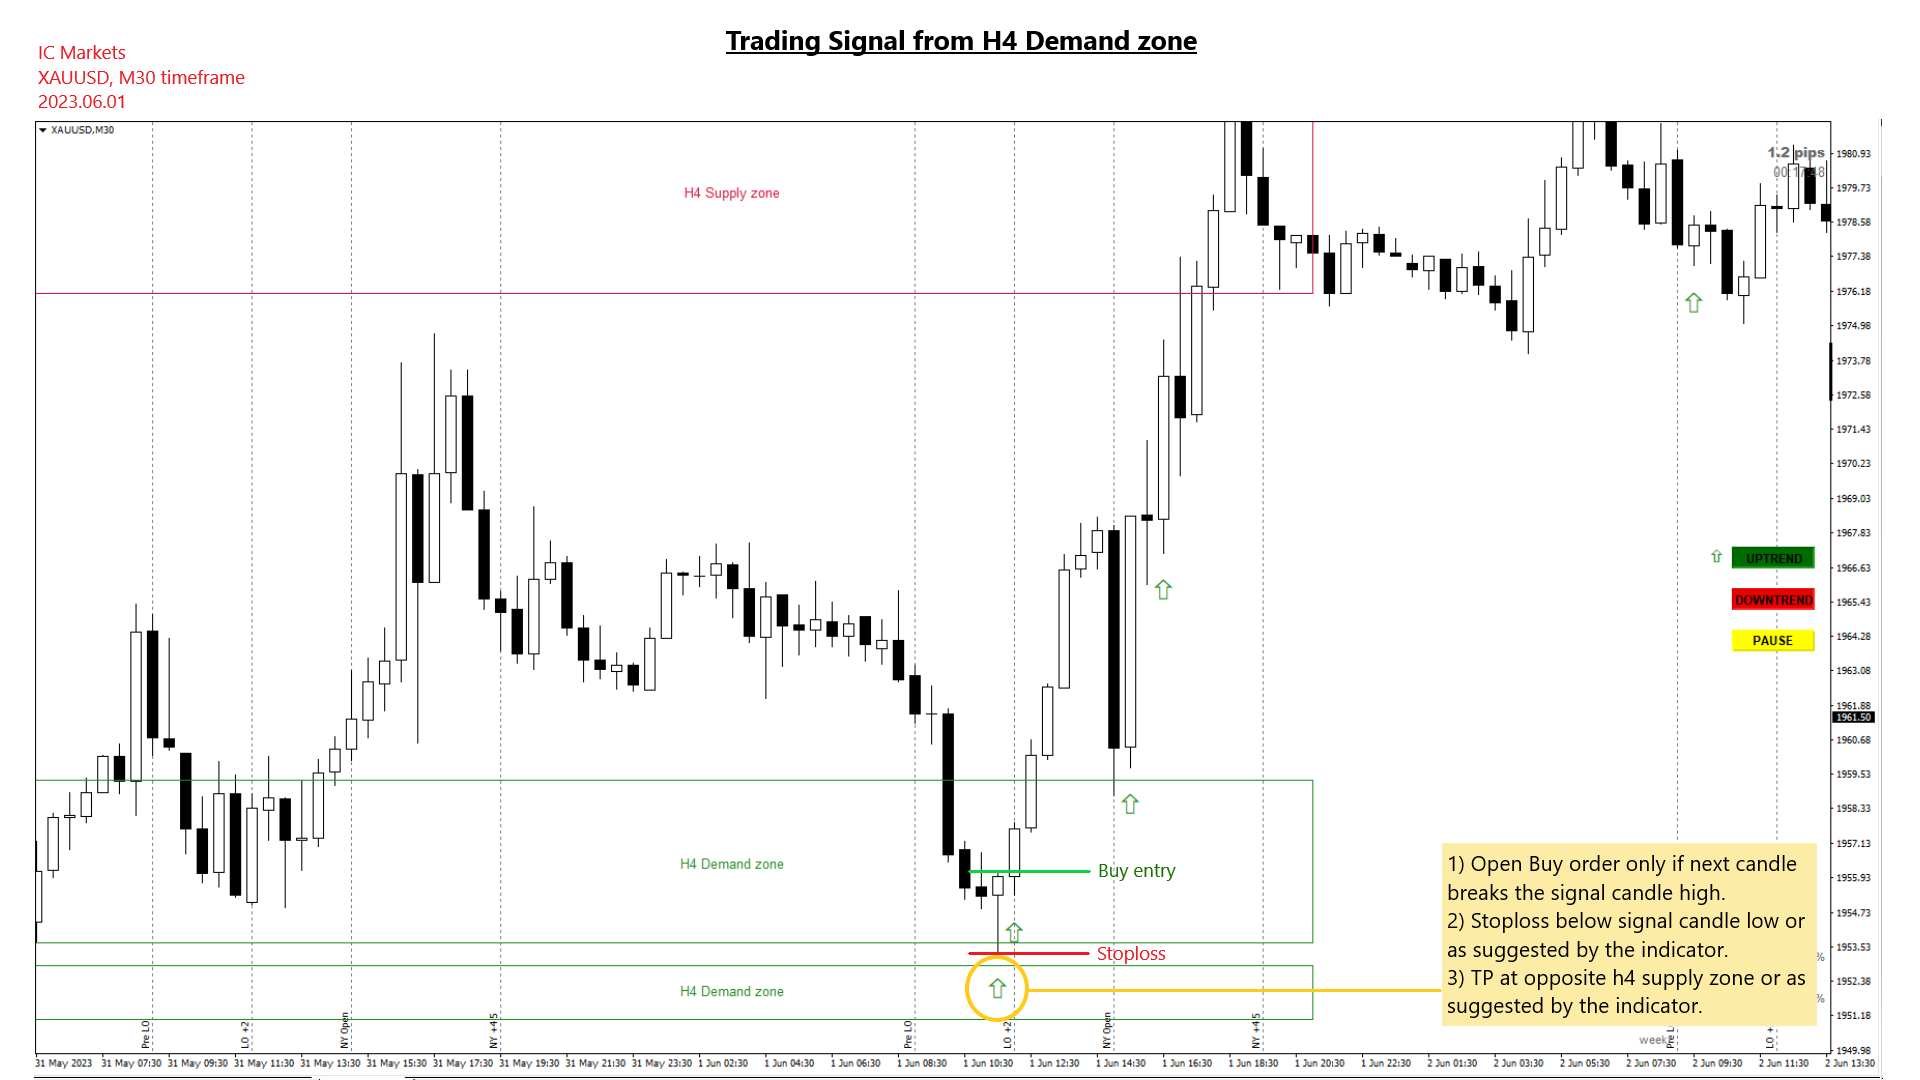
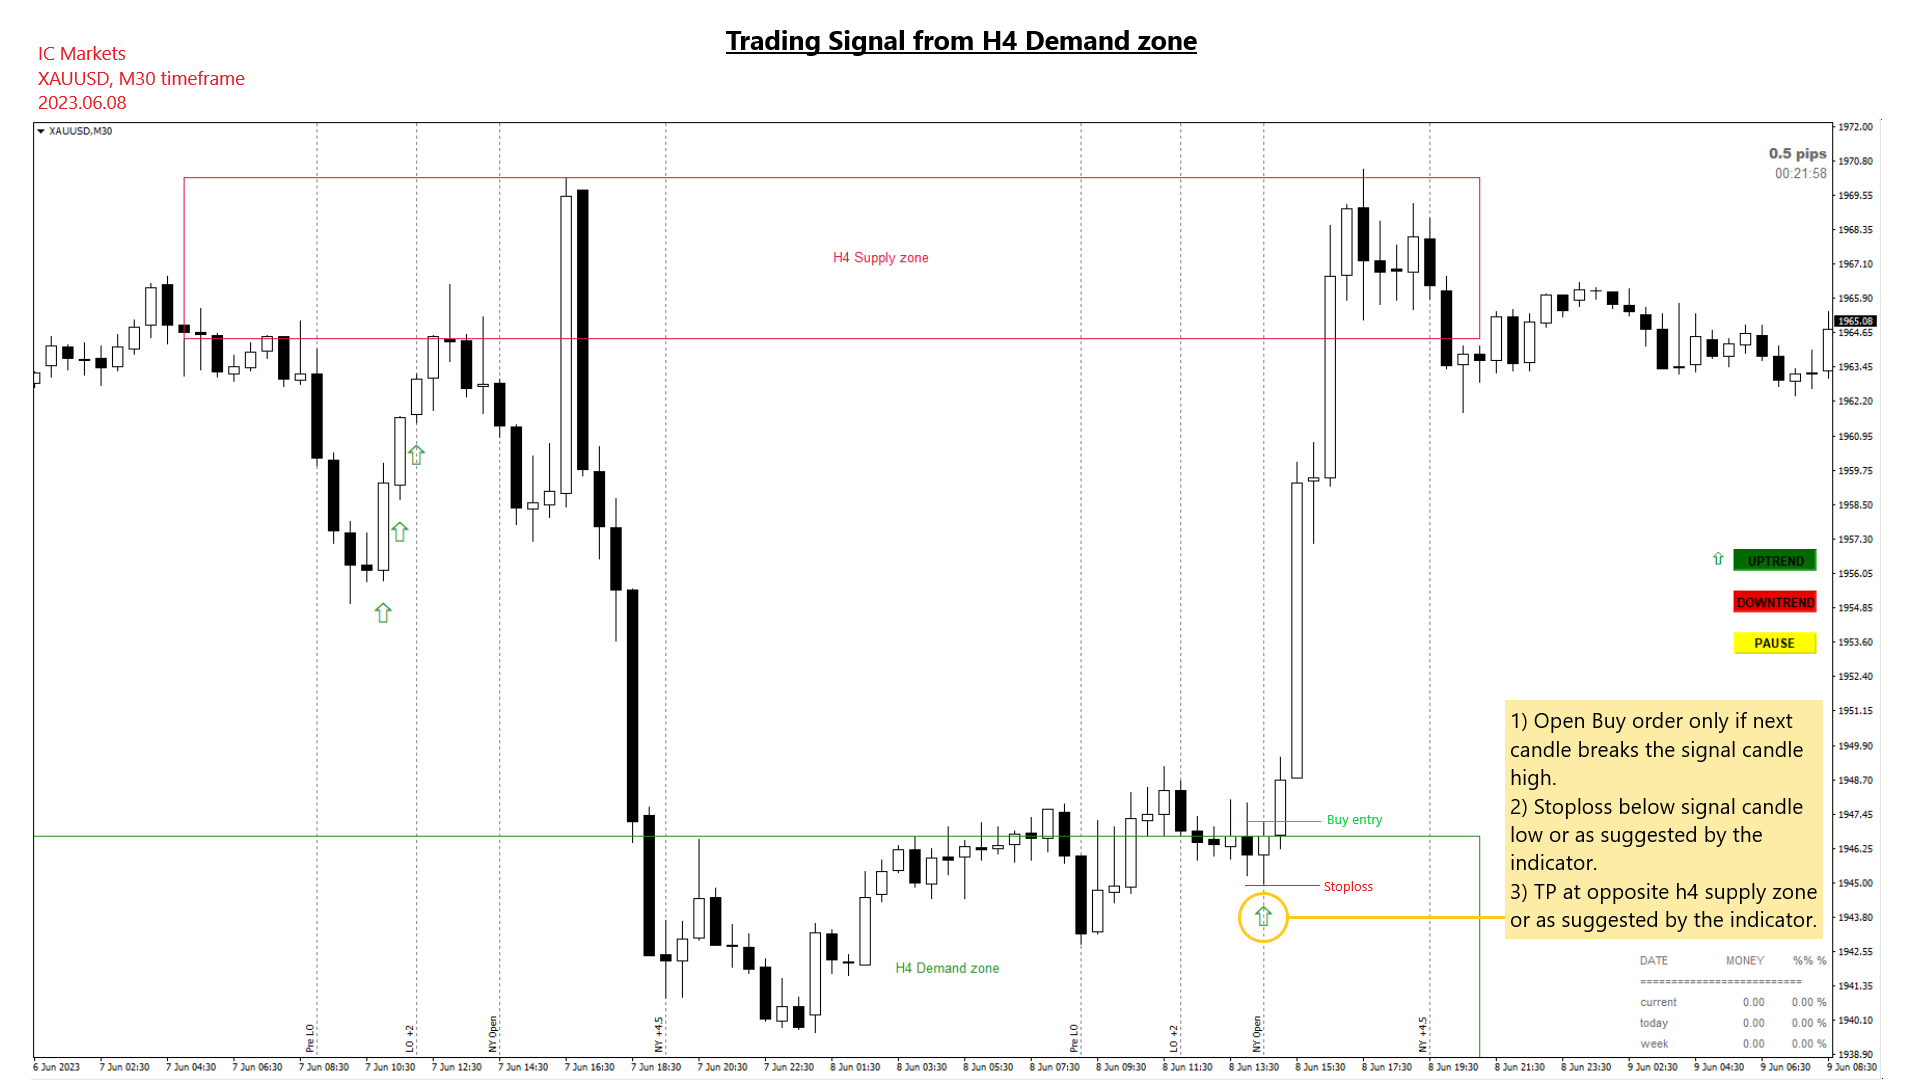
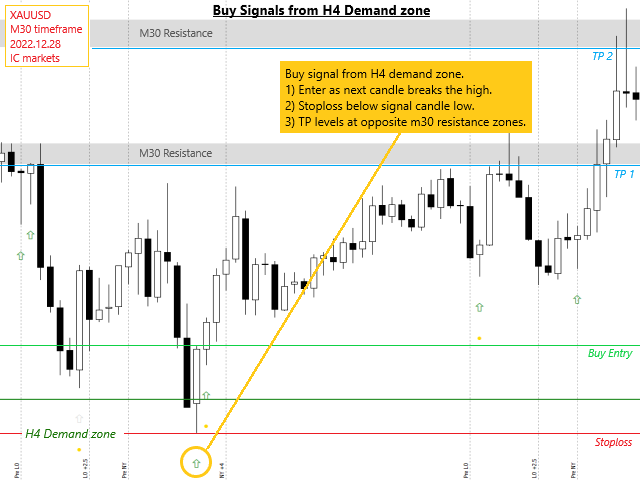
  2. 该指标的入场信号仅基于成交量和蜡烛形态,因此它们可以与几乎任何逻辑交易系统或交易计划一起使用。
  3. 如果没有明确的交易计划,请勿尝试交易该指标。
  4. 我是一名供需交易员。我的交易计划中提到了我使用该指标的方式。供应/需求区域必须手动绘制。
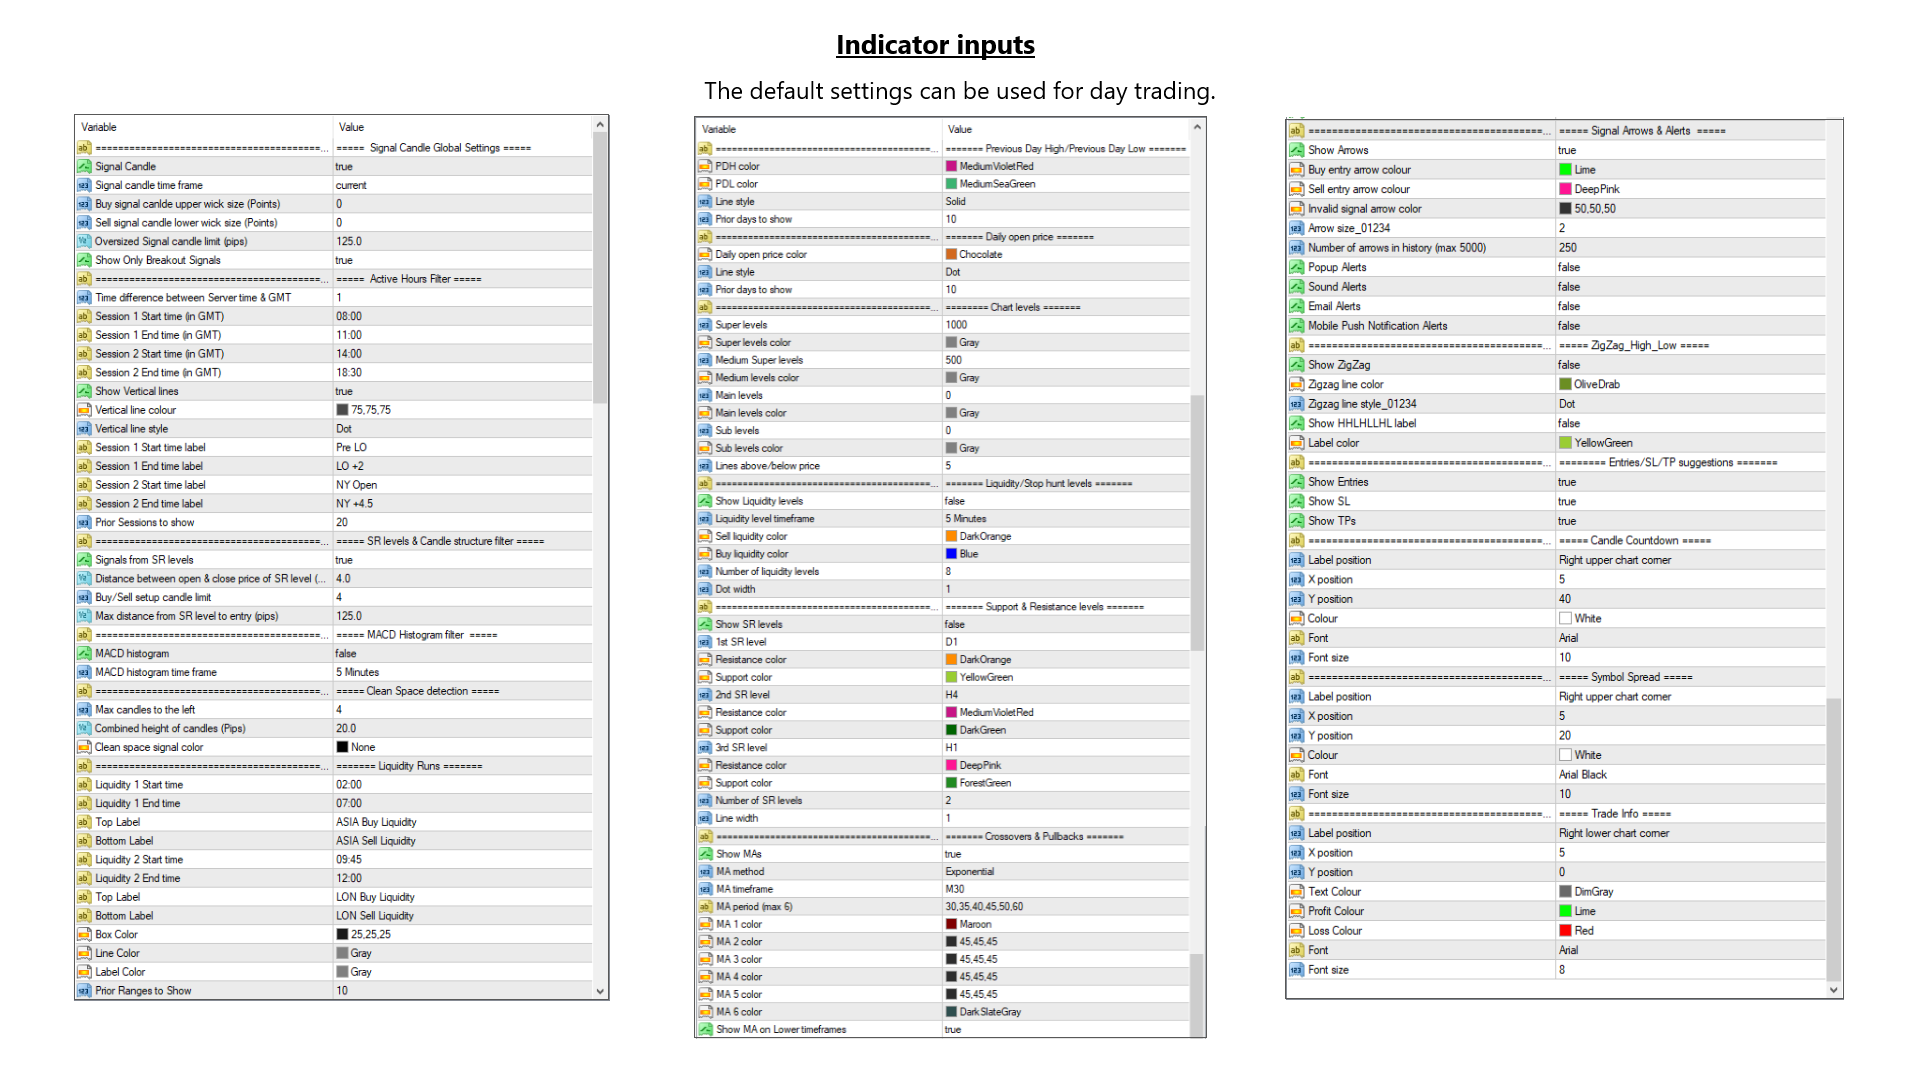
  5. 我对 m15/m30 信号使用默认设置。如果您希望在不同的时间范围内使用信号,则必须更改并测试适合您的工具和时间范围的设置。

    该工具是 Smart Keys Sniper Entry 贸易管理器的完美搭档。

    https://www.mql5.com/en/market/product/99463

    我还推荐这些贸易经理。

    https://www.mql5.com/en/market/product/88878

    https://www.mql5.com/en/market/product/90401

    评论 3
    tiagodbc
    46
    tiagodbc 2023.05.26 20:50 
     

    Works like a charm if you properly stick to the trading rules. This takes time and is not a short journey. Steve is very helpful from the beginning on to teach how the indicator works exactly and which concepts, criteria, Risk and Money management you need to have to successfully use the indicator.

    FX167
    196
    FX167 2023.05.12 15:44 
     

    Clear entries based on a clear strategy, primarely on xauusd, on either the m15 or the m30 timeframe. The indicator manual comes with loads of examples but beyond that customer support is excellent. Right after purchase Stephen sheduled a free zoom call with me to go over the indicator and strategy, where the agenda of the call was itemized into detail. Very structured. Other product vendors can learn from that approach. I really feel Steve is not yet another one of those vendors that is only out to make a quick buck off the back of confused traders, but a developer that actually wants to see you succeed and that has been through the same things and the same horrors the average aspiring trader goes through. Scams, going from course to course, signal services. Steve has been there. That is not to say all signal services are bad, more so it is to say, why be dependant on somebody else for the rest of your trading career? Highly recommended.

    vincenzo1964
    883
    vincenzo1964 2024.03.28 07:40 
     

    Buongiorno, ho affittato per tre mesi il tuo indicatore, potrei avere un po di supporto e spiegazione per utilizzarlo al meglio? grazie

    推荐产品
    Deep River AM
    Andriy Matviyevs'kyy
    The presented indicator is the author's implementation of the idea embodied in the Alligator indicator, which has already become a classic. The proposed product allows you to visually demonstrate the direction of price movement, temporary price rollbacks and zones of multidirectional price movement. Namely: The indicator lines go up and diverge from each other - a strong bullish trend; The indicator lines go down and diverge from each other - a strong bearish trend; The indicator lines go up but
    FREE
    Market Structure Zig Zag
    Lesedi Oliver Seilane
    4.8 (25)
    Free Market structure zig zag to assist in price action trading the screenshots describe how to use and how to spot patterns new version comes with alerts, email alert and  push notification alert can be used on all pairs  can be used on all timeframes  you can add additional confirmation indicators the indicator shows you your higher high and low highs as well as your lower lows and lower highs  the indication makes price action analysis easier to spot.
    FREE
    Trend Catcher with Alert
    Issam Kassas
    4.8 (64)
    趋势捕捉器: 具有警示指标的趋势捕捉器策略是一种多功能的技术分析工具,可帮助交易员识别市场趋势和潜在的进出点。它采用动态趋势捕捉器策略,根据市场条件进行调整,清晰地呈现趋势方向。交易员可以自定义参数,以符合其偏好和风险容忍度。该指标有助于识别趋势,发出潜在的反转信号,充当跟踪止损机制,并提供实时警报,以便及时应对市场。 具有警示指标的趋势捕捉器策略是一种多功能的技术分析工具,可帮助交易员识别市场趋势和潜在的进出点。它采用动态趋势捕捉器策略,根据市场条件进行调整,清晰地呈现趋势方向。交易员可以自定义参数,以符合其偏好和风险容忍度。该指标有助于识别趋势,发出潜在的反转信号,充当跟踪止损机制,并提供实时警报,以便及时应对市场。 特点: 趋势识别:信号牛市趋势和熊市趋势。 趋势反转:当蜡烛颜色从牛市变为熊市,反之亦然时,提醒可能的反转。 实时警报:为新趋势识别生成警报。 建议: 货币和货币对:EURUSD,AUDUSD,XAUUSD... 时间框架:H1。 账户类型:任何ECN,低点差账户。
    FREE
    Simply drop the indicator to the chart and Fibonacci levels will be shown automatically! The indicator is developed for automatic drawing of Fibonacci levels on the chart. It provides the abilities to: Select the standard Fibo levels to be shown Add custom levels Draw the indicator on the timeframes other than the current one. For example, the indicator is calculated on the weekly period (W1) and is displayed on the monthly period (MN1) Select the timeframes the indicator will be available on Ca
    The Wing Patterns indicator scans for many different kinds of Patterns using an XABCD structure. The term Wing Pattern is used to refer to all types of patterns based on a general XABCD structure, which is plotted in an alternate high-low extreme form. In other words, assume that point X is started at a low point on the chart. The point A is plotted at the next highest point within a certain number of bars. This certain number of bars is called the depth level. In this example, point B would be
    F ully automated Expert Advisor using the  advanced   algorithm for trading the EURUSD Designed for profit in a short period of time and big profit in a long run. Prefers EURUSD 1H. Principle of operation The SELL and BUY orders are opened (depending on the parameters set), guided by signals and the market situation.     Recommended parameter: Use an ECN broker account. minimum deposit of 100$ USD. use it in H1 time frame recommended symbol is EURUSD input parameter: TrendType               
    VR Cub
    Vladimir Pastushak
    VR Cub 这是获得高质量切入点的指标。该指标的开发是为了促进数学计算并简化对仓位入场点的搜索。多年来,该指标所针对的交易策略已被证明其有效性。交易策略的简单性是其巨大的优势,即使是新手交易者也能成功进行交易。 VR Cub 计算开仓点以及获利和止损目标水平,这显着提高了效率和易用性。查看使用以下策略进行交易的屏幕截图,了解简单的交易规则。 设置、设置文件、演示版本、说明、问题解决,可以从以下位置获取 [博客] 您可以在以下位置阅读或撰写评论 [关联] 版本为 [MetaTrader 5] 计算入场点的规则 开仓 要计算入场点,您需要将 VR Cub 工具从最后一个高点拉伸到最后一个低点。 如果第一个点在时间上早于第二个点,交易者等待柱线收于中线上方。 如果第一个点在时间上晚于第二个点,交易者等待柱线收于中线下方。 根据上述条件,严格在 柱线收盘 后建仓。 换句话说,如果我们在小时图上进行交易,那么从最高点到最低点的时间距离必须超过24小时,最高点和最低点之间的点数必须大于或等于平均价格变动每天。 维持和改变市场地位 可以有多个未平仓头寸;每个头寸都可以单独修改。 VR Cu
    Fibonacci SR Indicator
    Martin Eshleman
    3 (2)
    菲波纳奇支撑阻力指标 本指标创建支撑和阻力线。此指标基于菲波纳奇回撤和扩展级别。它会考虑菲波纳奇级别的多种组合,并在这些基础上绘制支撑/阻力线。此指标使用的顶部和底部由之字折线指标计算而来。如有必要,之字折线也可以在图表上绘制。 本指标考虑许多过去的反转点和菲波纳奇比率级别的组合,而当它看到多条线在相同的价格汇合,那么这将成为指标绘制的支撑/阻力线。未来的市场反转往往会正好出现在这些线附近。这是一个自动指标。所以,旧线将被删除,新线将随着市场的进步而绘制。 设置 Bars_Back - 向后一定数量的柱线用于所有计算。数量较少则较少反转点将被使用,因此,绘制的支撑和阻力线较少。向后更多柱线则有更多反转点将被使用,因此,绘制的支撑和阻力线较多。  Buffer_Space - 这表示每个已计算的菲波纳奇级别所需的汇合之间的最大点数。该数值越高,则确切的汇合必须越少。数字越低,则精确汇合必须更多,因此有较高的可靠性。例如, 让我们设为 10 点, 且指标运行在非分形的 4-位报价经纪商 (同样是 10 点)。此指标看到 3 个 菲波纳奇 回撤级别,分别在 1.4995, 1.5000,
    FREE
    Diamond Trend
    Segundo Calvo Munoz
    Indicator which identifies Trend and also buy/sell opportunities. Use for entries aligned to the Trend.  Although Diamond Trend is very accurate identifying entry points, it is always recommended to use a support indicator in order to reconfirm the operation. Remind to look for those Assets and Timeframes which best fit to your trader behavior/need... Valid for Scalping and Long Term operations. Please, set up a Bars Chart to be able to visualize the indicator properly...  ...And remind to give
    This is a new strategy for SUPPLY DEMAND areas It is based on a calculation using the tick volume to detect the big price action in market for both bear /bull actions this smart volume action candles are used to determine the supply and demand areas prices in between main supply and demand lines indicate sideway market  up arrows will be shown when prices moves above the main supply and the secondary supply lines Down arrows will be shown when prices moves below the main demand and the secondary
    Koala Fibo Base Time
    Ashkan Hazegh Nikrou
    3 (1)
    欢迎来到考拉菲波基地时间     欢迎来到考拉菲波时区     欢迎来到考拉斐波时间延长     欢迎使用Meta Trade错过的工具! 简单介绍: 斐波那契时区是基于斐波那契序列的垂直线。这些线沿X轴(日期轴)延伸,作为一种机制,可根据经过的时间预测逆转。 通常将主要的低点或高点作为起点。距离开始较小,并且随着斐波那契数列的扩展而增加。 图表专家可以将斐波纳契时区扩展到未来,以预测潜在的反转点。 您可以通过Google搜索“ Fibo Base Time,Fibo时区,Fibo Time Extension”按这些名称找到该指标 基本定义为更多信息:     斐波那契时区是垂直线,代表潜在的区域,在该区域中可能会出现高,低或反转的趋势。     斐波那契时区可能并不表示确切的反转点。它们是需要注意的基于时间的区域。     斐波那契时区仅表示与时间相关的潜在重要区域。不考虑价格。该区域可能标记为次要的高或低,或显着的高或低。     斐波那契时区基于斐波那契数列,这给了我们黄金分割率。在整个自然和建筑中都可以找到这个比例。
    FREE
    Fibonacci Wave Bands
    Luc Michael Botes
    Fibonacci Wave Bands Indicator The Fibonacci Wave Bands indicator utilizes Fibonacci ratios to create dynamic bands around a central moving average. These bands are derived from key Fibonacci ratios (typically 38.2%, 50%, 61.8%) and adapt to market volatility, offering insights into potential support and resistance zones. Key Features: Fibonacci Levels: The indicator plots multiple bands above and below a central moving average based on Fibonacci ratios. Dynamic Support and Resistance: Bands ser
    Fibonacci Retracement object is an object that has been provided by metatrader 4 platform. But  Fibonacci Retracement  object doesn't automated adjust the chart. You have to put and manage it manually to the chart. Because of that, this indicator was created. If you like using filbonacci retracement indicator, highly recommended to use Automated Fibonacci Retracement Indicator if you want to get better result in here: https://www.mql5.com/en/market/product/95515 LT Automated Fibonacci Retrace
    FREE
    Gravity timing Indicator
    Mohamed Kamel Touati
    4.8 (5)
    Gravity Timing Indicator  -GTI- GTI 指標是迄今為止最簡單和最準確的指標。它以重力方式使用支撐和阻力。操作它非常簡單,它由 7 條線組成,其中最強大的是最低線和最高線,所以當 指標反彈,是進場的最佳時機。   它適用於所有對,沒有例外 對於時間框架,我更喜歡小的時間框架,如 5 分鐘和 15 分鐘的剝頭皮。 請試用 GTI,如果您喜歡,請留下您的評論 謝謝你 GTI 指標是迄今為止最簡單和最準確的指標。它以重力方式使用支撐和阻力。操作它非常簡單,它由 7 條線組成,其中最強大的是最低線和最高線,所以當 指標反彈,是進場的最佳時機。   它適用於所有對,沒有例外 對於時間框架,我更喜歡小的時間框架,如 5 分鐘和 15 分鐘的剝頭皮。 請試用 GTI,如果您喜歡,請留下您的評論 謝謝你
    FREE
    TLM Map AM
    Andriy Matviyevs'kyy
    TLM Map AM (Trend Line Momentum Map) is an indicator developed based on a set of digital technical analysis indicators described in the article by Vladimir Kravchuk: " Digital indicators in the technical analysis of financial markets ". The indicator displays in a separate window a complex of digital technical analysis indicators such as FTLM and STLM. Recommended for use in conjunction with the RTL Map AM (Reference Trend Line Map) indicator. The indicator has no customizable parameters.
    FREE
    Diamond PRO
    Fanur Galamov
    5 (16)
    Diamond PRO is enhanced powerful version of Diamond for advanced traders. Pro version includes optimized cores, new impoved entry points filters, new multistage profit closure algorithm and сontains number of external control parameter that allows build and fine tune own tradind decisions and algorithms. The system provides more accurate market entries, analyzes and filters upcoming economic news, contains spread protection and an advanced position management algorithm. Main goal of Diamond PRO
    StakBank Gold
    Hjone Maykson Antonelli Dos Santos
    Tired of navigating the sea of uncertainties in the financial market? Imagine having an experienced guide by your side, helping you decipher the mysteries of charts and leading you confidently toward financial success. With StakBank, you'll have more than just a simple indicator in your hands. You'll have a complete arsenal of tools to make assertive and profitable decisions. But what makes StakBank so special? Volume: Understand the driving force behind market movements, accurately identifying
    LordAutoFibonnaci
    Igor Pereira Calil
    5 (1)
    Lord Auto Fibonnaci is a free indicator for Meta Trader, in order to show the most famous chart in the financial market known as "Fibonnaci". As we can see in the images below, the fibonnaci table will automatically analyze the graph for you, with trend factors through percentage, almost infallible use, you can always work when the percentage is low or high, start shopping and sales on time, great for analyzing entries! In the images below we can see an example in gold in H4, where we are a
    FREE
    ForexAurum Fibonacci indicator is a useful tool for traders who are using Fibonacci combined with the ZigZag indicators. It uses the real-time calculation of the levels for all the timeframes and displays the results for you. In addition, you can setup RSI, ADX and Stochastic indicators to confirm entries. How to use it Just drag and drop the indicator on an 1 minute chart of any symbol. Then you can switch to a higher timeframe at anytime after the initialization. Recommendation Always drag
    Free automatic fibonacci
    Tonny Obare
    4.65 (62)
    Free automatic Fibonacci is an indicator that automatically plots a Fibonacci retracement based on the number of bars you select on the BarsToScan setting in the indicator. The Fibonacci is automatically updated in real time as new highest and lowest values appears amongst the selected bars. You can select which level values to be displayed in the indicator settings. You can also select the color of the levels thus enabling the trader to be able to attach the indicator several times with differe
    FREE
    FiboPlusWaveRunner
    Sergey Malysh
    3.29 (7)
    Expert.   Automatic and manual trading. Ready-made trading system based on   Elliott waves   and Fibonacci retracement levels . It is simple and affordable. Display of the marking of Elliott waves (main or alternative option) on the chart. Construction of horizontal levels, support and resistance lines, a channel. Superposition of Fibonacci levels on waves 1, 3, 5, A Alert system (on-screen, E-Mail, Push notifications).    visual panel for opening orders in manual trading. visual panel for sett
    Fibonacci retracements can be used to draw support lines, identify resistance levels, place stop-loss orders and set target prices. The Advanced Automatic Fibonacci retracements draws automatically all the levels. You have a lot of options to choose. For exemple you can use the tracements of another time frame (MTF) in the current chart, you can also choose between the closest level or less close to draw the retracements. You can also add 2 levels of your choice. You can add levels extensions o
    This powerful tool combines the Zigzag algorithm with Fibonacci retracement levels, enhancing your trading experience in the MetaTrader 4 (MT4) platform. Zigzag with Fibo Indicator Time Frame :- 1H and above The   Zigzag with Fibo Indicator   is designed to identify trend direction and provide precise entry and exit points for forex trading. Here’s what makes it stand out: Zigzag Algorithm Integration : The indicator utilizes the Zigzag algorithm, which helps filter out market noise and highligh
    FREE
    DMS Fibo
    Diogo Mitsunaga Dos Santos
    Fibonacci retracements are trend lines drawn between two significant points, usually between absolute lows and absolute highs, plotted on a chart. Intersecting horizontal lines are placed at the Fibonacci levels. Fibonacci retracements are useful tools that help traders identify support and resistance levels. With the information gathered, they can place orders, identify stop-loss levels, and set price targets. Although useful, traders often use other indicators to make more accurate assessments
    GTAS FibTdi
    Riviera Systems
    3.2 (5)
    GTAS FidTdi is a trend indicator using combination of volatility and potential retracement levels. This indicator was created by Bernard Prats Desclaux, proprietary trader and ex-hedge fund manager, founder of E-Winvest. Description The indicator is represented as a red or green envelope above or under prices. How to use Trend detecting When the envelope is green, the trend is bullish. When it is red, the trend is bearish. Trading Once a trade is opened, GTAS FibTdi shows retracement zones
    FREE
    Professional forex expert   Black Angel   (for EURUSD, GBPUSD pairs) alyzing the market using the Elliot Wave Index. Elliott wave theory is the interpretation of processes in financial markets through a system of visual models (waves) on price charts. The author of the theory, Ralph Elliott, identified eight variants of alternating waves (of which five are in the trend and three are against the trend). The movement of prices in the markets takes the form of five waves. Three of them (1, 3, 5)
    基于具有标准参数的MACD指标波 在最后两个MACD波上分别对正面和负面交易斐波纳契水平, 如果负波浪在MACD指标上结束,则颜色为绿色, 如果正波在MACD指标上结束,那么颜色为红色。 Wave的终止标准是两个滴答,MACD的符号不同。 在最近四次MACD波浪中绘制趋势线。 与专家合作很好  Figures MACD   https://www.mql5.com/ru/market/product/42031 更多截图: https://www.mql5.com/ru/charts/10581596/audusd-h1-alpari-international https://www.mql5.com/ru/charts/10631979/usdjpy-m1-alpari-international https://www.mql5.com/ru/charts/10628704/gbpusd-m15-alpari-international
    Dear Trader It is my pleasure to introduce to you my tool called the " Forex Sniper Indicator" . The major aim of this tool is to help serious traders and investors in all type of Financial Markets to catch price next movement right at the moment the price direction is about to change. This tool can be used to snipe the price direction in both down trend, uptrend and ranging markets. This tool can be used as the stand alone tool though it may be combined with other tools as well. My goal is to h
    BBMA Grid Combination
    Kahfi Pangariduwan
    5 (1)
    BBMAGC   BBMAGC  is an automatic trading system with a work strategy obtained from famous BBMA indicator combine with advance grid system . This EA use dangerous trading systems like martingale and grid so please understand the risk before using this EA Time Frame: H1 Symbol: best result on EUR/USD, GBPUSD, GBPCAD VPS recommended 4/5 digit broker Min Deposit 1000$ Low spread always better Since you using Grid system, always trade using money that you are willing to lose. When you use an expert a
    The new update makes this indicator a complete tool for studying, analyzing and operating probabilistic patterns. It includes: On-chart Multi-asset percentage monitor. Configurable martingales. Twenty-one pre-configured patterns , including Mhi patterns and C3. An advanced pattern editor to store up to 5 custom patterns. Backtest mode to test results with loss reports. Trend filter. Hit operational filter. Martingale Cycles option. Various types of strategies and alerts. Confluence between patte
    该产品的买家也购买
    Atomic Analyst
    Issam Kassas
    5 (3)
    首先值得强调的是,该交易指标是非重绘、非延迟的指标,这使其成为手动和机器人交易的理想选择。 用户手册:设置、输入和策略。 Atomic Analyst是一种PA价格行动指标,利用价格的力量和动量来寻找市场上更好的机会。配备了高级过滤器,可帮助去除噪音和假信号,并提高交易潜力。使用多层复杂的指标,Atomic Analyst扫描图表,并将复杂的数学计算转化为任何初学者都能理解并用来做出一致交易决策的简单信号和颜色。 “Atomic Analyst”是专为新手和经验丰富的交易者量身定制的综合交易解决方案。它将高级指标和一流功能融合为一体的交易策略,使其成为所有类型交易者的多功能选择。 日内交易和剥头皮策略:专为快速准确的日内交易和短期交易而设计。 日内和摆动交易策略:可用作追求价格大幅波动的日内和摆动交易者的可靠工具。 多货币和市场:凭借其可靠的精度,在不同的工具和市场上运作。 多个时间框架:可在多个时间框架上使用,性能良好。 稳定性:所有指标均不重绘、不重绘和不滞后,确保可靠的信号。 信号清晰度:提供箭头信号,用于清晰的入场和出场点。 实时警报:通过交易入场、SL和TP警报通知交
    Scalper Inside PRO
    Alexey Minkov
    4.75 (59)
    An exclusive indicator that utilizes an innovative algorithm to swiftly and accurately determine the market trend. The indicator automatically calculates opening, closing, and profit levels, providing detailed trading statistics. With these features, you can choose the most appropriate trading instrument for the current market conditions. Additionally, you can easily integrate your own arrow indicators into Scalper Inside Pro to quickly evaluate their statistics and profitability. Scalper Inside
    TPSpro RFI Levels
    Roman Podpora
    4.86 (21)
    Reversal First Impulse levels (RFI)    INSTRUCTIONS        RUS       -       ENG              R ecommended to use with an indicator   -   TPSpro  TREND PRO -  Version MT5 A key element in trading is zones or levels from which decisions to buy or sell a trading instrument are made. Despite attempts by major players to conceal their presence in the market, they inevitably leave traces. Our task was to learn how to identify these traces and interpret them correctly. Main functions: Displaying activ
    Quantum Breakout Indicator PRO
    Bogdan Ion Puscasu
    4.96 (26)
    介绍     Quantum Breakout PRO   ,突破性的 MQL5 指标,正在改变您交易突破区域的方式!   Quantum Breakout PRO 由拥有超过 13 年交易经验的经验丰富的交易者团队开发,旨在通过其创新和动态的突破区域策略将您的交易之旅推向新的高度。 量子突破指标将为您提供带有 5 个利润目标区域的突破区域的信号箭头,以及基于突破框的止损建议。 它既适合新手交易者,也适合专业交易者。 量子 EA 通道:       点击这里 MT5版本:   点击这里 重要的!购买后请私信我领取安装手册。 建议: 时间范围:M15 货币对:GBPJPY、EURJPY、USDJPY、NZDUSD、XAUUSD 账户类型:ECN、Raw 或 Razor,点差极低 经纪商时间:GMT +3 经纪商:IC Markets、Pepperstone with Raw 和 Razor 的点差最低 规格: 不重漆! 最多 5 个建议利润目标区域 建议止损水平 可定制的盒子。您可以设置自己的 Box Time Start 和 Box Time E
    GOLD Impulse with Alert
    Bernhard Schweigert
    4.56 (9)
    这个指标是我们2个产品 Advanced Currency IMPULSE with ALERT  +   Currency Strength Exotics 的一个超级组合。 它适用于所有时间框架,并以图形方式显示8种主要货币和一种符号的强势或弱势冲动! 该指标专门用于显示任何符号的货币强度加速,如黄金、异国货币对、商品、指数或期货。这是它的第一个指标,任何符号都可以被添加到第9行,以显示黄金、白银、石油、DAX、US30、MXN、TRY、CNH等的真实货币强度加速(冲动或速度)。 建立在新的基础算法上,它使识别和确认潜在的交易更加容易。这是因为它以图形方式显示了一种货币的强势或弱势是否正在加速,并测量了这种加速的速度--把它想象成你汽车中的速度表。当你加速时,事情显然会发生得更快,这在外汇市场上也是一样的,即如果你配对的货币正在向相反的方向加速,你就会发现一个潜在的有利可图的交易。 动态市场斐波那契28水平被用作警报触发器,将适应市场活动。如果冲动击中黄色触发线,你将收到警报。然后你就知道作为一个交易员应该做什么。货币对和方向已经给出。只需点击警报按钮,就可以
    FX Volume
    Daniel Stein
    4.61 (36)
    通过 mql5 和 Telegram 上 的 " 晨间简报 "获取每日市场更新,包括详细信息和屏幕截图 ! 外汇交易量(FX Volume)是第一个也是唯一一个从经纪商角度真正洞察市场情绪的交易量指标。 直接在您的图表上看到这些信息是真正改变游戏规则和突破性的交易解决方案。 受益于独特的市场数据洞察,如 比率(Ratios )显示货币多头和空头头寸的比率(百分比 比率变化 显示所选时间段内的多头比率及其百分比变化 总交易量 显示货币的总交易量(多头和空头),以手为单位 多头 交易量显示货币所有多头头寸的交易量 空头 交易量显示所有货币空头头寸的交易量 净多头 显示净多头交易量,即所有多头头寸减去所有空头头寸(以手为单位)。 净多头百分比 显示货币净多头交易量的变化 请阅读我们的基本教程 -> "如何使用外汇交易量进行交易 " 获取更多信息,如常见问题、交易技巧和教程视频,请访问我们的 外汇交易量公共信息频道 请 安装并运行 SI Connect 以建立与我们数据中心的持续连接 背景信息 我们都知道,外汇是一个分散的市场。这就是为什么我们必须打破常规思维,开发一个独
    Cycle Sniper
    Elmira Memish
    4.41 (37)
    NEW YEAR SALE PRICE FOR LIMITED TIME!!! Please contact us after your purchase and we will send you the complimentary indicators to complete the system Cycle Sniper is not a holy grail but when you use it in a system which is explained in the videos, you will feel the difference. If you are not willing to focus on the charts designed with Cycle Sniper and other free tools we provide, we recommend not buying this indicator. We recommend watching the videos about the indiactor and system before pu
    目前八折优惠! 对任何新手或专家交易者来说都是最好的解决方案! 这个仪表板软件适用于28种货币对。它基于我们的两个主要指标(高级货币强度28和高级货币冲动)。它对整个外汇市场提供了一个伟大的概述。它显示高级货币强度值,货币运动速度和28个外汇对在所有(9)时间段的信号。想象一下,当你可以使用图表上的单一指标观察整个市场,以确定趋势和或剥头皮的机会时,你的交易将得到改善 我们已经在这个指标中建立了一些功能,使你更容易识别强势和弱势货币,同时识别和确认潜在的交易。该指标以图形方式显示货币的强势或弱势是增加还是减少,以及它在所有时间段的表现。 增加的新功能是动态市场斐波那契水平,它适应当前的市场条件变化,这是一个已经在我们的高级货币强度28和高级货币冲动指标中使用的成熟的加分项。 在交易时,总是将弱势货币和强势货币配对,这个新指标将帮助你做到这一点。 用户手册:点击这里  https://www.mql5.com/en/blogs/post/708783 特点  显示每个时间段的ACS28和GAP-speed(冲动)的货币强度值。 列:颜色代码以7种颜色
    TPSproTREND PrO
    Roman Podpora
    4.78 (18)
    TPSpro TRENDPRO  - is a trend indicator that automatically analyzes the market and provides information about the trend and each of its changes, as well as giving signals for entering trades without redrawing! The indicator uses each candle, analyzing them separately. referring to different impulses - up or down impulse. Exact entry points into transactions for currencies, crypto, metals, stocks, indices!  -  Version MT5               DETAILED DESCRIPTION                R ecommended to use with
    RelicusRoad Pro
    Relicus LLC
    4.73 (140)
    现在$ 147(更新后增加到$ 499) - 无限帐户(PC或Mac) RelicusRoad 用户手册 + 培训视频 + 访问 Private Discord Group + VIP 身份 一种看待市场的新方式 RelicusRoad 是世界上最强大的外汇、期货、加密货币、股票和指数交易指标,为交易者提供保持盈利所需的所有信息和工具。我们提供技术分析和交易计划,帮助每一位交易者取得成功,从初学者到高级。它是一个关键的交易指标,可以提供足够的信息来预测未来的市场。我们相信一个完整的解决方案,而不是图表上几个没有意义的不同指标。这是一个多合一指标,显示无与伦比且非常准确的信号、箭头 + 价格行为信息。 RelicusRoad 基于强大的人工智能,提供缺失的信息和工具来教育您并使您成为交易专家,成为成功的交易者。 几乎所有技术指标都滞后,这意味着它们只能报告已经发生的事情。因此,他们只确认您过去可以看到的价格已经在哪里。我们相信领先指标可以预测未来价格,而无需重新绘制,也不要过度依赖可能改变并导致重新绘制的滞后指标。如果您根据滞后指标进行交易并建立头寸,您就知道您已
    Market Swing Index MSI
    Elias Mtwenge
    5 (1)
    JULY OFFER 80% OFF next price for unlimited version will be 17000$. This is the only time you can get this institutional and professional indicator at this price for unlimited version. Don't dare to miss this. The tool I am about to introduce to you you can't compare it with other tools due to its strategy and accuracy level in predicting the next price directional movement . This tool is designed for serious traders who have decided to make a difference through trading. Be the next person to wi
    NAM Order Blocks
    NAM TECH GROUP, CORP.
    5 (1)
    MT4多時限訂單塊檢測指示器。 特徵 -在圖表控制面板上完全可自定義,提供完整的交互。 -隨時隨地隱藏和顯示控制面板。 -在多個時間範圍內檢測OB。 -選擇要顯示的OB數量。 -不同的OB用戶界面。 -OB上的不同過濾器。 -OB接近警報。 -ADR高低線。 -通知服務(屏幕警報|推送通知)。 概括 訂單塊是一種市場行為,它指示從金融機構和銀行收取訂單。著名的金融機構和中央銀行帶動了外匯市場。因此,交易者必須知道他們在市場上正在做什麼。當市場建立訂單塊時,它會像發生大多數投資決策的範圍一樣移動。 訂單建立完成後,市場將朝著上升和縮小的方向發展。訂單大宗交易策略的關鍵術語是它包括機構交易者正在做的事情。由於它們是主要的價格驅動因素,因此包括機構交易在內的任何策略都可以。 您將在任何時間範圍內實時看到訂單塊,使用我們的控制面板,您將能夠在所選的歷史記錄週期內檢測常規,拒收和未大寫的訂單塊。 現在您可以接收到訂單塊接近警報,我們在MT4上顯示屏幕通知,並將通知推送到您的手機!
    Entry Points Pro
    Yury Orlov
    4.7 (226)
    这是一款 MT4 的趋势指标,可提供准确的入场交易信号,且无重绘或延迟。 它可应用在任何金融资产:外汇、加密货币、贵金属、股票、指数。 最好的结果出现在 M15+ 的时间帧内。 指标的 MT5 版本 重要! 购买后请联系我,以便获取详细指南和奖励。 视频 (6:22) - 一个信号赢取的利润等于指标价格的三倍。 视频 (4:44) - 它如何在测试器中工作,我的提示和技巧。 视频 (1:44) - 有关它如何处理加密货币和指数的几句话。 大多数交易者在 Entry Points Pro 指标的帮助下,在第一个交易周内就改善了他们的交易结果。 Entry Points Pro 指标的益处 入场信号无重绘或延迟 如果信号出现,并得到确认(如果信号所在烛条已收盘),则它不会再消失;不像是重绘指标,它会导致重大的财产损失,因为它们可以在显示信号后再将其删除。 无差错开仓 指标算法可令您找到入场交易(买入或卖出资产)的理想时机,从而提高每位交易者的成功率。 Entry Points Pro 可操作任何资产 它允许您在 MT4 平台上交易任何经纪商提供的加密货币、股票、
    Currency Strength Exotics
    Bernhard Schweigert
    4.88 (33)
    目前8折优惠! 对任何新手或专家交易者来说都是最好的解决方案! 这个指标是专门用来显示任何符号的货币强度,如异国货币对、商品、指数或期货。它是同类产品中的第一个,任何符号都可以添加到第9行,以显示黄金、白银、石油、DAX、US30、MXN、TRY、CNH等的真实货币强度。这是一个独特的、高质量的、负担得起的交易工具,因为我们已经纳入了一些专有的功能和一个新的公式。想象一下,你的交易将如何改善,因为你能够准确地确定新趋势或剥头皮机会的触发点? 用户手册:点击这里   https://www.mql5.com/en/blogs/post/708876 它适用于所有时间框架。你将很快能够看到TREND! 根据新的基础算法设计,它使识别和确认潜在交易变得更加容易。这是因为它以图形方式显示了8种主要货币和一种符号的强弱。 该指标显示了8种主要货币(澳元加元瑞士法郎欧元英镑日元新西兰美元)的强弱线,再加上一个符号! 该指标显示了符号的真实价值。例如:对于XAUUSD(黄金):价格以美元报价。如果黄金在上涨,你怎么能知道是黄金的强势还是美元的弱势?只有当黄金走强时,我们才会进行
    AT Forex Indicator MT4
    Marzena Maria Szmit
    5 (2)
    The AT Forex Indicator MT4 is a sophisticated trading tool designed to provide traders with a comprehensive analysis of multiple currency pairs. This   powerful indicator   simplifies the complex nature of the forex market, making it accessible for both novice and experienced traders. AT Forex Indicator uses   advanced algorithms   to detect trends, patterns and is an essential tool for traders aiming to enhance their forex trading performance. With its robust features, ease of use, and reliabl
    MTF Supply Demand Zones
    Georgios Kalomoiropoulos
    4.83 (23)
    下一代自动化供需区。适用于任何图表的创新算法。所有区域都是根据市场的价格行为动态创建的。 两种类型的警报 --> 1) 当价格触及区域时 2) 当新区域形成时 你不会再得到一个无用的指标。您将获得一个完整的交易策略和经过验证的结果。     新的功能:     价格触及供需区时发出警报     创建新的供应/需求区时发出警报     推送通知警报     以点为单位的区域宽度标签     关于 MTF 的又一个时间表。因此,现在您将能够看到高于当前 3 个时间帧,而不是高于当前 2 个时间帧     启用/禁用警报/区域/MTF 功能的按钮 您获得的优势:     消除交易中的情绪。     客观化您的交易条目。     通过高概率设置提高您的利润。     节省绘图区域的时间。     像专业人士一样交易金融市场。     任何市场的即时多时间框架分析。 你在图表上看到了什么?     蓝色和红色矩形是当前时间范围的供需区。     虚线
    Indicator : RealValueIndicator Description : RealValueIndicator is a powerful tool designed specifically for trading on the EURUSD pair. This indicator analyzes all EUR and USD pairs, calculates their real currency strength values, and displays them as a single realistic value to give you a head start on price. This indicator will tell you moves before they happen if you use it right. RealValueIndicator allows you to get a quick and accurate overview of the EURUSD currency pair tops and bottoms,
    ZeusArrow Smart Liquidity Finder  Smart Liquidity Finder is Ai controlled indicator based on the Idea of Your SL is My Entry. It scan and draws the major Liquidity areas on chart partitioning them with Premium and Discount Zone and allows you find the best possible trading setups and help you decide the perfect entry price to avoid getting your Stop Loss hunted . Now no more confusion about when to enter and where to enter. Benefit from this one of it's kind trading tool powered by Ai an trade
    TrendMaestro
    Stefano Frisetti
    5 (3)
    note: this indicator is for METATRADER4, if you want the version for METATRADER5 this is the link:  https://www.mql5.com/it/market/product/108106 TRENDMAESTRO ver 2.4 TRENDMAESTRO recognizes a new TREND in the bud, he never makes mistakes. The certainty of identifying a new TREND is priceless. DESCRIPTION TRENDMAESTRO identifies a new TREND in the bud, this indicator examines the volatility, volumes and momentum to identify the moment in which there is an explosion of one or more of these data a
    目前有26%的折扣!! 这个指标是我们两个主要指标( Advanced Currency Strength 28   &  Advanced Currency IMPULSE with ALERT )的一个超级组合。它显示了28个外汇对的TICK-UNITS货币强度值和警报信号。可以使用11种不同的Tick-Units。它们是1、2、3、4、5、6、10、12、15、20和30秒。子窗口中的Tick-Unit栏将被显示并向左移动,当在一秒钟的定时器中至少有一个Tick。 只用一个图表,你就可以剥28个外汇货币对的头皮!想象一下,你的剥头皮将如何提高。想象一下,你的剥头皮将如何改善,因为你能够准确地确定剥头皮机会的触发点? 这是市场上第一个在比1分钟更短的时间内工作的货币强度指标! 它是为那些希望快速进出并从市场中切出小点数的快速剥头皮者准备的。 用户手册:点击这里 https://www.mql5.com/en/blogs/post/727178 特点。 为28个货币对提供嘀嗒单位的卖出/买入警报,有一个按钮可以快速打开目标图表。 在3种敏感模式中选择
    Quantum Trend Sniper Indicator MT4
    Bogdan Ion Puscasu
    4.6 (40)
    介绍   量子趋势狙击指标 ,突破性的 MQL5 指标,正在改变您识别和交易趋势反转的方式!由拥有超过13年交易经验的资深交易员团队开发,     量子趋势狙击指标   旨在通过其创新的方式以极高的准确度识别趋势反转,将您的交易之旅推向新的高度。 ***购买量子趋势狙击指标,即可免费获得量子突破指标!*** 当量子突破指标识别出趋势反转时,它会向您发出警报和信号箭头,并建议您三个止盈水平。 它既适合新手交易者,也适合专业交易者。 量子 EA 通道:       点击这里 MT5版本:       点击这里 建议: 时间范围:  所有时间范围。为了获得最佳结果,我们建议在 M15、M30 和 H1 时间范围内使用它。 货币对:欧元兑美元、英镑兑美元、澳元兑美元、欧元兑英镑, EURAUD, XAUUSD 账户类型:ECN、Raw 或 Razor,点差极低 经纪时间:任意 经纪商:IC Markets、Pepperstone with Raw 和 Razor 的点差最低 建议止损:50 点 建议止盈水平:20 点、50 点和 1
    This indicator uses support and resistance, volume and some special formula to calculate the volume to filter the candles. If the volume reaches a specific value, And at the same time, Candle breaks the support/resistance line, There would be a signal and we can enter the market. Signals appear when the current candle closes. then you can enter the trade when a new candle appears. Please don't forget to follow your money management plan. MT5 Version Support/Resistance Breakout MT5 :   https:
    Volume by Price MT4
    Brian Collard
    4.71 (14)
    The Volumebyprice.com Indicator for MetaTrader 4 features Volume Profile and Market Profile TPO (Time Price Opportunity). Volume and TPO histogram bar and line charts. Volume Footprint charts. TPO letter and block marker collapsed and split structure charts. Static, dynamic and flexible range segmentation and compositing methods with relative and absolute visualizations. Session hours filtering and segment concatenation with Market Watch and custom user specifications. Graphical layering, posit
    EZT Trend
    Tibor Rituper
    4 (1)
    EZT 趋势指标将向您显示趋势、回调和入场机会。 提供可选的过滤和所有类型的警报。 添加电子邮件和推送通知警报。 我们还在开发基于该指标的 EA,即将推出。 它是一个多功能指标,由两个颜色直方图和一条线组成。 它是趋势方向和强度的直观表示,您也可以在线上或直方图上多次发现背离。 该指标与自动参数设置配合良好。 这些是针对给定时间范围预先确定的,我们建议使用具有该设置的指标。 在手动模式下,您可以设置自己的参数。 这是一个多时间框架 (mtf) 指标。 该指标与我们的其他指标(例如 MTF rsi 或 MTF cci 或 MACD pro)组合起来效果很好。 交易工具的波动性越大,您寻找最佳入场机会的时间范围就越小。 始终考虑更高的时间范围方向! 为此,您应该使用更多指标实例。 输入 参数模式:可选择“手动参数”或预设的“自动参数”。 自动参数处于多时间范围模式。 示例:当您设置自动 H1 参数时:您可以看到从 H1 时间范围一直到 1 分钟的相同显示。 在此设置中,指标不会在更高的时间范围(例如 H4 或更大)上显示。 手动时间范围:当在第一个菜单中选
    30% DISCOUNT ! DISCOUNT ! DISCOUNT ONLY FOR 5 USERS at125$ valid for 1 day only.Grab it The PERFECT TREND HIT creates   BUY and SELL  perfect trend   arrow signals based on ADX EMA AND RSI And all filters inbuilt with accurate trend entries. Furthermore, the indicator and template display the trend direction, strength, and trade recommendation for independent price charts. ROCK WITH THE TREND Moreover, it shows the final trade recommendation to BUY or SELL with all filters and displays that info
    A. 什么是 A2SR ?   * 这是一个领先的技术指标(没有重绘,没有滞后)。  -  指导 : -- 在  https://www.mql5.com/en/blogs/post/734748/page4#comment_16532516 -- 和  https://www.mql5.com/en/users/yohana/blog A2SR 在确定支撑(需求)和阻力(供应)水平方面有一种特殊的技术。 与我们在网上看到的普通方式不同,A2SR 在确定实际 SR 级别时有一个独创的概念。 原技术不是从网上拿来的,也没有在网上公开过。 A2SR 将根据您的交易风格自动选择 SR 级别。 即使您正在更改时间范围,但 SR 级别仍将保留在其位置上。 因为实际的 SR 不是从你使用的时间范围内获得的。 A2SR 拥有完整的交易工具 。 实际支持(需求)和阻力(供应)的真正概念。 新闻事件和央行讲话的市场情绪。 新闻事件和趋势的主要货币强度 (MCS) 的真正概念。 今天的当前趋势,包括放置位置的建议。 SR、Breakout 和 Breakdown 的自动水平趋势线。 您会发现分
    Gold Channel XAUUSD
    Paulo Rocha
    5 (2)
    Gold Channel is a volatility-based indicator, developed with a specific timing algorithm for the XAUUSD pair, which consists of finding possible corrections in the market. This indicator shows two outer lines, an inner line (retracement line) and an arrow sign, where the theory of the channel is to help identify overbought and oversold conditions in the market. The market price will generally fall between the boundaries of the channel. If prices touch or move outside the channel it is a tra
    Enigmera
    Ivan Stefanov
    5 (4)
    ENIGMERA:市场核心 https://www.enigmera.com 简介 该指标和交易系统是金融市场的一种非凡方法。ENIGMERA 利用分形周期精确计算支撑位和阻力位。它能显示真实的累积阶段,并给出方向和目标。 该系统无论在趋势中还是在修正中都能发挥作用。 它是如何运行的? ENIGMERA 由三条线组成:支撑/阻力线、目标线和偏离线。与一般市场指标将过去的数据推断为现在和未来的情况不同,该系统能提供当前的完整情况。如果你处于支撑位,这意味着真正的支撑;如果你处于阻力位,这意味着真正的阻力。如果突破某一水平,则表示趋势发生变化。没有重绘。 由于市场在不断变化,ENIGMERA 不断调整其评估工具,定期修改策略。  这保证了每种情况都能得到全面评估。这一市场指标的独特性显而易见,其能力不言而喻。  ENIGMERA 为金融分析师和咨询师提供服务,他们需要可靠的见解与客户分享,也为投资者提供服务,他们需要最精确和最可靠的保证。 该系统能够达到最佳精度,使交易者能够自信、清晰地评估他们的选择。 ENIGMERA 将 20 年的交易专长和知识整合到一个综合软件
    All in One Trade
    Alexey Minkov
    4.48 (27)
    The All-in-One Trade Indicator (AOTI) determines daily targets for EURUSD, EURJPY, GBPUSD, USDCHF, EURGBP, EURCAD, EURAUD, AUDJPY, GBPAUD, GBPCAD, GBPCHF, GBPJPY, AUDUSD, and USDJPY. All other modules work with any trading instruments. The indicator includes various features, such as Double Channel trend direction, Price channel, MA Bands, Fibo levels, Climax Bar detection, and others. The AOTI indicator is based on several trading strategies, and created to simplify market analysis. All-in-One
    Please send me Direct message on MQL5 CHAT after purchasing the Indicator for Training and Installation Support There are some additional files that is important to use with the Indicator . So be sure to contact me after purchasing the Indicator So that I can add you for training and support . If you find any difficulty with installation then send me Direct message here So that I can connect with you via Anydesk or Teamview for the product installation. " Smart Order Block Indicator " to find
    作者的更多信息
    Smart Keys Sniper Entry
    Stephen Sanjeeve Sahayam
    这款 2 合 1 交易经理非常适合交易蜡烛突破。它可以通过在回调上放置额外的限价订单来平均交易成本。这可确保您在所有头寸上获得最优惠的价格,并在获胜时获得更高的 RR。风险是根据最近收盘的蜡烛高度来计算的。交易助手按钮有助于管理所有手动下达的订单。 与任何输入方法一起使用;价格行为或指标以及任何交易方式;剥头皮交易、盘中交易或波段交易。 特征: 使用限价订单交易蜡烛突破。 特殊成本平均功能增加了获胜交易的 RR。 限制一次接受的订单数量 - 减少过度交易。 计算风险和按蜡烛时间范围设置止损的一种功能。 通过 RR 设置止盈并确保部分利润。 一键将止损移至入场。 一键关闭部分头寸。 当达到每日收益或损失百分比时,自动关闭所有未平仓交易。 警告!!! 如果您不能或不想阅读用户手册,请勿购买。用户手册仅提供英文版本。 在购买之前,请在策略测试器上测试免费版本,并熟悉每个设置及其工作原理。 我强烈建议租用 1 个月并进行广泛测试,看看它是否适合您的交易风格。 在使用真实账户之前,您必须在模拟账户上测试此交易管理器至少两周。 重要的!!! 购买后请在mql5私信索要用户手册。 默认设置旨在
    Smart Key Trade Manager
    Stephen Sanjeeve Sahayam
    大多数零售交易者无法通过过度冒险或过度交易来管理风险和亏损账户。该工具完全自动化回撤和风险管理,让交易者只关注他们的条目。它是第一个也是唯一一个使用价格行为及其 Aggressive Risk Control 功能的交易管理器,当价格不利于交易时自动关闭部分头寸。这确保了损失始终小于胜利。 可用于任何入场方式和任何交易方式;剥头皮交易、盘中交易或波段交易。 特征: 与所有订单类型一起使用;市价单、止损单和限价单。 带有警报的激进风险控制 (ARC) - 当价格与交易背道而驰时减少回撤。 限制您进行的交易数量 - 减少过度交易。 自动批量计算。 自动或手动设置止损和多个获利水平。 自动或手动将止损移动到盈亏平衡点。 获利时自动或手动关闭部分头寸。 当达到每日收益百分比时关闭所有未平仓交易。 在图表上显示交易历史的选项。 购买后请在 mql5 中留言以获得全面的用户手册。
    Breakout Order Manager
    Stephen Sanjeeve Sahayam
    大多数零售交易者无法通过过度冒险或过度交易来管理风险和亏损账户。该工具完全自动化回撤和风险管理,让交易者只关注他们的条目。它是交易突破或回调的理想选择。它使用先前关闭的蜡烛高度来计算风险,方法是将止损设置在卖出交易的高点上方或买入交易的低点下方。止损位置可按时间范围自定义。缩编时;它通过以预定义的止损百分比自动关闭部分头寸来管理风险。通过风险回报或点值设置多个获利水平。 可用于任何入场方式和任何交易方式;剥头皮交易、盘中交易或波段交易。 特征: 可以使用其独特的“订单类型”设置来交易突破和回调。 使用最近关闭的蜡烛高度自动计算所有限价或止损订单的风险。 当价格接近止损时,使用止损距离方法通过部分平仓自动管理回撤。 使用点值或风险回报方法设置多个获利水平。 可以自动或手动将止损移至入场。 可以自动或手动关闭部分头寸。 当达到每日收益百分比时自动关闭所有未平仓头寸。 当达到每日损失百分比或 $ 值时,自动关闭所有未平仓头寸。 警告!如果您不能或不想阅读用户手册,请勿租用/购买此工具。用户手册是英文的。 购买后请在mql5私信索要用户手册。 请在模拟账户上测试此工具至少 2 周,然
    筛选:
    vincenzo1964
    883
    vincenzo1964 2024.03.28 07:40 
     

    Buongiorno, ho affittato per tre mesi il tuo indicatore, potrei avere un po di supporto e spiegazione per utilizzarlo al meglio? grazie

    Stephen Sanjeeve Sahayam
    1167
    来自开发人员的回复 Stephen Sanjeeve Sahayam 2024.03.28 09:41
    Thank you for your purchase. Kindly private message me in mql5.
    tiagodbc
    46
    tiagodbc 2023.05.26 20:50 
     

    Works like a charm if you properly stick to the trading rules. This takes time and is not a short journey. Steve is very helpful from the beginning on to teach how the indicator works exactly and which concepts, criteria, Risk and Money management you need to have to successfully use the indicator.

    Stephen Sanjeeve Sahayam
    1167
    来自开发人员的回复 Stephen Sanjeeve Sahayam 2023.05.26 21:02
    Thanks very much for your honest review. I'm glad I can assist you on your journey.
    FX167
    196
    FX167 2023.05.12 15:44 
     

    Clear entries based on a clear strategy, primarely on xauusd, on either the m15 or the m30 timeframe. The indicator manual comes with loads of examples but beyond that customer support is excellent. Right after purchase Stephen sheduled a free zoom call with me to go over the indicator and strategy, where the agenda of the call was itemized into detail. Very structured. Other product vendors can learn from that approach. I really feel Steve is not yet another one of those vendors that is only out to make a quick buck off the back of confused traders, but a developer that actually wants to see you succeed and that has been through the same things and the same horrors the average aspiring trader goes through. Scams, going from course to course, signal services. Steve has been there. That is not to say all signal services are bad, more so it is to say, why be dependant on somebody else for the rest of your trading career? Highly recommended.

    Stephen Sanjeeve Sahayam
    1167
    来自开发人员的回复 Stephen Sanjeeve Sahayam 2023.05.12 16:24
    Thanks very much for this honest review. I'm glad our paths crossed. Dont hesitate to ask any questions. All the very best on your journey.
    回复评论
    版本 2.70 2023.07.31
    1.(新)ICT买方和卖方流动性水平(亚洲突袭/伦敦突袭/犹大摇摆)。
    2.(新)前一日高点和前日低点。
    3.(新)心理数字和整数点、二分之一点和四分之一点的图表水平。
    4.(新)每日开盘价。
    5. 错误修复 - 自动绘制支撑/阻力位。
    版本 2.60 2023.07.04
    1.更新了信号蜡烛的代码。
    2. 更新默认设置。
    版本 2.50 2023.06.18
    1. 更新了扩展范围信号蜡烛的代码。
    2. 更新默认设置以适应活跃时段的更高音量。
    版本 2.40 2023.06.04
    1. SR 级别和蜡烛结构过滤器现在包括十字星。
    2.流动性和停止狩猎级别的错误修复。
    3. 入场、止损和获利错误修复。
    版本 2.30 2023.05.01
    更改时间范围时信号方向的错误修复。
    版本 2.20 2023.04.28
    更新 tpsl 线路检测以更快地更改时间范围。
    版本 2.10 2023.04.26
    1. 识别停止搜索级别。
    2. 基于纯价格行为自动绘制支撑/阻力位。
    3. 显示基于动态移动平均线的价格交叉和回调。
    4. 为每个有效信号显示多个入场点、止损点和多个获利水平。
    版本 2.0 2023.02.02
    1. 添加了屏幕按钮以单向查看信号。
    2. 现在可以通过支撑位和阻力位、蜡烛图结构、超大蜡烛图和突破条目进一步过滤信号。
    3. 增加了额外的交易时段。
    4. 全面的用户手册和每次购买的免费交易计划。