One for All Trend Scanner
- 指标
- Sergio Antoni Escudero Tirado
- 版本: 1.0
- 激活: 20
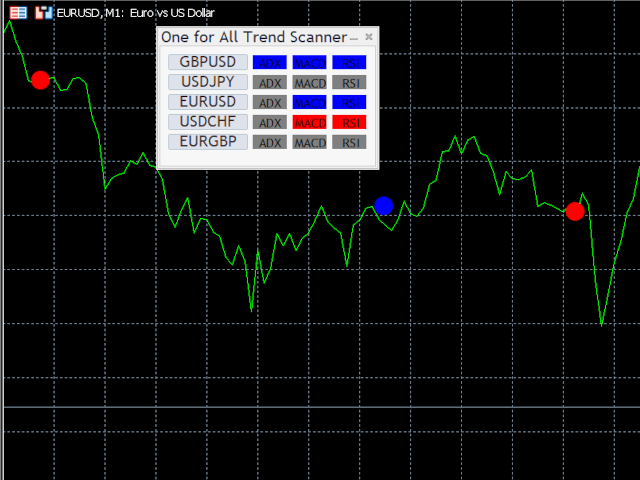
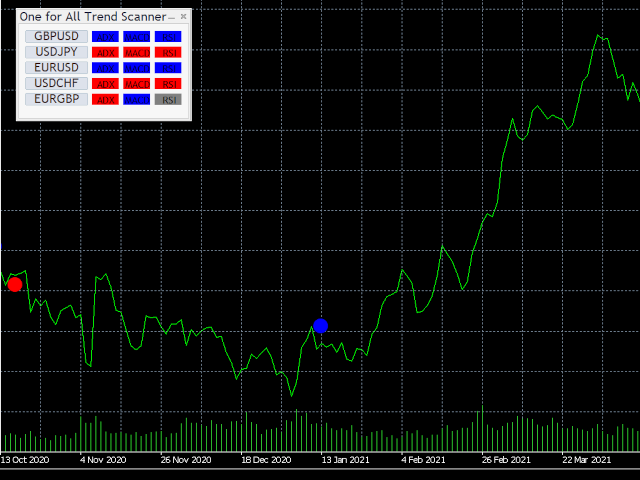
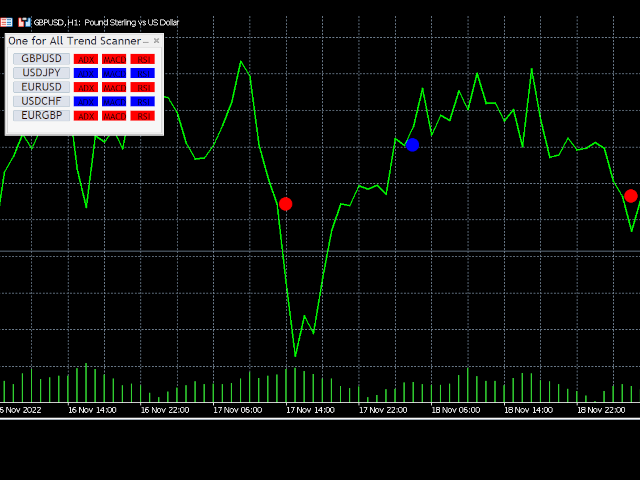
One for All Trend Scanner is a trend following multi-symbol indicator that can be used with any input: forex, stocks, commodities,... The panel shows three indicators and six symbols with the trend for every pair (symbol/indicator): up, down or no trend. The indicators are:
- Average Directional Movement Index (ADX)
- Moving Average Convergence Divergence (MACD)
- Relative Strength Index (RSI)
You can choose which indicators will use for entry/exit and can adjust the parameters of each indicator separately.
When all indicators give a valid buy/sell signal, two events occur:
- If the signal occurs for the chart symbol:
1. A circle will be printed on the chart, in the price/time corresponding. Entry and Exit signals have same criteria (entry buy/exit sell and entry sell/exit buy). There is not separately dibujos for entry/exit.
- If the signal occurs for any of the panel symbol:
2. An alert will be sent. The alerts could be sent for entry, exit, none or both and for any of the panel symbols. There are terminal, push and email alerts.
Trends,signals and alerts are referred to the timeframe of the chart (maybe in next versions it will be multitimeframe)
Recommendations:
- If you have a setting of thousands of max bars in chart, the indicator could too slow
- Always check before send an order. The indicator prefers send false positives that to lose opportunities
- Adjust indicators parameteres accord timeframe
Inputs:
InpBackTrendUp: Background indicator color when trend upInpBackTrendDown: Background indicator color when trend downInpBackNoTrend: Background indicator color when NO trendInpFontSize: Font size for labelsInpColorBuyEntry: Symbol color for buy entry signalInpColorSellEntry: Symbol color for sell entry signalInpSymbol1-6: Symbol 1-6InpAdxPeriod: ADX PeriodInpAdxLimitTrend: ADX Value for set an up/down trendInpAdxBehaviour: ADX Behavoiur for alerts and drawingInpAdxLabel: Panel Label for ADXInpFastEMA: Fast EMA periodInpSlowEMA: Slow EMA periodInpSignalSMA: Signal SMA periodInpMACDAppliedPrice: MACD Applied priceInpMacdBehaviour: MACD Behavoiur for alerts and drawingInpMacdLabel: Panel Label for MACDInpUpRSI: Up limit of RSIInpLowRSI: Low limit of RSIInpRSIPeriod: RSI PeriodInpRSIAppliedPrice: RSI Applied priceInpRsiBehaviour: RSI Behavoiur for alerts and drawingInpRsiLabel: Panel Label for RSIInpLaunchTerminalAlerts: Launch Terminal AlertsInpLaunchPushAlerts: Launch Push Notification AlertsInpLaunchEmailAlerts: Launch Email AlertsInpLaunchEntryAlerts: Launch Entry AlertsInpLaunchExitAlerts: Launch Exit Alerts