Volume Oscillator for MT4
- 指标
- Yashar Seyyedin
- 版本: 1.0
To download MT5 version please click here.
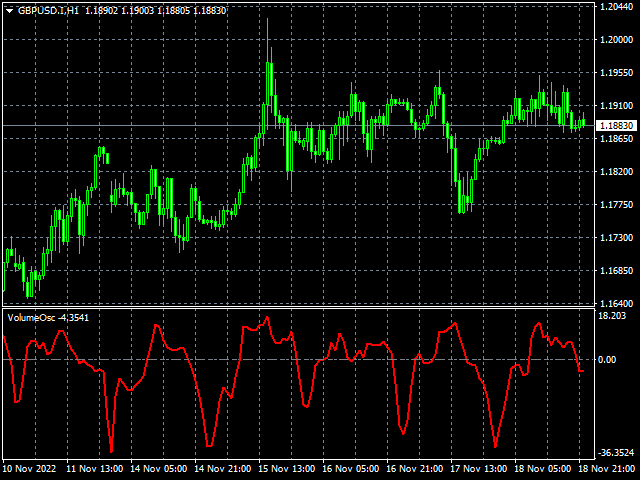
- The Volume Oscillator measures volume by analyzing the relationship between two Moving Averages.
- The Volume Oscillator indicator subtracts a fast MA from slow MA.
- The fast and slow MA periods are configurable via input tab.
- Volume indicators are an ingredient of trading systems to avoid entry in thin liquidity markets.
- Having set a threshold on Volume Oscillator you can avoid entering chop.
- Buffers are available to access via EA.