SuperTrend Indicator for MT5
- 指标
- Vijaykumar Jayantilal Panchal
- 版本: 1.1
- 更新: 10 十一月 2022
- 激活: 5
Supertrend 是一種相對不受歡迎的技術指標,如上所述,由 Olivier Sebam 開發,旨在幫助交易者識別趨勢並了解何時買賣金融資產。該指標在 TradingView 和 MetaTrader 中未作為默認設置。不過,您仍然可以在市場上找到定制的 Supertrend 指標。
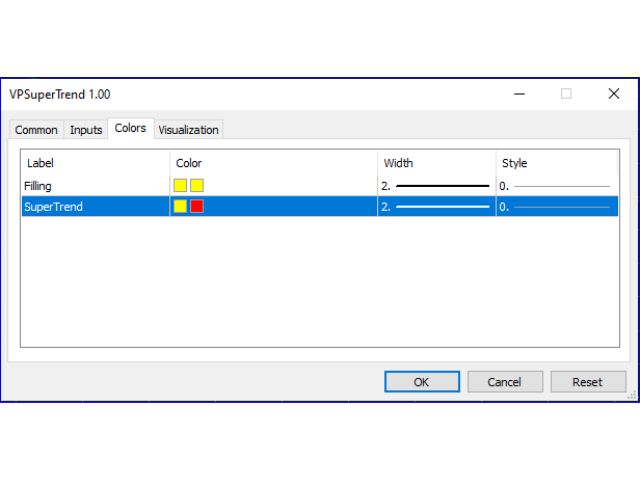
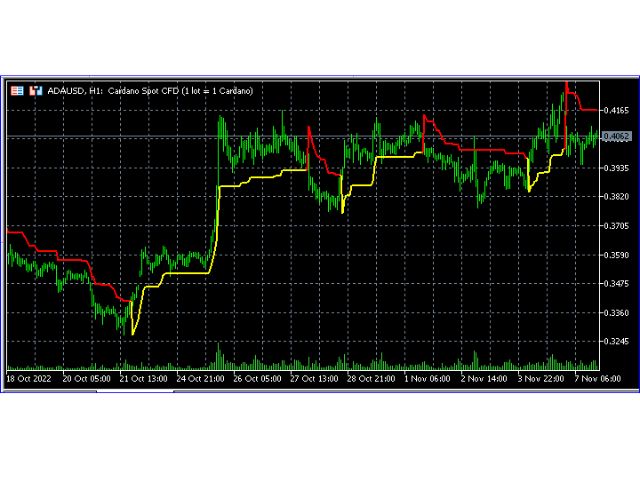
當應用於圖表時,超級趨勢指標以其兩種顏色可見。雖然它們可以更改,但默認顏色通常是紅色和綠色。當它是綠色時,是買入資產的信號,當它是紅色時,是賣出資產的信號。
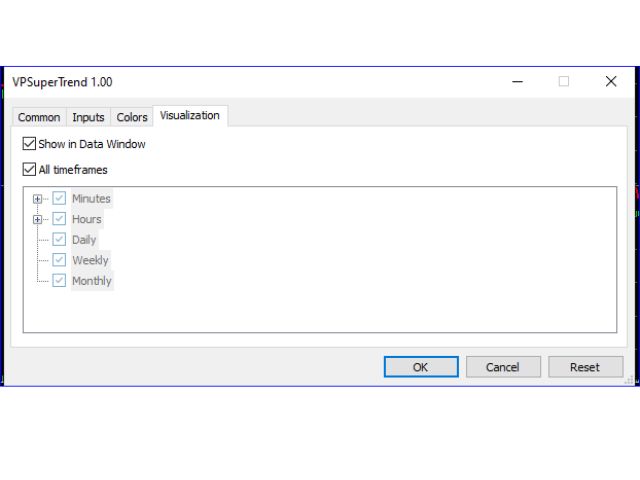
超級趨勢指標適用於所有時間線。它可以在較短的時間範圍內工作,如 5 分鐘或更長的圖表,如每日和每週圖表。
識別買賣信號
如上所示,買入和賣出信號在超級趨勢指標中得到了很好的標記。當價格高於指標的綠色部分時,會出現買入信號。
另一方面,當它移動到指標的紅色部分下方時,就會看到賣出信號。但是,進行多時間框架分析將幫助您確定最佳支撐位和阻力位。
超級趨勢指標的優缺點
超級趨勢指標的優點包括:
易於解釋:即使對於初學者來說,計算也不是很複雜。
預測相當準確:在超級趨勢是可用的最可靠指標之一的趨勢市場中尤其如此。
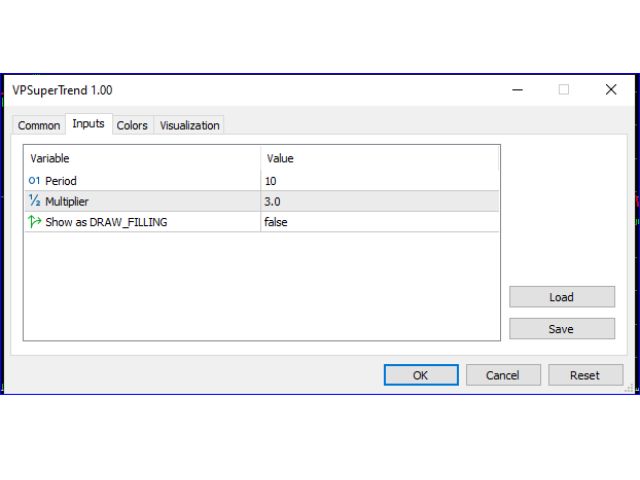
易於配置:由於輸入變量的數量較少,因此可以輕鬆調整以滿足交易者的要求。
不涉及成本:它可在許多免費平台上使用,並且不需要額外的軟件或插件來實現該指標。
高度響應:它可以快速檢測到趨勢的變化,這對於希望在機會到來時立即利用的交易者來說非常方便。
使用它的常見缺點是:
在盤整期間不准確:當市場橫盤整理時,超級趨勢線可能會產生錯誤信號。
結果可能與其他工具相矛盾:它可能會產生可能無助於您的交易決策的對比結果。
可能不適用於所有資產:交易者在使用之前必須確保指標在特定資產中是可靠的。雖然信號可能很強,但它可能並不適用於所有資產。