Heiken Ashi Signal Mt5
- 指标
- Ruslan Latypov
- 版本: 2.0
- 激活: 10
Heiken Ashi信号指标是为MT5交易终端设计的。
它是基于标准的Heiken Ashi指标,该指标在Mt5终端中可用。
该指标可作为手动操作,也可通过作者的专家顾问系统用于自动交易。
要在交易的EA中使用Heiken Ashi信号指标,有信号缓冲区,用于市场进入和打开买入和卖出头寸。
阅读下面的更多内容。
平价信号指标的特征和特点。
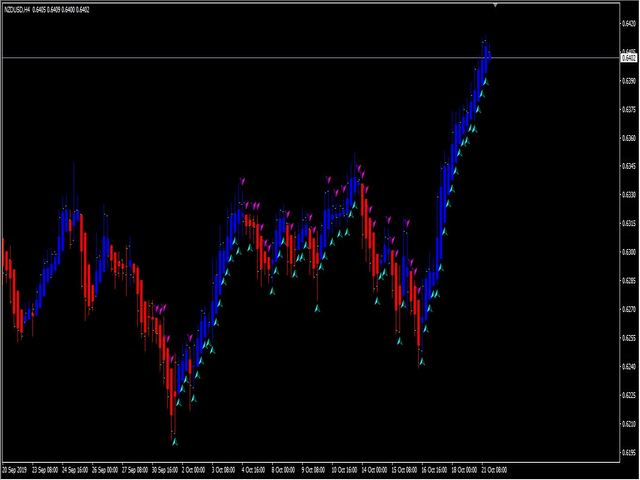
该指标可在任何图表周期内工作。
它可以应用于任何资产(货币对、金属、股票、指数、加密货币)。
在专家顾问中把它应用于自己的策略,把信号作为进入市场的基础。
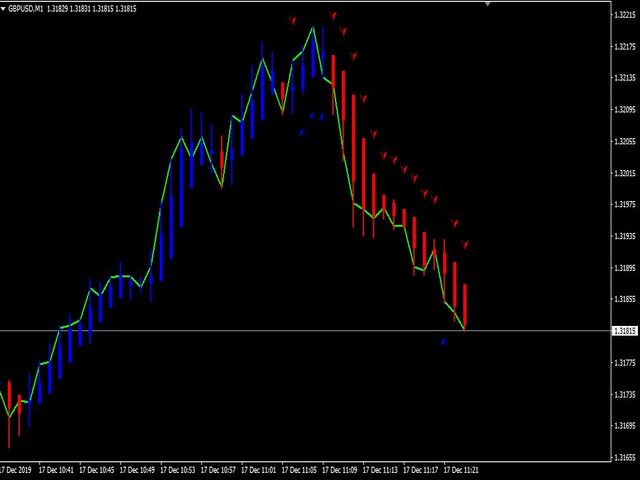
在趋势开始时对价格反转作出及时反应,并产生无滞后的信号。
如果一个信号已经出现,它已经被固定下来,不会从图表中消失。
该指标不会在相邻的柱子上重新画出信号,也不会在柱子上上下移动。
你可以下载演示版,在购买前用任何设置测试该指标的工作。
如果你想在实时图表上使用该指标,你可以暂时租用它。
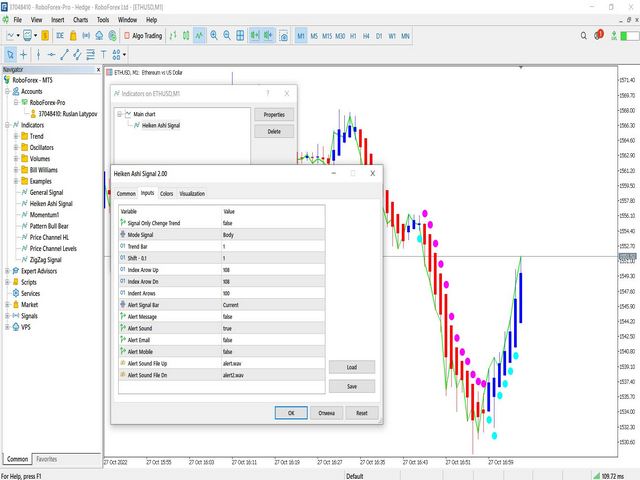
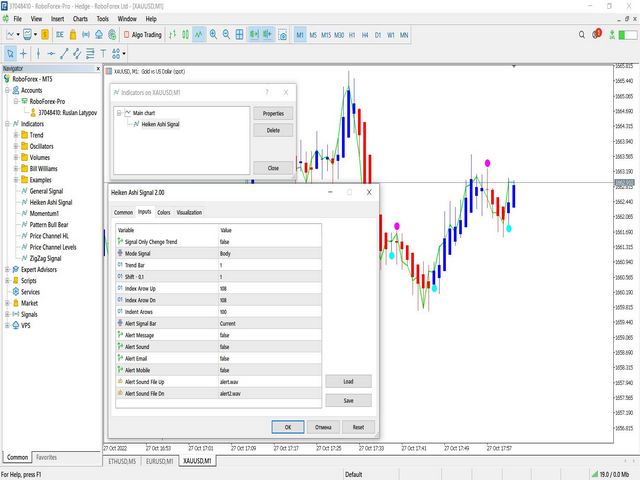
平日里的信号指标设置。
//+------------------------------------------------------------------+
只有信号的Chenge趋势=真;(在趋势开始时的一个信号=真,每个条形上的信号=假)
模式信号=主体/阴影;(信号的蜡烛类型:蜡烛主体=主体,蜡烛阴影=阴影)。
趋势条=1;(对条形的趋势分析)。
Shift = 1; (信号在棒上的移动)
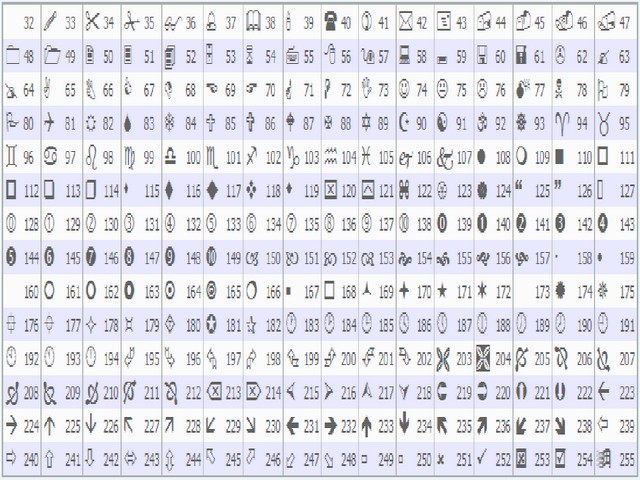
指数Arow Up = 108; (买入信号符号的代码)
指数Arow Dn = 108; (卖出信号符号的代码)。
缩进箭头 = 100; (信号的距离)
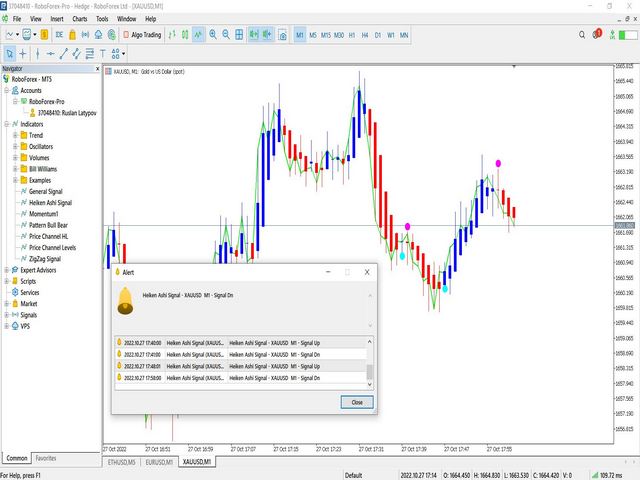
警报信号栏=Tick/Current/Close;(信号栏上的声音:每一个tick,当前时间段,在栏收盘时)。
警报信息 = false;(信号信息与图表上显示的窗口一样)。
警报声=假;信号活动(买入和卖出的声音警报)。
警报电子邮件 = false; 警报到电子邮件(向电子邮件发送信号)。
Alert Mobile = false; 向手机发出警报(推送通知)。
警报声音文件Up = "alert.wav"; (购买的声音文件的名称)
警报声音文件 Dn = "alert2.wav"; (销售用声音文件的名称)。
//+------------------------------------------------------------------+
在专家顾问系统中调用该指标作为信号资源的例子。
//+------------------------------------------------------------------+
#resource "\\Indicators\Heiken Ashi Signal.ex5"
//---
enum enuma
{
sh, // 阴影
bd //身体
};
//---
输入ENUM_ON_OFF UseExtInd1=OFF;//指示器--黑天鹅信号
输入 bool SigOnlyChengeTr1=true;//Signal Only Chenge Trend
//---
int Signal=0。
如果(UseExtInd1==ON)
{
HandleExtInd=iCustom(Sym,TF,":: Indicators\\Heiken Ashi Signal",SigOnlyChengeTr1)。
CopyBuffer(HandleExtInd,6,0,SignalBar+2,ExtInd_up)。
CopyBuffer(HandleExtInd,7,0,SignalBar+2,ExtInd_dw)。
如果(ExtInd_up[SignalBar]>0&ExtInd_up[SignalBar]!=EMPTY_VALUE)信号=1。
如果(ExtInd_dw[SignalBar]>0&ExtInd_dw[SignalBar]!=EMPTY_VALUE)信号=-1。
}
//---
关于在实践和交易中使用该指标的建议。
Heiken Ashi信号指标可用于二元期权交易和一分钟交易时段的剥头皮。
它也可以用于在较高时期的趋势。