• 概述
  • 评论
  • 评论
  • 新特性

Squeezer MT5

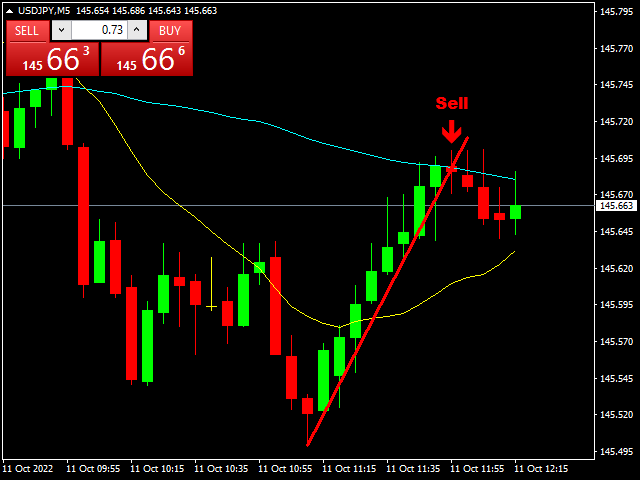
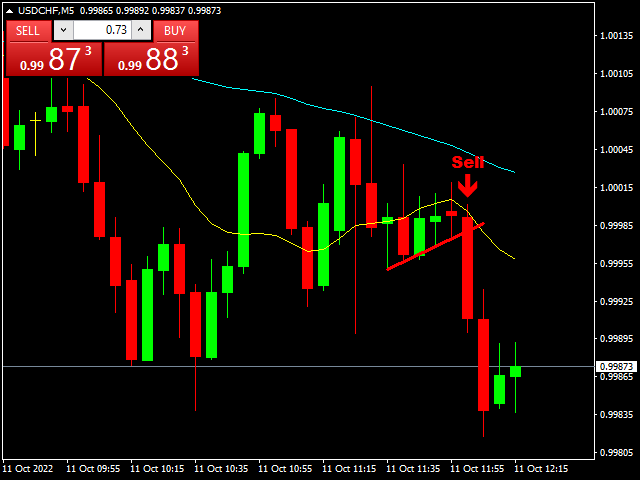
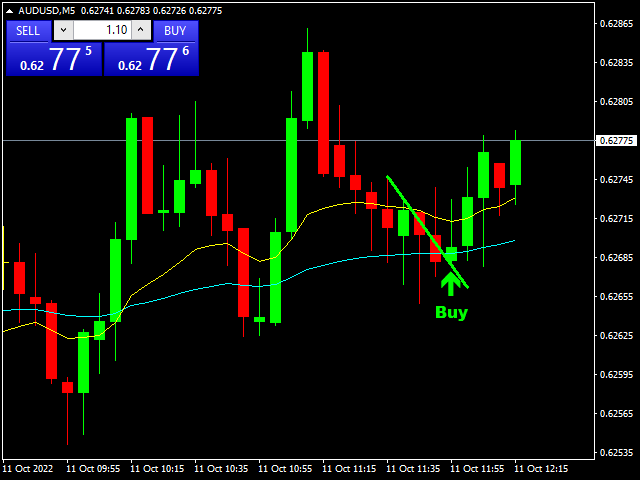
The Squeezer indicator simply draws ascending lines with Sell signal in the downtrend and descending lines with Buy signal in the uptrend to catch the pullbacks and sniper entries. This is a common successful trading strategy being used by many successful traders, and the good thing about this strategy is that it works with all time frames. The difference is in the take profit level between them.

Buy / Sell signals are triggered at the close of the current candles above / below the ascending or descending line.

This indicator was created to publish meaningful signals to your mobile app or on the terminal on your desktop as simple as "Symbol name - Time Frame - Direction".

To know more about this strategy, please refer to the video below from the "Trader DNA" channel.

推荐产品
HMA Trend Professional MT5
Pavel Zamoshnikov
4.4 (5)
Improved version of the free HMA Trend indicator (for MetaTrader 4) with statistical analysis. HMA Trend is a trend indicator based on the Hull Moving Average (HMA) with two periods. HMA with a slow period identifies the trend, while HMA with a fast period determines the short-term movements and signals in the trend direction. The main differences from the free version: Ability to predict the probability of a trend reversal using analysis of history data. Plotting statistical charts for analyz
Owl Smart Levels MT5
Sergey Ermolov
4.31 (39)
MT4版本  |   FAQ Owl Smart Levels Indicator 是一個完整的交易系統,包含 Bill Williams 的高級分形、構建正確的市場波浪結構的 Valable ZigZag 以及標記準確入場水平的斐波那契水平等流行的市場分析工具 進入市場和地方獲利。 策略的详细说明 指示灯使用说明 顾问-贸易猫头鹰助手助理 私人用户聊天 ->购买后写信给我,我会将您添加到私人聊天中,您可以在那里下载所有奖金 力量在於簡單! Owl Smart Levels 交易系統非常易於使用,因此適合專業人士和剛開始研究市場並為自己選擇交易策略的人。 策略和指標中沒有隱藏的秘密公式和計算方法,所有策略指標都是公開的。 Owl Smart Levels 允許您快速查看進入交易的信號,突出顯示下訂單的水平並向您發送有關已出現信號的通知。 優點很明顯: 清楚地顯示主要和更高時間框架的趨勢方向。 指示儀器信號的出現。 標記開單、止損設置和固定利潤的水平。 沒有多餘的,只有必要的結構! ZigZag 表示全球趨勢的方向,因此也表示貿易方向。 市場反轉點的短線清楚地表明在什麼水平上構建斐波
Noize Absorption Index
Ekaterina Saltykova
Noize Absorption Index - is the manual trading system that measures the difference of pressure between bears forces and bulls forces. Green line - is a noize free index that showing curent situation. Zero value of index shows totally choppy/flat market.Values above zero level shows how powerfull bullish wave is and values below zero measures bearish forces.Up arrow appears on bearish market when it's ready to reverse, dn arrow appears on weak bullish market, as a result of reverse expectation.
这种用于从无穷远衡量货币强弱的创新指标是长期交易的黄牛和交易者不可或缺的助手。 分析货币强弱的系统早已被世界领先的交易者所熟知并在市场上使用。 没有这种分析,任何套利交易都是不完整的。 我们的指标很容易确定基础货币相对于彼此的强弱。 它显示所有或当前货币对的折线图,允许即时分析和搜索最强的入口点。 该指标直观,允许您快速找到并切换到任何一对,具有可放置在地下室和主图表上的移动面板。 通知货币强度变化的计时器模式使交易者有机会在手机上收到通知。  使用货币功率计无穷大指示器的几种策略: 1. 使用货币强度的线性显示图表搜索交叉点作为新兴趋势的信号 2. 在趋势反转信号出现后,向强势货币方向反弹 3. 使用货币强度发散分析扭转当前趋势 4. 使用其他无限指标向强势货币方向交易 
Heiken Ashi Smoothed Strategy is a very simple but powerful system to get forex market trend direction. This indicator is actually 2 indicators in 1 pack, Heiken Ashi and Heiken Ashi Smoothed Moving Average both included. Because HA (Heiken Ashi) and HAS (Heiken Ashi Smoothed) are calculated in the same one system event with necessary buffers and loop only, so it is the FAST, OPTIMIZED and EFFICIENT HA having the combined indicator of MetaTrader 5. You can choose to display HA and HAS in the sam
Rainbow EA MT5
Jamal El Alama
Description : Rainbow EA MT5 is a simple Expert advisor based on   Rainbow MT5 indicator witch is based on Moving average with period 34. The indicator is incorporated in the EA, therefore, it is not required for the EA to operate, but if you wish, you can download it from   my product page . The Expert Advisor settings are as follows : Suitable for Timeframes up to H1 The parameters below can be set according to your trading rules. StopLoss ( Stop Loss in pips) TakeProfit ( Take Profit in pi
这个多时间框架和多符号指示器提醒 Heiken Ashi 平滑颜色变化。作为奖励,它还可以扫描赫尔移动平均线颜色(趋势)变化。结合您自己的规则和技术,该指标将允许您创建(或增强)您自己的强大系统。 特征 可以同时监控您的市场报价窗口中可见的所有交易品种。仅将指标应用于一张图表并立即监控整个市场。 可以监控从 M1 到 MN 的每个时间范围,并在识别出颜色变化时向您发送实时警报。支持所有类型的警报。 该指示器包括一个交互式面板。当您单击面板中的信号时,将打开带有相关交易品种和时间范围的新图表。请看下面的截图。 选择延迟一个或多个条形的警报以确认颜色(趋势)变化。 指标可以将信号写入一个文件,EA 可以使用该文件进行自动交易。比如 这个产品 。 输入参数 输入参数的描述和解释可以在 这里 找到。 重要的 请注意,由于具有多功能性,既不会在安装指标的图表上绘制买入/卖出建议,也不会绘制线条和箭头。 强烈建议将指标放在干净(空)图表上,不要在其上放置任何其他可能干扰扫描仪的指标或智能交易系统。
用於確定平面和趨勢的指標。 如果價格低於兩條直方圖和兩條線(紅色和藍色)中的任何一條,則這是一個賣出區域。 購買此版本的指標時,一個真實賬戶和一個模擬賬戶的 MT4 版本 - 作為禮物(收到,給我寫私信)! 如果價格高於兩條直方圖和兩條線(紅色和藍色)中的任何一條,則這是一個買入區域。 MT4 版本: https://www.mql5.com/en/market/product/3793 如果價格在兩條線之間或在任何直方圖的區域內,那麼市場就沒有明確的趨勢。簡單地說,市場是平的。 指標的工作在屏幕截圖中更清楚地顯示。 該指標可用作獨立的交易系統。該指標可用於獲取領先數據或確定當前趨勢的方向。對於任何級別的交易者來說,這都是一個很好的工具!
Binary Options Assistant (BOA) Multi Currency Dashboard for Binary Options (MT5) . You can use any of the BOA Signals Indicators with the dashboard. Just change the BOA Signals Indicator Name in the dashboard settings to the indicator you want to get signals from. For example: CHILL. BLAZE:  BOA_BLAZE_Indicator_v1   Strategy :   BLW Online Trading Binary Options Strategy (3 Moving Average) LAVA:  BOA_LAVA_Indicator_v1   Strategy:   Lady Trader Binary Options Strategy (Bollinger Bands & Stoc
QM Pattern Scanner MT5
Reza Aghajanpour
5 (4)
QM (Quasimodo) Pattern is based on Read The Market(RTM) concepts. The purpose of this model is to face the big players of the market (financial institutions and banks), As you know in financial markets, big traders try to fool small traders, but RTM prevent traders from getting trapped. This style is formed in terms of price candles and presented according to market supply and demand areas and no price oscillator is used in it. RTM concepts are very suitable for all kinds of investments, includi
这个指标用于比较图表上的交易品种与其他几个所选交易品种之间的强弱相对关系。 根据每个交易品种基于相同基准日的价格走势进行比较,可以看到几条不同走向的趋势线,反映出几个不同交易品种之间的强弱关系,这样可以更清楚地了解市场的趋势。 例如,你可以在EURUSD图表上应用这个指标,将其与货币对EURJPY和EURGBP进行比较,看看哪个更强。 你需要为指标输入参数: 需要比较的几个交易品种的名称 您需要选择比较基准日期。 请注意,使用指标前应确保相关交易品种的历史数据已经下载。 免费模拟版本是: https://www.mql5.com/zh/market/product/63921 .............................................
Технический индикатор Universal Oscillator является комбинацией торговых сигналов самых популярных и широко используемых осцилляторов. Индикатор представлен гистограммами, а также линиями fast и slow MA, что позволяет расширить список получаемых торговых рекомендаций и работать как по тренду, так и в боковом движении рынка. Таким образом, гистограммы позволяют определить момент пробоя ценовых значений и движение в новой фазе рынка, а линии указывают на зоны перекупленности и перепроданности.  Ос
This indicator is the same as the popular Heiken Ashi Smoothed. The Heikin Ashi indicator for MetaTrader 5 already exists, but it has two disadvantages: It paints the candles not accurate. It's not possible to change the candle width. See also Heikin Ashi in MQL5 Code Base . In this version there are no such disadvantages.
Volality Index Scalper
Lesedi Oliver Seilane
5 (1)
Volality Index scalper indicator  Meant for Volality pairs such as Volality 10, 25, 50, 75 and 100 The indicator works on all timeframes from the 1 minute to the monthly timeframe the indicator is non repaint the indicator has 3 entry settings 1 color change on zero cross 2 color change on slope change 3 color change on signal line cross Orange line is your sell signal Blue line is your buy signal.
Buy CTS scalping indicator, provide buying and selling signals, automatic channeling and sending signals to mobile phones Using technical analysis and price action methods and modern methods, CTS indicator can draw price channels and recognize price trends with high accuracy and issue entry and exit signals according to them. Traders can easily fluctuate using this indicator in different time frames and in different markets. With the CTS indicator, you can signal in different ways. This indicat
Introduction The "Two Moving Average Crossover" indicator for MetaTrader 5 (MT5) is a technical analysis tool that displays two moving averages and notifies when the moving averages cross each other. The indicator calculates and plots two moving averages, one of which is faster and the other is slower. When the faster moving average crosses above the slower moving average, it is considered a bullish signal, indicating a potential trend reversal or the start of a new uptrend. Conversely, when th
首先,值得强调的是,这个交易工具是非重绘、非重画和非滞后的指标,非常适合专业交易。 在线课程,用户手册和演示。 智能价格行动概念指标是一个非常强大的工具,既适用于新手,也适用于经验丰富的交易者。它将超过20个有用的指标合并到一个指标中,结合了高级交易思想,如内圈交易员分析和智能资金概念交易策略。该指标侧重于智能资金概念,提供有关大型机构交易方式的见解,帮助预测它们的动向。 它在流动性分析方面尤其擅长,有助于理解机构的交易方式。它擅长预测市场趋势,并仔细分析价格波动。通过将您的交易与机构策略对齐,您可以更准确地预测市场走向。该指标多才多艺,擅长分析市场结构,识别重要的订单区块,并识别各种模式。 它擅长识别BOS和CHoCH等模式,理解动量的转变,并突出显示供需强劲的关键区域。它还擅长发现强大的不平衡,并分析价格创造更高高点或更低低点的模式。如果您使用斐波那契回撤工具,该指标可以满足您的需求。它还可以识别相等的高点和低点,分析不同的时间框架,并通过仪表板显示数据。 对于使用更高级策略的交易者,该指标提供了工具,如公平价值差指标和优惠和折扣区域的识别。它特别关注高时间框架订单
PZ Mean Reversion MT5
PZ TRADING SLU
3 (2)
采用专业和量化方法进行均值回归交易的独特指标。它利用了价格以可预测和可衡量的方式转移并返回均值这一事实,这允许明确的进入和退出规则大大优于非量化交易策略。 [ Installation Guide | Update Guide | Troubleshooting | FAQ | All Products ] 清晰的交易信号 非常容易交易 可定制的颜色和尺寸 实现性能统计 优于大多数交易策略 显示合适的止损和止盈水平 它实现了电子邮件/声音/视觉警报 这个怎么运作 该指标从更高的时间范围测量完全可定制的移动平均线的标准偏差,并使用趋势跟踪方法精确地找到交易。交易是通过深入当前图表的价格行为发现的,并在价格返回到平均价格区间时关闭,根据您选择的更高时间范围计算。由于其编码方式,该指标将远离高波动性和强劲趋势市场,并且仅在可预测的情况下进行交易,在可接受的波动性与方向性比率范围内,回归均值是可行的。 指标剖析 绿线是更高时间范围内的移动平均线(也就是平均值) 虚线区域是移动平均线周围的典型价格区间 蓝线是看涨交易的突破价格 红线是看跌交易的突破价格 交易是针对均值进行的,并在
Trade history
Andriy Konovalov
5 (4)
The indicator plots charts of profit taken at the Close of candles for closed (or partially closed) long and short positions individually. The indicator allows to filter deals by the current symbol, specified expert ID (magic number) and the presence (absence) of a substring in a deal comment, to set the start time and the periodicity of profit reset (daily, weekly or monthly) to calculate the profit chart. The indicator also displays the floating (not fixed) profit of the opened positions at th
Antique Trend
Nadiya Mirosh
The Antique Trend Indicator is a revolutionary trend trading and filtering solution with all the important features of a trend tool built into one tool! The Antique Trend indicator is good for any trader, suitable for any trader both for Forex and binary options. There is no need to configure anything, everything has been perfected by time and experience, it works great during flats and trends. The Antique Trend indicator is a tool for technical analysis of financial markets, reflecting curre
An indicator of pattern #31 ("Long Island") from Encyclopedia of Chart Patterns by Thomas N. Bulkowski. The second gap is in the opposite direction. Parameters: Alerts - show alert when an arrow appears   Push - send a push notification when an arrow appears (requires configuration in the terminal) GapSize - minimum gap size in points ArrowType - a symbol from 1 to 17 ArrowVShift - vertical shift of arrows in points   ShowLevels - show levels ColUp - color of an upward line ColDn - color of a
Indicator and Expert Adviser  EA Available in the comments section of this product. Download with Indicator must have indicator installed for EA to work. Mt5 indicator alerts for bollinger band and envelope extremes occurring at the same time. Buy signal alerts occur when A bullish candle has formed below both the lower bollinger band and the lower envelope  Bar must open and close below both these indicators. Sell signal occur when A bear bar is formed above the upper bollinger band and upp
PZ Penta O MT5
PZ TRADING SLU
The Penta-O is a 6-point retracement harmonacci pattern which usually precedes big market movements. Penta-O patterns can expand and repaint quite a bit. To make things easier this indicator implements a twist: it waits for a donchian breakout in the right direction before signaling the trade. The end result is an otherwise repainting indicator with a very reliable trading signal. The donchian breakout period is entered as an input. [ Installation Guide | Update Guide | Troubleshooting | FAQ | A
Trend Reader Indicator MT5
Lachezar Krastev
5 (2)
PROMOTION: BUY 1 GET 1 FREE! --> Buy Trend Reader Indicator with -50% OFF + 1 FREE EA! NOTE: Promo price: $147 ( Regular Price: $297) - The offer ends soon!  For more info about the promotion and possible free EAs, contact me! Trend Reader Indicator is a revolutionary trading indicator designed to empower forex traders with the tools they need to make informed trading decisions. This cutting-edge indicator utilizes complex mathematical calculations and the Average True Range (ATR) indicator to
该指标找到AB = CD回撤形态。 AB = CD回调模式是一种4点价格结构,其中初始价格区间被部分回调,然后与回调完成后等距移动,这是所有谐波模式的基本基础。 [ 安装指南 | 更新指南 | 故障排除 | 常见问题 | 所有产品 ] 可定制的图案尺寸 可定制的AC和BD比率 可定制的突破时间 可定制的线条,颜色和大小 它根据CD纤维水平显示SL和TP水平 视觉/声音/推送/邮件警报,用于模式和突破 AB = CD Retracements可以扩展和重新绘制很多内容。为了使事情变得更容易,该指标实施了一个转折:它在向交易发出信号之前等待正确方向的Donchian突破。最终结果是带有非常可靠的交易信号的重新粉刷指示器。输入donchian突破时段作为输入。 看涨回撤是蓝色的 空头回撤是红色的 请注意,价格模式(例如AB = CD)可以扩展,指标必须重新绘制以跟随该模式的扩展。如果图案重涂超出了参数中输入的AC / BD / AB = CD比率,则该图案将消失,因为它将不再有效。要交易这些模式,请求助于donchian突破信号。 输入参数 幅度:AB = C
Trend Monitor MT5
Pavel Zamoshnikov
3.67 (3)
The indicator generates early signals basing on ADX reading data combined with elements of price patterns. Works on all symbols and timeframes. The indicator does not redraw its signals. You see the same things on history and in real time. For better visual perception signals are displayed as arrows (in order not to overload the chart). Features The best results are obtained when the indicator works on two timeframes. For example: M30 – the indicator shows the main trend; M5 – the indicator ge
Cumulative Delta NG
Anton Polkovnikov
Cumulative delta indicator As most traders believe, the price moves under the pressure of market buying or selling. When someone redeems an offer standing in the cup, the deal is a "buy". If someone pours into the bid standing in the cup - the deal goes with the direction of "sale". The delta is the difference between purchases and sales. A cumulative delta - the difference between the cumulative sum of purchases and sales for a certain period of time. It allows you to see who is currently contr
Scanner
Ervand Oganesyan
多时间框架和多符号市场扫描仪。该指标将在您选择的所有工具和时间框架上测试所选的技术策略,并在几分之一秒内显示扫描结果。 用例 启动指标,设置交易时间和交易逻辑。确保扫描结果在大多数工具上都是有利可图的,然后通过单击鼠标切换到预期图表。交易信号已准备就绪。确保信号频率适合您,如有必要,请使用“触发灵敏度”选项进行更改。设置屏幕和电话警报。一切已为实时交易做好准备。 特征 - 时间和交易逻辑可自定义。选择顺势、逆势、局部突破、均值回归策略。设置是否在亚洲、伦敦、纽约交易时段进行交易。 - 扫描结果可滚动并按获胜概率排序,可点击切换到扫描图表并绘制交易。 - 不重绘,不滞后。 - 止损和目标根据符号波动性动态计算。对于固定止损,将“最小止损”设置为等于“最大止损”,将“最小获利”设置为等于“最大获利”。 - 可评估的自动交易缓冲区。以下是缓冲区数字:0 - 买入,1 - 卖出,2 - 平仓买入,3 - 平仓卖出,4 - 止损,5 - 获利。这些值是针对打开图表的最后一条柱设置的。 - 在策略测试器中工作。 --- 根据可检查和可重复的数据做出交易决策。如对此指标工作有任何疑问,请
To get access to MT4 version please click here . - This is the exact conversion from TradingView: "Stochastic Momentum Index" By "UCSgears". - This is a popular version of stochastic oscillator on tradingview. - This is a light-load processing and non-repaint indicator. - Buffers are available for the lines on chart. - You can message in private chat for further changes you need. Thanks for downloading
该产品的买家也购买
Atomic Analyst MT5
Issam Kassas
4.79 (19)
首先值得强调的是,该交易指标是非重绘、非延迟的指标,这使其成为手动和机器人交易的理想选择。 用户手册:设置、输入和策略。 Atomic Analyst是一种PA价格行动指标,利用价格的力量和动量来寻找市场上更好的机会。配备了高级过滤器,可帮助去除噪音和假信号,并提高交易潜力。使用多层复杂的指标,Atomic Analyst扫描图表,并将复杂的数学计算转化为任何初学者都能理解并用来做出一致交易决策的简单信号和颜色。 “Atomic Analyst”是专为新手和经验丰富的交易者量身定制的综合交易解决方案。它将高级指标和一流功能融合为一体的交易策略,使其成为所有类型交易者的多功能选择。 日内交易和剥头皮策略:专为快速准确的日内交易和短期交易而设计。 日内和摆动交易策略:可用作追求价格大幅波动的日内和摆动交易者的可靠工具。 多货币和市场:凭借其可靠的精度,在不同的工具和市场上运作。 多个时间框架:可在多个时间框架上使用,性能良好。 稳定性:所有指标均不重绘、不重绘和不滞后,确保可靠的信号。 信号清晰度:提供箭头信号,用于清晰的入场和出场点。 实时警报:通过交易入场、SL和TP警报通知交
Atbot
Zaha Feiz
4.96 (28)
AtBot: 它是如何工作的以及如何使用它 ### 它是如何工作的 “AtBot”指标用于MT5平台,通过结合技术分析工具生成买入和卖出信号。它集成了简单移动平均线(SMA)、指数移动平均线(EMA)和平均真实波幅(ATR)指标,以识别交易机会。此外,它还可以利用Heikin Ashi蜡烛来增强信号的准确性。 购买后留下评论,您将获得特别的奖励礼物。 ### 主要特点: - 不重绘: 信号在绘制后不会改变。 - 不变动: 信号保持一致,不会被更改。 - 无延迟: 提供及时的信号,没有延迟。 - 多种时间框架: 可在任何时间框架上使用,以适应您的交易策略。 ### 操作步骤: #### 输入和设置: - firstkey (TrendValue): 调整趋势检测的灵敏度。 - Secondkey (SignalValue): 定义买入/卖出信号生成的灵敏度。 - masterkey (ExitValue): 控制信号的退出策略。 - h: 切换是否根据Heikin Ashi蜡烛生成信号(真/假)。 - notifications: 启用或禁用信号提醒。 #### ATR计算: ATR测
首先,值得强调的是,这个交易系统是一个非重绘、非重画和非滞后的指标,这使得它非常适合手动和机器人交易。 在线课程,手册和下载预设。 “智能趋势交易系统 MT5”是专为新手和经验丰富的交易者量身定制的综合交易解决方案。它结合了超过 10 个优质指标,具有 7 多个强大的交易策略,使其成为适用于各种市场条件的多功能选择。 趋势跟随策略:提供精确的入场和止损管理,以有效地跟随趋势。 反转策略:识别潜在的趋势反转,使交易者能够利用区域市场的机会。 剃头策略:专为快速准确的日内交易和短期交易而设计。 稳定性:所有指标都不会重绘、不会重画和不会滞后,确保可靠的信号。 定制:支持自定义策略,以满足个人交易偏好。超过 7 种策略和组合可帮助您找到最佳策略。 信号清晰度:提供箭头信号,以指示清晰的入场和退出点。 实时警报:通过交易进出警报使交易者保持了解。 深入分析:提供更高时间框架的趋势分析和实时交易监控。 自适应颜色编码:利用蜡烛颜色编码来显示成交量、趋势和反转蜡烛信号。通过蜡烛颜色分析市场方向。 “智能趋势交易系统 MT5”赋予交易者必要的工具,以便在各种市场条件下做出明智和战略性的交易决策。无论
Gold Stuff mt5
Vasiliy Strukov
4.9 (185)
Gold Stuff mt5 是专为黄金设计的趋势指标,也可用于任何金融工具。 该指标不会重绘,也不会滞后。 推荐时间框架 H1。 购买后立即联系我以获得设置和个人奖励!   你可以在我的个人资料中找到它。   重要! 购买后立即与我联系,以获得说明和奖金!   您可以免费收到我们的强力支持和趋势扫描指标的副本,请私信。大部头书!   设置 绘制箭头 - 打开关闭。 在图表上绘制箭头。 警报 - 打开关闭声音警报。 电子邮件通知 - 打开关闭。 电子邮件通知。 Puch-notification - 打开关闭。 推送通知。 接下来,调整色域。 Gold Stuff mt5 是专为黄金设计的趋势指标,也可用于任何金融工具。 该指标不会重绘,也不会滞后。 推荐时间框架 H1。 购买后立即联系我以获得设置和个人奖励!   设置 绘制箭头 - 打开关闭。 在图表上绘制箭头。 警报 - 打开关闭声音警报。 电子邮件通知 - 打开关闭。 电子邮件通知。 Puch-notification - 打开关闭。 推送通知。 接下来,调整色域。
TPSpro RFI Levels MT5
Roman Podpora
4.67 (9)
Reversal First Impulse levels (RFI)      INSTRUCTIONS        RUS       -       ENG              R ecommended to use with an indicator   -   TPSpro  TREND PRO -  Version MT4                 A key element in trading is zones or levels from which decisions to buy or sell a trading instrument are made. Despite attempts by major players to conceal their presence in the market, they inevitably leave traces. Our task was to learn how to identify these traces and interpret them correctly. Main functi
Entry Points Pro for MT5
Yury Orlov
4.56 (163)
这款指标用于 MT5,可提供准确的入场交易信号,且无重绘。 它可应用在任何金融资产:外汇、加密货币、贵金属、股票、指数。 它将提供极其精准的评估,并告诉您何时开仓和平仓的最佳时机。 观看 视频 (6:22),其中包含一个仅处理单一信号的示例,该信号即可值回指标购价! 大多数交易者在 Entry Points Pro 指标的帮助下,在第一个交易周内即改善了他们的交易结果。 订阅我们的 Telegram 群 ! Entry Points Pro 指标的益处。 入场信号无重绘 如果信号出现,并得到确认,则它不会再消失;不像是重绘指标,它会导致重大的财产损失,因为它们可以在显示信号后再将其删除。 无差错开仓 指标算法可令您找到入场交易(买入或卖出资产)的理想时机,从而提高每位交易者的成功率。 Entry Points Pro 可操作任何资产 它允许您在 MT5 平台上交易任何经纪商的加密货币、股票、贵金属、指数、大宗商品和货币。 提供任何方向的信号 Entry Points Pro 指标提供针对任意价格走势的入场交易信号 - 上涨、下跌或横盘(横向)。
Quantum Trend Sniper
Bogdan Ion Puscasu
4.92 (48)
介绍   量子趋势狙击指标 ,突破性的 MQL5 指标,正在改变您识别和交易趋势反转的方式!由拥有超过13年交易经验的资深交易员团队开发,     量子趋势狙击指标   旨在通过其创新的方式以极高的准确度识别趋势反转,将您的交易之旅推向新的高度。 ***购买量子趋势狙击指标,即可免费获得量子突破指标!*** 当量子突破指标识别出趋势反转时,它会向您发出警报和信号箭头,并建议您三个止盈水平。 它既适合新手交易者,也适合专业交易者。 量子 EA 通道:       点击这里 MT4版本:       点击这里 建议: 时间范围: 所有时间范围。为了获得最佳结果,我们建议在 M15、M30 和 H1 时间范围内使用它。 货币对:欧元兑美元、英镑兑美元、澳元兑美元、欧元兑英镑、, EURAUD,  XAUUSD 账户类型:ECN、Raw 或 Razor,点差极低 经纪时间:任意 经纪商:IC Markets、Pepperstone with Raw 和 Razor 的点差最低 建议止损:50 点 建议止盈水平:20 点、50 点和
Trend Screener Pro MT5
STE S.S.COMPANY
4.88 (67)
使用趋势筛选指标释放趋势交易的力量:由模糊逻辑和多货币系统提供支持的终极趋势交易解决方案! 使用趋势筛选器(由模糊逻辑提供支持的革命性趋势指标)提升您的趋势交易。 它是一个强大的趋势跟踪指标,结合了超过 13 种高级工具和功能以及 3 种交易策略,使其成为使您的 Metatrader 成为趋势分析器的多功能选择。 限时优惠:趋势筛选指标终身仅需 50 美元。 ( 原价 125$ ) (优惠延长) 体验趋势筛选器 100% 无需重新绘制的准确性,确保您的交易决策不受过去价格变化的影响。 释放多时间框架和多货币功能的多功能性,使您能够以无与伦比的信心在外汇、商品、加密货币和指数领域进行交易。 利用 Trend Screener 的综合策略套件增强您的交易: - 趋势跟踪策略和趋势延续策略 :趋势筛选器的趋势跟踪策略提供清晰的趋势延续信号,让您有效捕捉趋势走势并管理风险。 - 反转策略和早期入场点策略 :趋势筛选器的反转策略可检测市场方向的潜在变化,使您能够预测趋势反转并利用疲弱的市场趋势。通过早期入场点,您可以在潜在的趋势变化之前定位自己 获取可观的利润。 - 倒卖策略: 趋势筛选器的倒卖
FX Power MT5 NG
Daniel Stein
5 (6)
通过 mql5 和 Telegram 上 的晨间简报获取每日市场更新,包括详细信息和屏幕截图 ! FX Power MT5 NG 是我们长期以来非常受欢迎的货币强度计算器 FX Power 的下一代产品。 这款下一代强度计算器能提供什么?您所喜爱的原版 FX Power 的所有功能 附加功能 黄金/XAU 强度分析 更精确的计算结果 可单独配置的分析周期 可自定义计算限制,以获得更好的性能 为希望查看更多信息的用户提供特殊的多实例设置 无尽的图形设置,可在每个图表中设置您最喜欢的颜色 无数的通知选项,让您再也不会错过任何重要信息 采用 Windows 11 和 macOS 风格的全新圆角设计 神奇的移动指标面板 FX Power 主要功能 所有主要货币的完整强势历史 所有时间框架内的货币强弱历史 所有经纪商和图表的计算结果完全相同 100% 可靠的实时计算 -> 无重绘 可通过下拉列表选择分析时段 通过自定义模式单独配置分析时段 可在一个图表中使用多个实例 可移动 FX Power 显示屏(通过拖放) 适用于高分辨率 QHD、UHD 和 4K 显示器 自动终端配置 针对平板电脑
FX Volume MT5
Daniel Stein
4.94 (17)
通过 mql5 和 Telegram 上 的 " 晨间简报 "获取每日市场更新,包括详细信息和屏幕截图 ! 外汇交易量(FX Volume)是第一个也是唯一一个从经纪商角度真正洞察市场情绪的交易量指标。 直接在您的图表上看到这些信息是真正改变游戏规则和突破性的交易解决方案。 受益于独特的市场数据洞察,如 比率(Ratios )显示货币多头和空头头寸的比率(百分比 比率变化 显示所选时间段内的多头比率及其百分比变化 总交易量 显示货币的总交易量(多头和空头),以手为单位 多头 交易量显示货币所有多头头寸的交易量 空头 交易量显示所有货币空头头寸的交易量 净多头 显示净多头交易量,即所有多头头寸减去所有空头头寸(以手为单位)。 净多头百分比 显示货币净多头交易量的变化 请阅读我们的基本教程 -> "如何使用外汇交易量进行交易 " 获取更多信息,如常见问题、交易技巧和教程视频,请访问我们的 外汇交易量公共信息频道 请 安装并运行 SI Connect 以建立与我们数据中心的持续连接 背景信息 我们都知道,外汇是一个分散的市场。这就是为什么我们必须打破常规思维,开发一个独
IX Power MT5
Daniel Stein
4.17 (6)
IX Power 终于将 FX Power 的无与伦比的精确性带到了非外汇交易符号中。 它能准确判断您喜爱的指数、股票、商品、ETF 甚至加密货币的短期、中期和长期趋势强度。 您可以 分析 终端提供的 一切 。试试吧,体验一下您在交易时如何把握 时机 。 IX Power 主要功能 100% 精确的非重绘计算结果 - 适用于您终端中的所有交易符号 下拉式选择预配置以及可单独配置的强度分析周期 通过电子邮件、消息和手机通知的无数种通知选项 可访问的 EA 请求缓冲区 可自定义计算限制,以获得更好的性能 为希望查看更多信息的用户提供特殊的多实例设置 无尽的图形设置,让您在每个图表中都能找到最喜欢的颜色 采用 Windows 11 和 macOS 风格的圆角新面板设计 神奇的移动指标面板,可在子窗口和主图表之间无缝移动 适用于高分辨率 QHD、UHD 和 4K 显示器,并针对平板电脑和触摸屏进行了优化 IX Power 参数 最重要的参数不言自明,但我们很快会在另一篇文章中为您提供所有 IX Power 参数的完整说明。 使用别名 "参数可为技术交易符号
XQ Indicator MetaTrader 5
Marzena Maria Szmit
3.5 (2)
Step into the realm of Forex trading with confidence and precision using XQ, a cutting-edge Forex indicator designed to elevate your trading game to unprecedented heights. Whether you're a seasoned trader or just stepping into the world of currency exchange, XQ Forex Indicator empowers you with the insights and signals needed to make informed trading decisions. The signal conditions are a combination of three indicators, and XQ Forex Indicator only display  medium and long-term trends . The ind
Easy Buy Sell Signal Alert
Franck Martin
4.86 (7)
Easy By Sell is a market indicator for opening and closing positions. It becomes easy to track market entries with alerts. It indicates trend reversal points when a price reaches extreme values ​​and the most favorable time to enter the market. it is as effective as a Fibonacci to find a level but it uses different tools such as an algorithm based on ATR indicators and Stochastic Oscillator. You can modify these two parameters as you wish to adapt the settings to the desired period. My othe
该仪表盘显示所选符号的最新可用谐波形态,因此您可以节省时间并提高效率 /  MT4 版本 。 免费指标:  Basic Harmonic Pattern 指标列 Symbol:   显示所选符号 Trend:     看涨或看跌 Pattern:    形态类型(Gartley、蝴蝶、蝙蝠、螃蟹、鲨鱼、Cypher 或 ABCD) Entry:     入口价格 SL: 止损价 TP1: 第一止盈价 TP2: 第二次获利价格 TP3: 第三次获利价格 Current price:    当前价格 Age (in bars):   最后绘制的模式的年龄 主要输入 Symbols :   从 "28 种主要货币对 "或 "选定符号 "中选择。 Selected Symbols :   希望监控的符号,用逗号分隔("EURUSD,GBPUSD,XAUUSD")。如果您的经纪商为货币对设置了后缀或前缀,您必须在以下两个参数中添加(货币对前缀或货币对后缀)。 Max Iteration:   调整模式的最大迭代次数(如果该值越小,则模式越少,性能越快;如果该值越大,则模式越多,性能
TrendMaestro5
Stefano Frisetti
note: this indicator is for METATRADER4, if you want the version for METATRADER5 this is the link:  https://www.mql5.com/it/market/product/108106 TRENDMAESTRO ver 2.4 TRENDMAESTRO recognizes a new TREND in the bud, he never makes mistakes. The certainty of identifying a new TREND is priceless. DESCRIPTION TRENDMAESTRO identifies a new TREND in the bud, this indicator examines the volatility, volumes and momentum to identify the moment in which there is an explosion of one or more of these data a
Golden Spikes Premium
Kwaku Bondzie Ghartey
Golden Spikes Detector Overview: The Golden Spikes Premium is a groundbreaking trading indicator meticulously crafted for the Boom and Crash indices on the Deriv market. Tailored to meet the needs of discerning traders, this powerful tool operates exclusively on the one-minute timeframe, providing timely and precise signals to maximize your trading potential. The Golden Spikes Detector stands out in its ability to deliver accurate signals, ensuring that you capitalize on market opportunities wit
Gartley Hunter Multi
Siarhei Vashchylka
5 (8)
Gartley Hunter Multi - An indicator for searching for harmonic patterns simultaneously on dozens of trading instruments and on all possible timeframes. Manual (Be sure to read before purchasing) | Version for MT4 Advantages 1. Patterns: Gartley, Butterfly, Shark, Crab. Bat, Alternate Bat, Deep Crab, Cypher 2. Simultaneous search for patterns on dozens of trading instruments and on all possible timeframes 3. Search for patterns of all possible sizes. From the smallest to the largest 4. A
PZ Support Resistance MT5
PZ TRADING SLU
4.17 (6)
厌倦了绘制支撑线和阻力线? 支撑阻力 是一个多时间指标,可以自动检测并绘制图表中的支撑线和阻力线,并具有非常有趣的变化:随着时间的推移测试价格水平及其重要性的提高,线变得越来越粗。 [ 安装指南 | 更新指南 | 故障排除 | 常见问题 | 所有产品 ] 一夜之间增强您的技术分析 无需浏览图表即可检测重要的价格水平 一目了然地识别所有价格水平的相对优势 每次交易最多可节省半小时的绘图线 指标显示所有价格水平的期限 指示器不重涂 过去和现在的价格水平因接近程度而崩溃,并根据当前的市场行为进行了调整。在动作发生的地方绘制了线条,而不一定在峰值处绘制了线条。 价格水平随着时间的推移而被拒绝,变得越来越暗 定期清除不重要的价格水平以避免噪音 可自定义的时间范围选择和崩溃因子 它实现了电子邮件/声音/推送警报的突破 输入参数 指标设置:指标将从当前时间段读取价格,但您可以选择另一个。例如,您可以在H4图表中显示D1支撑线和阻力线。您还可以使用 价格水平密度 参数选择在图表上显示多少价格水平。 颜色设置:根据重要性输入所需的支撑线和阻力线颜色。 标签设置:(可选)可以在指示器
Matrix Arrow Indicator MT5
Juvenille Emperor Limited
5 (14)
矩阵箭头指标 MT5   是一种独特的 10 合 1 趋势,遵循   100% 非重绘多时间框架指标 ,可用于所有符号/工具: 外汇 、 商品 、 加密货币 、 指数 、 股票 。 Matrix Arrow Indicator MT5 将在其早期阶段确定当前趋势,从多达 10 个标准指标中收集信息和数据,它们是: 平均定向运动指数 (ADX) 商品渠道指数 (CCI) 经典 Heiken Ashi 蜡烛 移动平均线 移动平均收敛散度 (MACD) 相对活力指数 (RVI) 相对强弱指数 (RSI) 抛物线SAR 随机振荡器 威廉姆斯的百分比范围 当所有指标给出有效的买入或卖出信号时,相应的箭头将打印在图表上,在下一根蜡烛/柱线开盘时,指示强劲的上升趋势/下降趋势。用户可以选择使用哪些指标,并可以单独调整每个指标的参数。 Matrix Arrow Indicator MT5 仅从选定的指标中收集信息,并仅根据其数据打印箭头。   Matrix Arrow Indicator MT5   还可以为所有新信号发送终端、推送通知或电子邮件警报。无论您是黄牛、日内交易者还是波段交易者, Mat
Volume by Price MT5
Brian Collard
3.6 (5)
The Volumebyprice.com Indicator for MetaTrader 5 features Volume Profile and Market Profile TPO (Time Price Opportunity). Volume and TPO histogram bar and line charts. Volume Footprint charts. TPO letter and block marker collapsed and split structure charts. Static, dynamic and flexible range segmentation and compositing methods with relative and absolute visualizations. Session hours filtering and segment concatenation with Market Watch and custom user specifications. Graphical layering, posit
ICT, SMC, SMART MONEY CONCEPTS, SMART MONEY, Smart Money Concept, Support and Resistance, Trend Analysis, Price Action, Market Structure, Order Blocks, BOS/CHoCH,   Breaker Blocks ,  Momentum Shift,   Supply&Demand Zone/Order Blocks , Strong Imbalance,   HH/LL/HL/LH,    Fair Value Gap, FVG,  Premium  &   Discount   Zones, Fibonacci Retracement, OTE, Buy Side Liquidity, Sell Side Liquidity, BSL/SSL Taken, Equal Highs & Lows, MTF Dashboard, Multiple Time Frame, BigBar, HTF OB, HTF Market Structure
Volatility Trend System - a trading system that gives signals for entries. The volatility system gives linear and point signals in the direction of the trend, as well as signals to exit it, without redrawing and delays. The trend indicator monitors the direction of the medium-term trend, shows the direction and its change. The signal indicator is based on changes in volatility and shows market entries. The indicator is equipped with several types of alerts. Can be applied to various trading in
Blahtech Supply Demand MT5
Blahtech Limited
4.54 (13)
Was: $299  Now: $99   Supply Demand uses previous price action to identify potential imbalances between buyers and sellers. The key is to identify the better odds zones, not just the untouched ones. Blahtech Supply Demand indicator delivers functionality previously unavailable on any trading platform. This 4-in-1 indicator not only highlights the higher probability zones using a multi-criteria strength engine, but also combines it with multi-timeframe trend analysis, previously confirmed swings
Gold TMAF MTF - 这是一个最佳股票技术指标。该指标算法分析资产的价格走势,并反映波动性和潜在进入区域。 最佳指标信号: - 卖出 = TMA2 的红色上边界高于 TMA1 的红色上边界 + 上方的红色分形指标 + 同方向的黄色 SR 信号箭头。 - 买入 = TMA2 的蓝色下边界低于 TMA1 的蓝色下边界 + 下方的蓝色分形指标 + 同方向的水蓝色 SR 信号箭头。 该指标的优点 1. 指标产生的信号精确度高。 2. 确认的箭头信号不会重绘,分形信号可以重绘半个周期。 3. 您可以在任何经纪商的 MetaTrader 5 交易平台上进行交易。 4. 您可以交易任何资产(货币、金属、加密货币、股票、指数等)。 5. 最好在 M30-H1 时间框架(中期交易)上进行交易。 6. 在指标设置中可更改个别参数(TF、颜色等),以便每位交易者都能轻松定制适合自己的指标。 7. 该指标既可作为交易系统的主要补充,也可作为独立的交易系统使用。 注意:交易的入市准确性和盈利能力仅取决于交易者的技能。任何指标都只是交易者的助手,而非行动指南。
Automated Trendlines MT5
Georgios Kalomoiropoulos
趋势线是外汇交易中最重要的技术分析工具。不幸的是,大多数交易者没有正确绘制它们。自动趋势线指标是专业交易者的专业工具,可帮助您可视化市场的趋势运动。 有两种类型的趋势线看涨趋势线和看跌趋势线。 在上升趋势中,外汇趋势线是通过价格变动的最低摆动点绘制的。 连接至少两个“最低点”将创建一条趋势线。 在下跌趋势中,趋势线是通过价格走势的最高摆动点绘制的。 连接至少两个“最高点”将创建一条趋势线。 趋势线何时突破? 当看跌蜡烛收于看涨​​趋势线下方并且蜡烛的高点在趋势线上方时,看涨趋势线会被打破。 当看涨蜡烛收于看跌趋势线上方并且蜡烛的低点低于趋势线时,看跌趋势线会被打破。 趋势线何时删除? 当一根完整的蜡烛在看涨趋势线下方形成时,看涨趋势线将被删除。 当完整的蜡烛在看跌趋势线上方形成时,看跌趋势线将被删除。 您可以从输入参数更改看涨和看跌趋势线的颜色和宽度。
TPA True Price Action indicator reveals the true price action of the market makers through 100% non-repainting signals strictly at the close of a candle! TPA shows entries and re-entries, every time the bulls are definitely stronger than the bears and vice versa. Not to confuse with red/green candles. The shift of power gets confirmed at the earliest stage and is ONE exit strategy of several. There are available now two free parts of the TPA User Guide for our customers. The first "The Basics"
The 1 2 3 Pattern Scanner MT5
Reza Aghajanpour
5 (16)
** All Symbols x All Timeframes scan just by pressing scanner button ** ***Contact me after purchase to send you instructions and add you in "123 scanner group" for sharing or seeing experiences with other users. After 17 years of experience in the markets and programming, Winner indicator is ready. I would like to share with you! Introduction The 123 Pattern Scanner indicator with a special enhanced algorithm is a very repetitive common pattern finder with a high success rate . Interestingly,
Auto Order Block with break of structure based on ICT and Smart Money Concepts (SMC) Futures Break of Structure ( BoS )             Order block ( OB )            Higher time frame Order block / Point of Interest ( POI )    shown on current chart           Fair value Gap ( FVG ) / Imbalance   -  MTF      ( Multi Time Frame )    HH/LL/HL/LH  -  MTF      ( Multi Time Frame )  Choch  MTF      ( Multi Time Frame )  Volume Imbalance     ,  MTF          vIMB Gap’s Power of 3 Equal High
Trend Reversal Scanner MT5
Reza Aghajanpour
5 (5)
**   All Symbols   x   All Timeframes   scan just by pressing scanner button ** *** Contact me after the purchase to send you instructions and add you in "Trend Reversal group" for sharing or seeing experiences with other users. Introduction: Trendlines are the most famous technical analysis in trading . Trendlines continually form on the charts of markets across all the different timeframes providing huge opportunities for traders to jump in and profit on the action. In the other hand,  The tre
作者的更多信息
Investment Castle II MT5
Ahmed Alaaeldin Abdulrahman Ahmed Elherzawi
The Investment castle II ea trading robot has a variety of features, including: The ability to remember open positions, their take profit and stop loss levels if the VPS or terminal is restarted. The ability to remember trade buttons and their setup if the VPS or terminal is restarted. The ability to plot profit/loss on a chart, but only when the user runs the visualizer and on live charts. It automatically disables this feature when backtesting or optimizing settings for improved speed and perf
Investment Castle Supply and Demand
Ahmed Alaaeldin Abdulrahman Ahmed Elherzawi
5 (4)
Supply and Demand indicator does not repaint as it counts the number of tests/retests occurred in the past x number of times. As a trader you need a path to be able to place your buy and sell trades such as: Supply and Demand, Falling & raising channels . Experienced trades will draw the key levels and channels around the timeframes. But, they will not be able to draw them on the small time frames as the price changes too frequent. This indicator is based on Shved supply and demand indicator, b
FREE
Chances
Ahmed Alaaeldin Abdulrahman Ahmed Elherzawi
5 (6)
The Investment Castle Chances indicator will show signals on the chart for entering a buy or sell trade. There are 2 types of signals for each direction as follows: Buy / Sell (Orange colored candlesticks) Strong Buy   (Green colored candlesticks)  / Strong Sell  (Red colored candlesticks) You may place a buy trade once you see the Buy arrow or vise versa, or you might prefer to wait for a further confirmation “Strong Buy” / “Strong Sell”. This indicator works best with the high time frames H1,
FREE
Investment Castle Indicator
Ahmed Alaaeldin Abdulrahman Ahmed Elherzawi
4.8 (5)
介紹 旨在解決以下問題的投資城堡指標創建: 1.在不同的時間範圍內確定趨勢的正確方向。 2.在圖表上顯示命中率,獲勝率。 3.該指標不會重新繪製圖表。 4.該指標內置在 Investment Castle EA 中。 *在網站上查看設置的文件,更新和更多信息: https://www.investmentcastle.com 免責聲明 應該清楚地將“ Investment Castle Indicator”和所有帶有其名稱的產品視為交易者可以用來支持其交易的工具。牢記這一點,該工具的效果或有效性完全取決於交易者的投入和/或優化。 強烈建議您,作為交易者,首先要完全熟悉投資城堡指標產品,首先要對模擬或試用帳戶中各種參數的輸入設置進行全面回測,然後再使用投資城堡指標。一個真實賬戶,以便體驗和理解每個參數集如何相互對應,以使投資城堡指標如交易員所設定的那樣起作用。 因此,無論是好是壞,交易者交易經驗的結果,都只是對交易者理解的純粹而直接的反映,並且具有優化和利用投資城堡指標所提供的廣泛功能的能力。
FREE
Investment Castle Trend Lines
Ahmed Alaaeldin Abdulrahman Ahmed Elherzawi
5 (5)
All traders should know the trend before making their decision when placing the buy or sell orders. The first step always starts with  supply and demand ,   rising and falling channels , trend lines, engulfing candles etc. All the above contribute to what is called “Price Action” and that is the best and most reliable way in trading and catching the trend and making profits, without stress. The  Investment Castle Trend Line Indicator  will automatically draw the trend lines on the MT5 for you.
FREE
Singles MT4
Ahmed Alaaeldin Abdulrahman Ahmed Elherzawi
Trailing Step, Trailing Stop and Stop Loss as we used see how Pro traders used to make consistent profit. Traders who prefer the Stop Loss and Trailing Step trading style can use this EA to power their trading strategy and leverage from the movement of the price towards the Take Profit line with the continuous movement of the SL line. What is special about this EA is that it will immediately open the next trade in the opposite direction once the price hits SL. The EA has a built-in News Filter,
Investment Castle RSI Divergence MT5
Ahmed Alaaeldin Abdulrahman Ahmed Elherzawi
The RSI Divergence Indicator is a powerful tool designed to identify potential reversals in the market by spotting discrepancies between the Relative Strength Index (RSI) and price movement. Divergences can be a significant indication of an impending trend change, either from bullish to bearish or vice versa. This indicator is built for making the task of identifying potential trade opportunities more straightforward and efficient. Features: Automatic Detection:   The indicator scans the cha
FREE
Investment Castle RSI Divergence
Ahmed Alaaeldin Abdulrahman Ahmed Elherzawi
RSI 差异指标是一个强大的工具,设计用于通过发现相对强度指数(RSI)和价格运动之间的差异来识别市场中的潜在反转。差异可能是即将发生的趋势变化的重要指示,从看涨转为看跌或反之亦然。此指标的目的是使识别潜在交易机会的任务变得更简单和高效。 特点: 自动检测:指标扫描图表查找RSI差异并自动绘制箭头以指示潜在的交易机会。 买卖信号: 绿色向上箭头:基于看涨的RSI差异建议潜在的购买机会。 红色向下箭头:基于看跌的RSI差异建议潜在的销售机会。 差异强度识别:指标区分弱和强的差异,为交易者提供更细微的见解。 强烈的差异:由粗箭头表示。 微弱的差异:由更淡的箭头表示。 移动通知:内置的移动通知功能确保您即使在移动时也永远不会错过潜在的交易信号。一旦发现差异,指标会向您的移动设备发送推送通知。 自定义设置:用户可以调整RSI期间、超买和超卖水平以及其他设置,以根据其交易风格和偏好调整指标。 工作原理: 看涨差异(购买信号):当价格形成一个新的更低的低点,但RSI形成一个更高的低点时发生。这种差异可能表明潜在的上行反转。 看跌差异(卖出信号):当价格形成一个新的更高的高点,但RSI形成一个较低的
FREE
Gold Indicator
Ahmed Alaaeldin Abdulrahman Ahmed Elherzawi
5 (1)
This indicator uses horizontal lines to identify support and resistance levels based on Zigzag legs and On-Balance Volume (OBV) analysis. Here is a summary of how the indicator works: Resistance and Support Lines : A horizontal line above the current price level indicates resistance. A horizontal line below the current price level indicates support. Drawing Horizontal Lines : Draw horizontal lines on every Zigzag leg within the last X legs, where X is a specified number (e.g., 10). Only the most
FREE
Channels Indicator MT5
Ahmed Alaaeldin Abdulrahman Ahmed Elherzawi
4.8 (5)
Channels indicator does not repaint as its based on projecting the falling and raising channels. As a trader you need a path to be able to place your buy and sell trades such as: Supply and Demand , Falling & raising channels. Falling and raising channels can be in any time frame and also can be in all time frames at the same time and the price always flows within these channels. Experienced trades will draw the key levels and channels around the time frames. But, they will not be able to draw
FREE
Investment Castle EA MT4
Ahmed Alaaeldin Abdulrahman Ahmed Elherzawi
4.5 (2)
Introducing the Investment Castle Expert Advisor - the ultimate trend-based trading tool that comes with built-in Investment Castle and Psychological Key Levels indicators. Whether you're a novice or a seasoned trader, this powerful tool will help you make informed decisions and maximize profits. Features: Automated Support and Resistance Key Levels: Say goodbye to manual chart analysis! Our AI-driven software automatically identifies key levels of support and resistance, allowing you to make s
Investment Castle Support and Resistance
Ahmed Alaaeldin Abdulrahman Ahmed Elherzawi
5 (5)
Investment Castle Support and Resistance Indicator has the following features: 1.  Dictates the direction of Buy or Sell trades based on Support and Resistance Levels automatically . 2.  Candles stick colors will change to Red for Sell and Blue for Buy (Default settings, user can change from the inputs). 3. This indicator is built-in the Support & Resistance based Investment Castle EA which works with Psychological Key Levels "Support & Resistance".
FREE
Investment Castle Engulfing
Ahmed Alaaeldin Abdulrahman Ahmed Elherzawi
4.5 (2)
Whether you are a scalper or daily trader, you will always look for bullish / bearish engulfing candles. This can be a bit tricky and stressful when you try to visually identify the engulfing candles on the chart. Not only that, you might be trading on the M15 time frame but the engulfing candle is forming or has already formed in the H4 time frame. This indicator is made to do that on your behalf. You can trade on any time frame and see Engulfing candles of another time frame, this means that
FREE
Investment Castle Trend Lines MT4
Ahmed Alaaeldin Abdulrahman Ahmed Elherzawi
5 (3)
All traders should know the trend before making their decision when placing the buy or sell orders. The first step always starts with  supply and demand , rising and falling channels , trend lines, engulfing candles etc. All the above contribute to what is called “Price Action” and that is the best and most reliable way in trading and catching the trend and making profits, without stress. The  Investment Castle Trend Line Indicator  will automatically draw the trend lines on the MT4 for you. An
FREE
Investment Castle Indicator MT4
Ahmed Alaaeldin Abdulrahman Ahmed Elherzawi
4.89 (9)
Investment Castle Indicator has the following features: 1.  Dictates the direction of the trend in different Timeframes . 2.   Shows the hit rate and winning rate on the chart. 3. This indicator does not repaint the chart. 4. This indicator is built-in the Support & Resistance based Investment Castle EA which works with   Psychological Key Levels "Support & Resistance" Indicator.
FREE
Chances MT4
Ahmed Alaaeldin Abdulrahman Ahmed Elherzawi
5 (2)
The Investment Castle Chances indicator will show signals on the chart for entering a buy or sell trade. There are 2 types of signals for each direction as follows: Buy / Sell (Orange colored candlesticks) Strong Buy (Green colored candlesticks)  / Strong Sell  (Red colored candlesticks) You may place a buy trade once you see the Buy arrow or vise versa, or you might prefer to wait for a further confirmation “Strong Buy” / “Strong Sell”. This indicator works best with the high time frames H1, H
FREE
Spots
Ahmed Alaaeldin Abdulrahman Ahmed Elherzawi
The Spots Indicator can be used for Entering and Exiting your trades based on the common candlestick patterns such as: engulfing, hanging man, doji etc. It is designed to publish desktop and mobile notification every time a signal is triggered. However, it is worth noting that this indicator is recommended to be used with other indicator for confirming the entries. It is best to use it with the Investment Castle Trend Lines indicator  and the Supply and Demand indicator .
FREE
Investment Castle II MT4
Ahmed Alaaeldin Abdulrahman Ahmed Elherzawi
5 (1)
The Investment castle II ea trading robot has a variety of features, including: The ability to remember open positions, their take profit and stop loss levels if the VPS or terminal is restarted. The ability to remember trade buttons and their setup if the VPS or terminal is restarted. The ability to plot profit/loss on a chart, but only when the user runs the visualizer and on live charts. It automatically disables this feature when backtesting or optimizing settings for improved speed and perf
Investment Castle Supply and Demand MT4
Ahmed Alaaeldin Abdulrahman Ahmed Elherzawi
Supply and Demand indicator does not repaint as it counts the number of tests/retests occurred in the past x number of times. As a trader you need a path to be able to place your buy and sell trades such as: Supply and Demand, Falling & raising channels . Experienced trades will draw the key levels and channels around the timeframes. But, they will not be able to draw them on the small time frames as the price changes too frequent. This indicator is based on Shved supply and demand indicator, b
FREE
Spots MT4
Ahmed Alaaeldin Abdulrahman Ahmed Elherzawi
The Spots Indicator can be used for Entering and Exiting your trades based on the common candlestick patterns such as: engulfing, hanging man, doji etc. It is designed to publish desktop and mobile notification every time a signal is triggered. However, it is worth noting that this indicator is recommended to be used with other indicator for confirming the entries. It is best to use it with the   Investment Castle Trend Lines indicator  and the   Supply and Demand indicator
FREE
Investment Castle Volatility Index
Ahmed Alaaeldin Abdulrahman Ahmed Elherzawi
5 (2)
Investment Castle Volatility Index has the following features: 1. This indicator shows the volumes of the current symbol and the market volatility. 2. This indicator is built-in in the Investment Castle EA which works as volatility index for the EA dynamic distance and opposite start. 3. Parameters available for optimization for each pairs. 4. Works with any chart.
FREE
Investment Castle Support and Resistance MT4
Ahmed Alaaeldin Abdulrahman Ahmed Elherzawi
4.71 (7)
Investment Castle Support and Resistance Indicator has the following features: 1.  Dictates the direction of Buy or Sell trades based on Support and Resistance Levels automatically . 2.  Candles stick colors will change to Red for Sell and Blue for Buy (Default settings, user can change from the inputs). 3. This indicator is built-in the Support & Resistance based Investment Castle EA which works with Psychological Key Levels "Support & Resistance".
FREE
Channels Indicator
Ahmed Alaaeldin Abdulrahman Ahmed Elherzawi
4 (1)
Channels indicator does not repaint as its based on projecting the falling and raising channels. As a trader you need a path to be able to place your buy and sell trades such as: Supply  and Demand , Falling & raising channels. Falling and raising channels can be in any time frame and also can be in all time frames at the same time and the price always flows within these channels. Experienced trades will draw the key levels and channels around the timeframes. But, they will not be able to draw
FREE
Investment Castle News
Ahmed Alaaeldin Abdulrahman Ahmed Elherzawi
Investment Castle News Indicator will plot vertical lines before the news on the chart and categorized in three different colors in accordance with the news importance. You can choose to limit the news to the current chosen symbol or show all future news on the same chart. High impact news is marked in Red lines be default. Medium impact news is marked in Orange lines be default. Low impact news is marked in Yellow lines be default.
FREE
The Panel MT4
Ahmed Alaaeldin Abdulrahman Ahmed Elherzawi
The Panel will read the floating profit/loss for the symbol of your chart and will plot the profit/loss numbers on the chart. It will work with manual trades or trades made by any expert advisor. The Panel shows the Max Drawdown in the base currency, floating profit/loss for both buy and sell orders. It will also show the same in Pips. The Panel is movable on the chart, so you can drag it using the mouse cursor.
FREE
Spots EA
Ahmed Alaaeldin Abdulrahman Ahmed Elherzawi
4 (1)
The Spots Expert Advisor is the automated trading bot was created using the Spots indicator based on the common candlestick patterns such as: engulfing, hanging man, doji etc. The main objective for creating this EA is to have a fully automated and low drawdown bot. I'm sharing the first set file on the website, please feel free to optimize it for other pairs and with your forex broker using the preset parameters.
Ultimate
Ahmed Alaaeldin Abdulrahman Ahmed Elherzawi
4 (1)
Dashboard, TP line and Profit/Loss labels are set to false by default for speeding up the optimization. Switch them to True before you start. There are many strategies inside this EA as follows: - Entry based on indicator signal "as shown on the trend indicator " - Opposite to trade entry with opposite martingale - Entries based on " support and resistance indicator ". - Normal martingale - Normal martingale with distance multiplier - Normal martingale with volatility index - Opposite martingal
Investment Castle Volatility Index MT4
Ahmed Alaaeldin Abdulrahman Ahmed Elherzawi
3.67 (3)
Investment Castle Volatility Index has the following features: 1. This indicator shows the volumes of the current symbol and the market volatility. 2. This indicator is built-in in the Investment Castle EA which works as volatility index for the EA dynamic distance and opposite start. 3. Parameters available for optimization for each pairs. 4. Works with any chart.
FREE
Investment Castle Engulfing MT4
Ahmed Alaaeldin Abdulrahman Ahmed Elherzawi
Whether you are a scalper or daily trader, you will always look for bullish / bearish engulfing candles. This can be a bit tricky and stressful when you try to visually identify the engulfing candles on the chart. Not only that, you might be trading on the M15 time frame but the engulfing candle is forming or has already formed in the H4 time frame. This indicator is made to do that on your behalf. You can trade on any time frame and see Engulfing candles of another time frame, this means that y
FREE
The Panel
Ahmed Alaaeldin Abdulrahman Ahmed Elherzawi
The Panel will read the floating profit/loss for the symbol of your chart and will plot the profit/loss numbers on the chart. It will work with manual trades or trades made by any expert advisor. The Panel shows the Max Drawdown in the base currency, floating profit/loss for both buy and sell orders. It will also show the same in Pips. The Panel is movable on the chart, so you can drag it using the mouse cursor.
FREE
筛选:
无评论
回复评论
版本 1.1 2022.11.08
- Added RSI oscillator for filtering the entries
- Now you will be able to see the previous signals