KT Price Border MT5
- 指标
- KEENBASE SOFTWARE SOLUTIONS
- 版本: 1.0
- 激活: 5
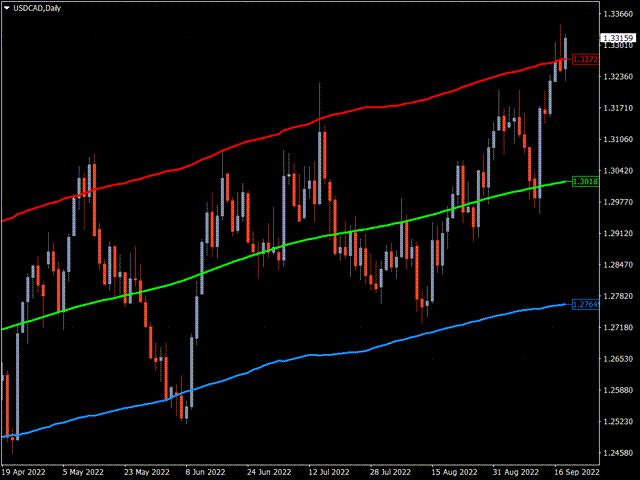
KT Price Border 创建了一个由三条带组成的价格通道,用于识别市场中的潜在高点和低点。这些水平还可以用作动态市场支撑和阻力。
中间带还可以用于识别趋势方向,因此它也可以作为趋势跟踪指标。此外,其简单易用的特点以及清晰的交易信号,使新手交易者受益匪浅。
功能特点
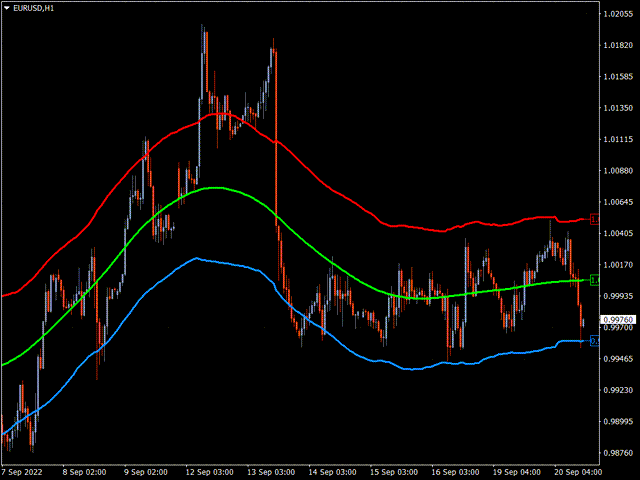
- 适用于大多数外汇货币对。
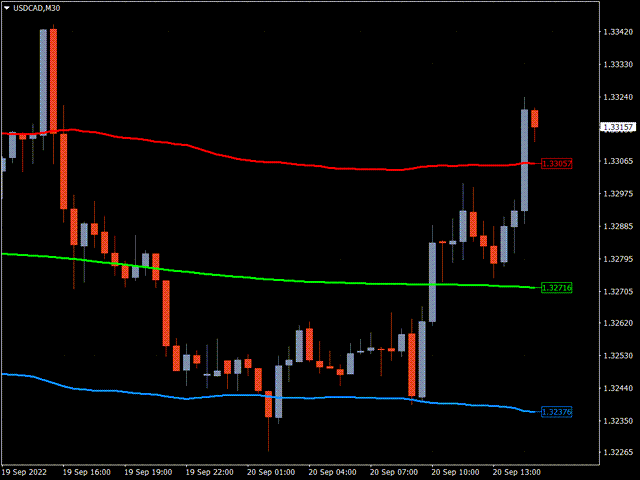
- 可用于低时间框架和高时间框架。
- 适用于剥头皮交易、日内交易和波段交易。
- 支持趋势交易和逆势交易策略。
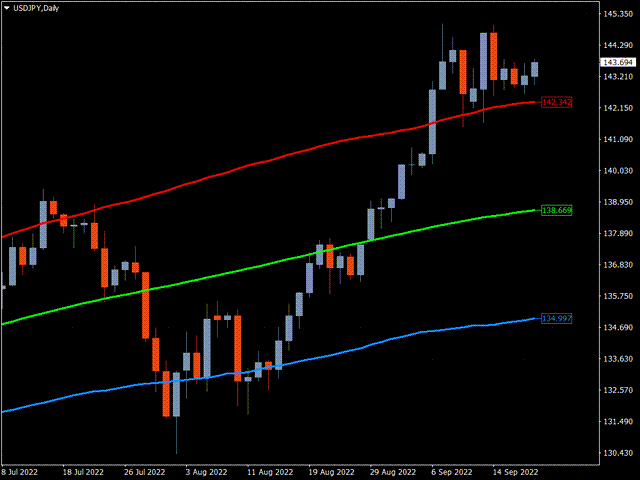
- 当价格突破价格带时,可发送提醒通知。
- 价格带还可作为动态支撑和阻力水平。
理解价格边界的概念
该指标的工作原理类似于布林带。下轨表示市场超卖区域,同时充当动态支撑。
上轨表示市场超买区域,同时充当动态阻力。中间带用于确定趋势方向。
如果价格收于中间带上方,则表明市场仍处于上升趋势;相反,如果价格收于其下方,则表明市场仍处于下降趋势。
专业建议
使用 KT Price Border 进行交易时,可以自由选择自己偏好的入场、止损和止盈方法。
与任何指标一样,应遵循更广泛的市场趋势,并在模拟账户上进行练习,直到完全掌握。请记住,即使是最好的交易指标,在长期交易中也无法保证 100% 的胜率。