Индикатор рисует уровни Фибоначчи с выделенными Ценовыми метками.При установке индикатора на график необходимо создать трендовую линию с именем указанным в поле" Unique name of trend line to place fib on ". По умолчанию имя=" Unique name of trend line to place fib on" = "+" .В индикаторе можно заменить уровни фибоначчи по своему усмотрению.Также меняются цвет,стиль,толщина линий и т. д.
Pivot Point Multi Method is a fully automatic pivot point indicator and indicate support and resistances (S1,S2,S3,S4,R1,R2,R3,R4) based on four Methods that you can select on of them Pivot point detection and drawing support resistances Methods( Classic ,Camarilla ,Woodie ,Fibonacci)
Pivot Point Multi Method is working on all time frames and all currency pairs and gold silver and crypto currencies .
Recommended Setting : Pivot_Method select one of the methods ( Classic ,Camarilla ,Woodi
Fibonacci strategies EA trades Fibonacci levels. You can choose whether the EA should trade a manually plotted fibonacci or whether it should automatically plot a fibonacci. In automatic fibonacci drawing mode, the EA automatically plots a fibonacci retracement based on the number of bars you select on the BarsToScan setting in the indicator. The fibonacci is automatically updated in real time as new highest and lowest values appears amongst the selected bars. You can select which level values
Fibonacci retracements are trend lines drawn between two significant points, usually between absolute lows and absolute highs, plotted on a chart. Intersecting horizontal lines are placed at the Fibonacci levels. Fibonacci retracements are useful tools that help traders identify support and resistance levels. With the information gathered, they can place orders, identify stop-loss levels, and set price targets. Although useful, traders often use other indicators to make more accurate assessments
The Transition Trend indicator shows the points of potential market reversal. The indicator's smart algorithm detects the trend, filters out market noise and generates entry signals and exit levels. Simple, visual and efficient trend detection. Uses just one parameter for settings. The indicator does not redraw and does not lag.
You can set up message alerts as sound or email. Works on all currency pairs and all timeframes. Ready-made trading system.
VaviStar is an indicator based on trend retracements determined by ZigZag segments. It is theorized, and statistics confirm, that stocks react to certain retracement levels. Many use Fibonacci retracement levels (23.6%, 38.2%, 61.8%). It is assumed that once the price goes beyond the 61.8% retracement, we can already speak of a trend reversal. This indicator allows you to comfortably chart a segment of the ZigZag with the relative operating levels chosen. With a reversal mindset , you can use it
Fibonacci Retracements Pro The Fibonacci Retracements Pro is a powerful yet easy to use indicator. It automatically plots all the important Fibonacci retracement and extension levels for you. FRP is dynamic powerful and seamlessly adjusts to whatever timeframe you are analyzing. Fibonacci Retracement Pro is optimized for ALL timeframes and ALL Currency pairs, Indices, Commodities, and Cryptocurrency pairs. Trade with improved confidence and maximize your success rate. Benefits Dynamic and Power
NO REPAINT ADVANCED CHART PATTERN INDICATOR
By definition, a price ( chart) pattern is a recognizable configuration of price movement that is identified using a series of trendlines and/or curves. When a price pattern signals a change in trend direction, it is known as a reversal pattern; a continuation pattern occurs when the trend continues in its existing direction following a brief pause. Advanced Chart Pattern Tracker is designed to find the MOST ACCURATE patterns. A special script is
Fibonacci calculator is used with Elliot Waves, it can generate remarkable results. A trader could use these levels or ratios to find high probability trades with very small stop loss. You may also use these ratios to find Elliott Waves extensions and to book profit near those levels. For Elliot Wave experts, Fibonacci calculator is a highly useful tool that can assist them in calculating Fibonacci extension and retracement levels for the market price. The indicator proves itself as a useful one
OBTE = Order Block Type I OBTI Indicator MT4 is the most accurate and customizable indicator on the market. It was developed to facilitate the analysis of operations based on candlestick patterns and supply-demand zones. These zones are possible movement reversal points. For this indicator is generated by the order block of smart money concept.
Input parameters: 1. Multiple timeframes : M1 M5 M15 M30 H1 H4 D1 W1 MN1 2. Default input: H1 H4 D1 W1 MN1 3. Notifications / Send Emails / Notificatio
Moving pivot Average Fibonacci
The indicator compares the selected period with its counterpart from the previous period. The indicator determines the moving Fibonacci levels for the day or any time interval to assess the price movement range from the time average. The indicator helps predict the expected high or low for the day based on historical time data. The pivot line can be considered an average trend line and use it in a variety of trading strategies.
If you have any question about t
Signal Eskiya, in addition to channel lines, reflects entry signals in the form of arrows. Trading strategies using the channel indicator belong to the classic methods of technical analysis, are easy to execute, and therefore available even to beginners. Price ranges work equally well on any trading assets and timeframes, they can be used both independently and with additional confirmation from oscillators and market volumes.
American traders say: “Trend is your friend”, which means “Trend is
Volatility under control. The indicator shows the optimal depth for setting goals within the day and on the average trend. It also builds pivot zones for the estimated correction depth. As an accompaniment, the key levels of the structure are displayed for several timeframes. Classical volatility indicators ATR & ADX on fixed timeframes are used for calculation. The calculation takes into account the spread, and if the market is slightly volatile, you will see a warning about the risk. You can c
The indicator is designed for determining Fibonacci levels. Does not repaint/redraw The blue level shows the zero Fibonacci value (it is also the Pivot level) Red levels show calculated Fibonacci levels (used as a rollback or reversal point) Automatic period detection (periods can be entered manually) Adjustable display calculation method. Settings BarsHistory - the number of bars to be used to display the indicator. Method - method of calculation. AutoPeriod - automated period calculation (true
This indicator is designed for trend trading and it helps in determining the best entry points. To identify the points, it is necessary to follow the signal line. Once the line crosses the zero level upwards - buy, and when it crosses downwards - sell. In addition to the signal line, the indicator also displays the so-called market "mood" in real time in the form of a histogram. The indicator works on all timeframes and with all instruments. The indicator operation required the Moving Average in
The expert works on the Fibonacci levels on the previous candle With some digital way to enter the deal On the five minute frame Work on currency pairs only Do not use TakeProfit or Stop Loss How the expert works It is placed on the three currency pairs GBPUSD GBPJPY GBP AUD Same settings without changing anything When he works, he will work on only one currency of them until it closes on a profit Profit is only seven points Please watch the video Explains how the expert works. Max Spread = 0.3
This free MT4 indicator allows you to automatically display psychological price levels on your chart It's very powerful when you combine it with other tools such as Fibs levels, Supports & Resistance levels, Moving Averages, Wyckoff schematics, etc. For example, you can use this indi to display horizontal levels every 100 points on your GER40 chart, or 500 points on your BTC chart, etc. ***Please comment, rate and share it to your friends if you like it***
Tract - Channel indicator, by which you can place orders like a classic channel indicator. Trading can be carried out inside the channel when the price reaches its borders and turns in the opposite direction from them. In such cases, reversal strategies are used. The channel indicator is designed to work with support and resistance levels and help traders find opportunities to enter the market. Another way to trade a breakout - assumes a situation when the price, upon reaching one or another cha
Visualization of the trade deals, distributed by price levels. You can set any period for calculation: between 2 vertical lines, or set a fixed time interval. The histogram levels are relative: a wider bar means more trading volume. Distribution extremes can be used as a support and resistance levels.
All styles, sizes and colors are customizable. My #1 Utility : includes 65+ functions | Contact me if you have any questions | MT5 version In the settings of the indicator, you can config
The Doonchian channel consists of two channel displays. Channel lines are determined by a simple and reliable algorithm. The channel is preferably used for trading inside the channel. The indicator does not redraw and does not lag; simple algorithms are the basis of the work. It works on all currency pairs and on all timeframes. As always a warning, we must not forget that the approach must be comprehensive, the indicator signals require additional information to enter the market.
Projection Trend - a Forex arrow indicator without redrawing does not change its signals when the market situation changes, does not adjust to the chart. The signals given by him are unambiguous. Traders build a trading system that provides good signals 80-90% of the time.
The indicator showing the points of entry and exit from the market with arrows is able to bring results not only in the Forex market, but also when working with binary options. You can buy it and install it in MetaTrader yo
Channels + S & R Indicator (CSRI)
Indicator draws 3 channels (Large, Medium, Small) within bars’ range of current timeframe and pair / instrument. It can identify Support and Resistance levels within any chosen channel. Additionally Fibonacci levels can be drawn for Large Channel. All lines and levels can be customized by color and width.
Identify Support and Resistance Levels for any Channel:
IdentifySupportAndResistanceLevels - Identify Support and Resistance Levels IdentifySRforChannel –
Innovative Max Min swing This is a really different indicator for drawing Max and Min on the charts. This indicator draws Min and Max levels in a innovative way, based on a volatility proprietary calculation. In this way you will be able to draw trendlines in an objective way and also to see the break of Max and Min levels. You have three paramaters you can play with, in order to suite the volatility to your trading style. The indicator works on every time frame. Added: - Sound Notification
Auto Pitchfork Indicator The indicator calculate the Pitch fork for the previous Day (Selectable) with multiple Support and Resistance lines from the Median price which acts as Magnet for the Price that if price touch the above warning (1) or below warning (1) lines and not cross up or down then there is maximum possibilities that it will return to the Median Line, and thus maintain the Price Action in Cyclic Pattern to the Market Move. You are able to select how many warning lines you want to k
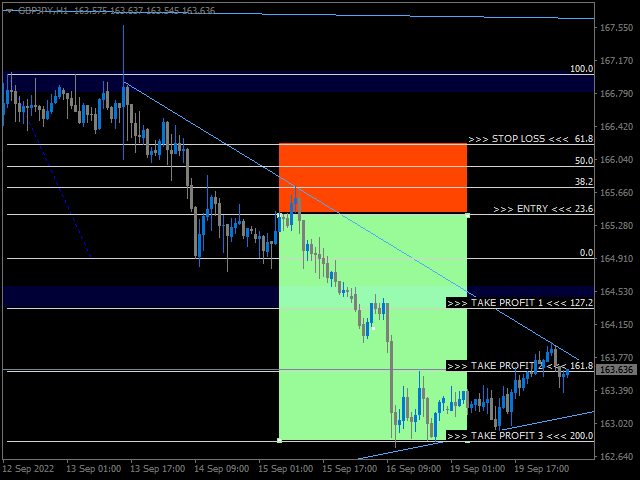
Fibonacci Sniper MT4 - No Repaint
Features:
- Indicator sends signals and notifications on key Fibonacci Retracement and Fibonacci Extensions Levels
- Once the buy/sell signal is set, targets ( TP1 TP2 TP3 )and stop loss levels are drawn by the indicator.
- Fibonacci Calculations and Custom Patterns are identified by the last 3 or 5 Zig Zag exterum.
- You can easily identify key harmonic patterns like Gartley, Bat, Butterfly and Crab patterns.
Important Settings: - Choose the Zig
After the purchase, the current year free indicator, please contact me for your version
As a bonus to the purchase, 3 months access to https://www.mql5.com/en/market/product/78772?source=Unknown%3Ahttps%3A%2F%2Fwww.mql5.com%2Fen%2Fmarket%2Fmy
Fibonacci retracement This indicator is based on use of Fibonacci retracement. I use Fibonacci levels for last year for important levels, where market stops and turns. These levels are important Price Action levels and market respect them. I do not us
O TakeFast AI é um algoritmo sofisticado e inovador que emprega Inteligência Artificial em conjunto com a análise técnica tradicional para antecipar os comportamentos do mercado financeiro. Este Expert Advisor utiliza Redes Neurais Recorrentes, mais especificamente, células de Memória de Longo Prazo e Curto Prazo (LSTM), que são treinadas com base em dados provenientes de indicadores de análise técnica. Através deste método, o EA consegue aprender quais indicadores são os mais influentes para pr
An exclusive indicator that utilizes an innovative algorithm to swiftly and accurately determine the market trend. The indicator automatically calculates opening, closing, and profit levels, providing detailed trading statistics. With these features, you can choose the most appropriate trading instrument for the current market conditions. Additionally, you can easily integrate your own arrow indicators into Scalper Inside Pro to quickly evaluate their statistics and profitability. Scalper Inside
Please contact me after purchase to immediately get your PDF strategy + documentation for Trend Pulse !
Official release price of $99 ( 15 / 50 copies left). Next price is $199 .
Introducing Trend Pulse , a unique and robust indicator capable of detecting bullish, bearish, and even ranging trends! Trend Pulse uses a special algorithm to filter out market noise with real precision. If the current symbol is moving sideways, Trend Pulse will send you a ranging signal, letting you know that
This indicator is unstoppable when combined with our other indicator called Support & Resistance . After purchase, send us a message and you will get it for FREE as a BONUS! Introducing Trend Punch , the revolutionary forex trend indicator that will transform the way you trade! Trend Punch is uniquely designed to provide precise buy and sell arrows during strong market trends, making your trading decisions clearer and more confident. Whether you're trading major currency pairs or exotic sym
通过 mql5 和 Telegram 上 的晨间简报获取每日市场更新,包括详细信息和屏幕截图 ! FX Power MT4 NG 是我们长期以来非常受欢迎的货币强度计算器 FX Power 的下一代产品。 这款下一代强度计算器能提供什么?您所喜爱的原版 FX Power 的所有功能 附加功能 黄金/XAU 强度分析 更精确的计算结果 可单独配置的分析周期 可自定义计算限制,以获得更好的性能 为希望查看更多信息的用户提供特殊的多实例设置 无尽的图形设置,可在每个图表中设置您最喜欢的颜色 无数的通知选项,让您再也不会错过任何重要信息 采用 Windows 11 和 macOS 风格的全新圆角设计 神奇的移动指标面板
FX Power 主要功能 所有主要货币的完整强势历史 所有时间框架内的货币强弱历史 所有经纪商和图表的计算结果完全相同 100% 可靠的实时计算 -> 无重绘 可通过下拉列表选择分析时段
通过自定义模式单独配置分析时段 可在一个图表中使用多个实例 可移动 FX Power 显示屏(通过拖放) 适用于高分辨率 QHD、UHD 和 4K 显示器 自动终端配置 针对平板电脑
请在购买产品之前阅读下面的信息! Apollo Pips PLUS SP 是一款独特的产品!它适合那些想要获得我的新“APOLLO PIPS”指标以及“超级包”奖金以及访问我所有交易指标的人! 通过购买 Apollo Pips PLUS SP 产品,您实际上购买的是全新版本的 Apollo Pips 指标。此版本的指标具有改进的算法和易于使用的参数,使您有机会在任何市场和任何交易风格中使用该指标。 该产品的购买者还可以免费访问我的所有其他指标,作为我的超级奖励!如果您想获得我所有的交易工具,那么该产品非常适合您!:) 但这还不是全部!:) 该产品的所有购买者也有资格免费获得我的新指标!:) 如果我有一个新的交易指标可用,您将能够在我的特权“SUPER PACK”终身奖金计划中完全免费获得它! 购买后请联系我以获得我的交易提示和超级礼包奖金!
Reversal First Impulse levels (RFI) INSTRUCTIONS RUS - ENG R ecommended to use with an indicator - TPSpro TREND PRO - Version MT5 A key element in trading is zones or levels from which decisions to buy or sell a trading instrument are made. Despite attempts by major players to conceal their presence in the market, they inevitably leave traces. Our task was to learn how to identify these traces and interpret them correctly. Main functions: Displaying activ
TPSpro TRENDPRO - is a trend indicator that automatically analyzes the market and provides information about the trend and each of its changes, as well as giving signals for entering trades without redrawing! The indicator uses each candle, analyzing them separately. referring to different impulses - up or down impulse. Exact entry points into transactions for currencies, crypto, metals, stocks, indices! Version MT5 DETAILED DESCRIPTION R ecommended to use with an indi
This Indicator only places quality trades when the market is really in your favor with a clear break and retest. Patience is key with this price action strategy!
If you want more alert signals per day, you increase the number next to the parameter called: Support & Resistance Sensitivity. After many months of hard work and dedication, we are extremely proud to present you our Break and Retest price action indicator created from scratch. One of the most complex indicators that we made with ove
How to use Pair Trading Station Pair Trading Station is recommended for H1 time frame and you can use it for any currency pairs. To generate buy and sell signal, follow few steps below to apply Pair Trading Station to your MetaTrader terminal. When you load Pair Trading Station on your chart, Pair Trading station will assess available historical data in your MetaTrader platforms for each currency pair. On your chart, the amount of historical data available will be displayed for each currency pai
Step into the realm of Forex trading with confidence and precision using XQ, a cutting-edge Forex indicator designed to elevate your trading game to unprecedented heights. Whether you're a seasoned trader or just stepping into the world of currency exchange, XQ Forex Indicator empowers you with the insights and signals needed to make informed trading decisions. The signal conditions are a combination of three indicators, and XQ Forex Indicator only display medium and long-term trends . The
Introduction to X3 Chart Pattern Scanner X3 Cherart Pattern Scanner is the non-repainting and non-lagging indicator detecting X3 chart patterns including Harmonic pattern, Elliott Wave pattern, X3 patterns, and Japanese Candlestick patterns. Historical patterns match with signal patterns. Hence, you can readily develop the solid trading strategy in your chart. More importantly, this superb pattern scanner can detect the optimal pattern of its kind. In addition, you can switch on and off individu
NEW YEAR SALE PRICE FOR LIMITED TIME!!! Please contact us after your purchase and we will send you the complimentary indicators to complete the system Cycle Sniper is not a holy grail but when you use it in a system which is explained in the videos, you will feel the difference. If you are not willing to focus on the charts designed with Cycle Sniper and other free tools we provide, we recommend not buying this indicator. We recommend watching the videos about the indiactor and system before pu
This is a complete HiLo activator indicator. A trend guide indicator capable of signaling when the trend is changing, thus ensuring greater assertiveness in the entries. For the periods M30, M15 and M5 we recommend the setup: HiLo Periods 27, MA Method Exponential. For H1 or above, we recomend the setup: Hilo Periods 13, MA Method Smoothed. -- Periods Control -- MA Smoothing Type Control -- MA Line Width Control