ArchIntel Dashboard
- 指标
- Raphael Adetunji Olaiyapo
- 版本: 1.20
- 更新: 6 二月 2023
- 激活: 10
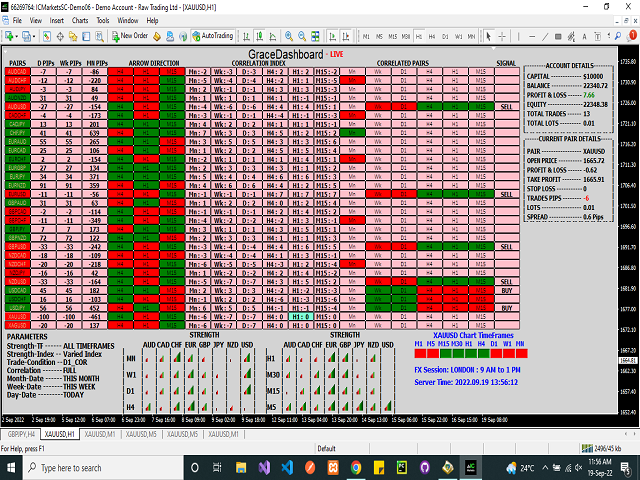
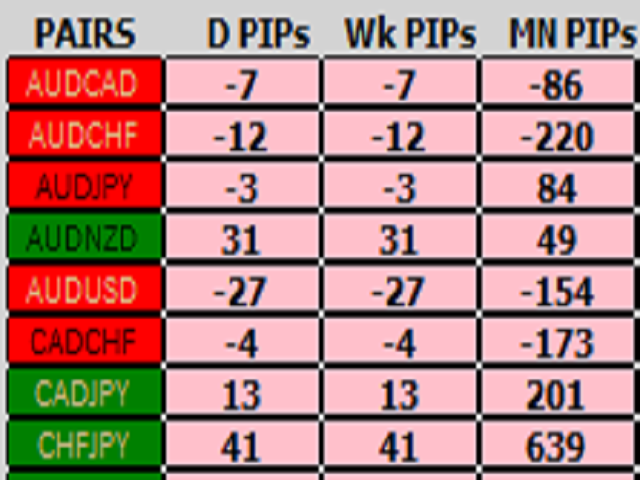
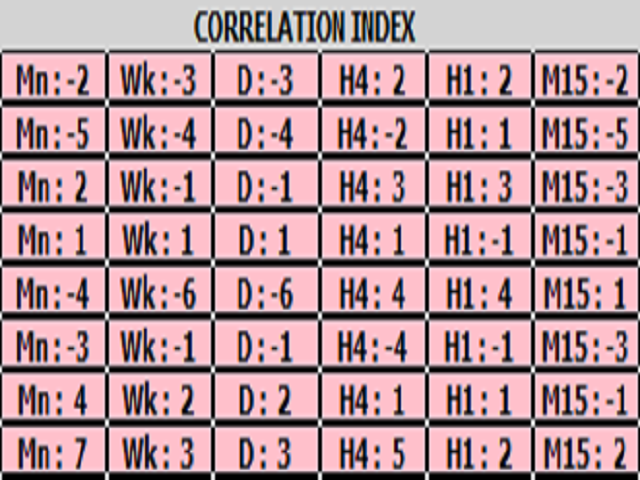
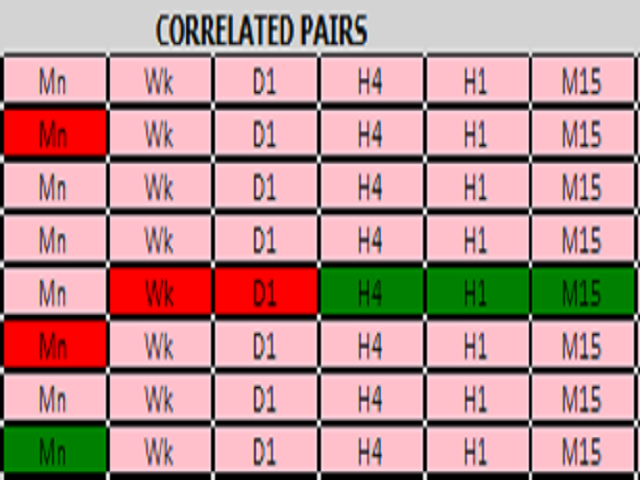
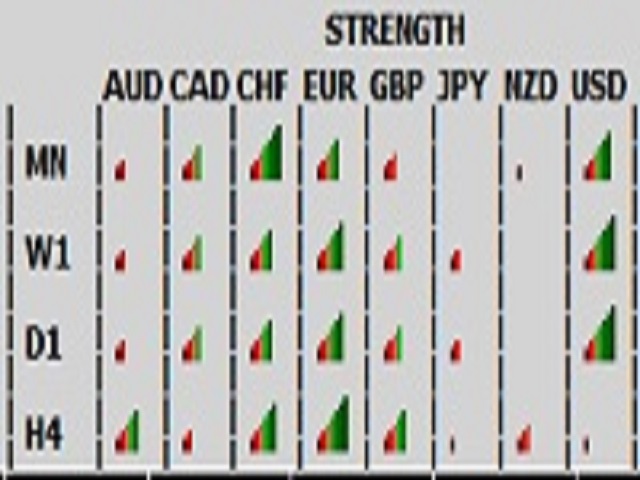
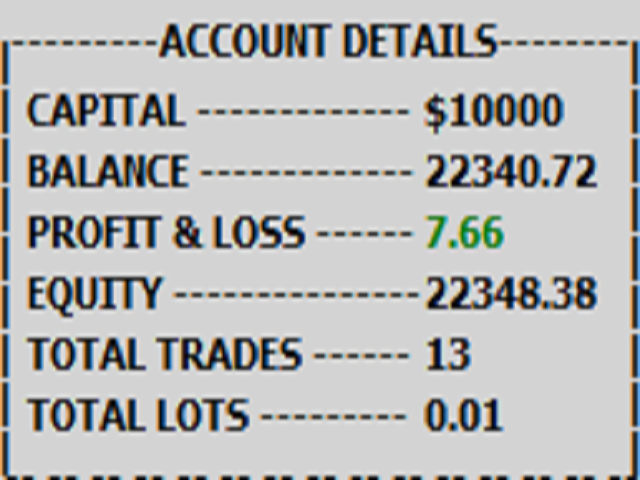
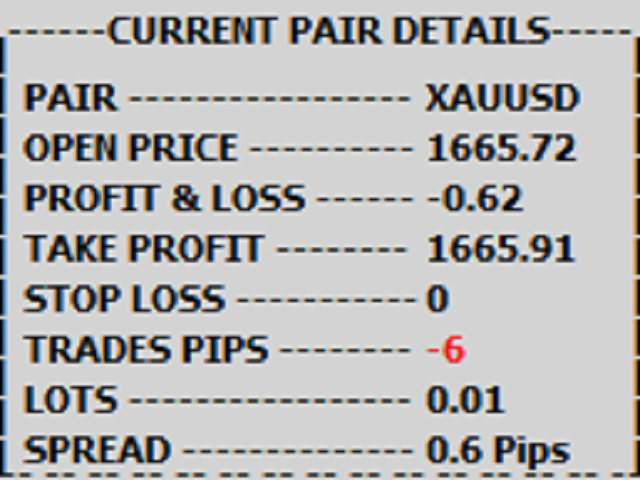
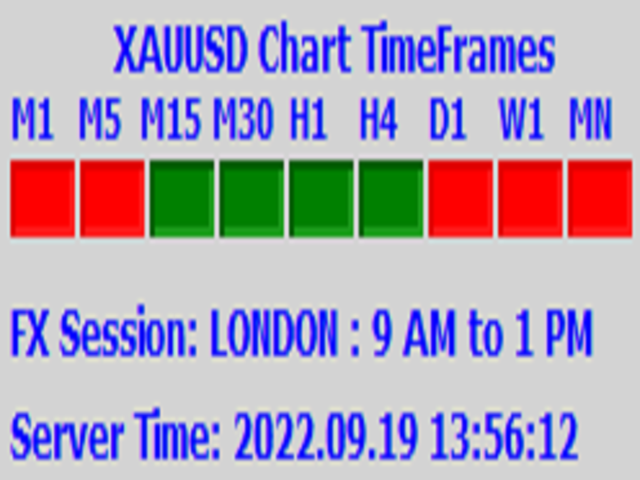
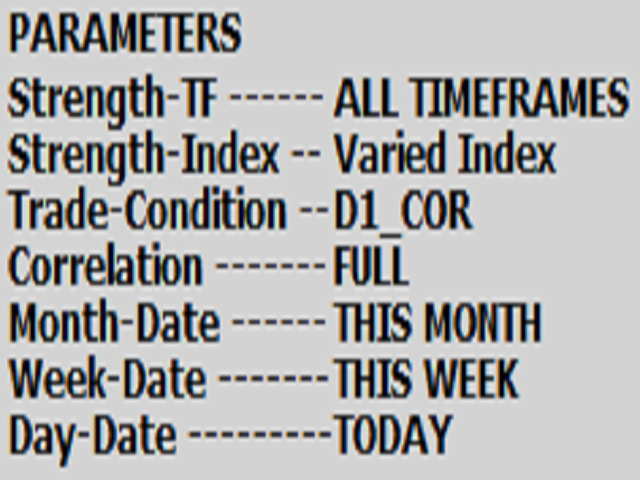
ArchIntel Strength meter is different from the conventional strength meter. It displays correlation index for currency pair and individual currencies, see image 4 and image 6 for the currency pair correlation index and currency strength index. This strength meter displays correlated pair. EURJPY is used to explain the formula, EURUSD and USDJPY must be going up before I can buy (Long ) EURJPY , vice-versa is for sell. When any of the currency pair is correlated using this formular the the rectangle for the specific pair will be coloured red or green. This strength meter displays the latest number of pips for the currency pair, see image 2. RSI indicator is used to confirm market direction and displayed in Arrow direction column, see image 3. Image 7 & 8 are self explanatory. This strength meter displays all timeframes for the current chart currency pair i.e. from 1 minutes to 1 month, if any of the timeframe for the currency pair is up the color is green, if the currency pair is down the color is red, see image 9. Image 11 is the display of the user's choice of parameter that has been selected from the indicator's setting.
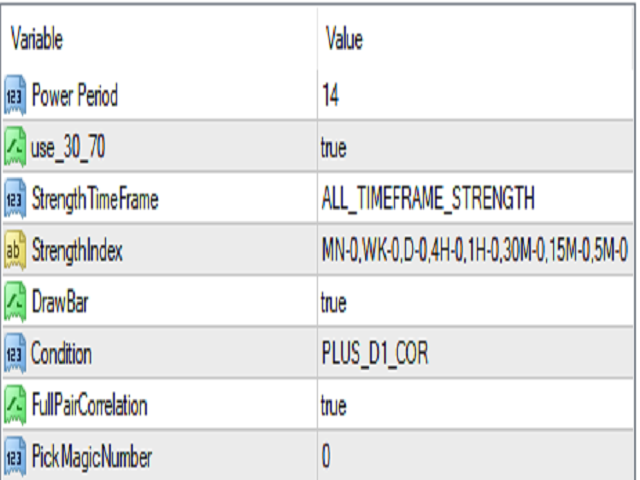
Parameters
- int InpPeriod = 14;
- input bool use_30_70 = true;
- input MY_EnumTimeFrame StrengthTimeFrame = ALL_TIMEFRAME_STRENGTH;
- input string StrengthIndex = "MN-0,WK-0,D-0,4H-0,1H-0,30M-0,15M-0,5M-0";
- input bool DrawBar = true;
- input SELECT_CONDITION Condition = PLUS_D1_COR;
- sinput bool FullPairCorrelation = true;
- sinput int PickMagicNumber = 0;
Parameter explanations
parameter 2: " use_30_70 = true; " if set to true, the RSI will use line 30, 45, 55, and 70, if set to false, RSI will use 45 and 55, if RSI crosses any of these lines up the Arrow direction box will be coloured green and vice-versa.
parameter 3 is when the user want to display strength index for just a specific timeframe or for all timeframes.
parameter 4: The most important thing to note here is the number after the "-" sign. 0 means current candle of the timeframe before the number. for example, MN-0 stands for the monthly candle, the 0 means current candle, the user can put 1 to look at last candle of the timeframes.
parameter 5 is used to determine if bar should be drawn, if set to false, numbers are displayed.
parameter 6 is used to select the conditions to be used for the signal column.
parameter 7: FullPairCorrelation = true; see above for the explanation of correlated pair formula, this parameter is used to detect when currency pair is not correlated.
parameter 8: 0 is the magic number of manually opened trade, number greater than 0 is most likely robot trade. if set at zero the indicator is used to display the properties of manually opened trade, the user can put the magic number of trade opened by robot in it also.
You can experiment with the settings to have more understanding of this strength indicator.










用户没有留下任何评级信息