• 概述
  • 评论
  • 评论
  • 新特性

Movement Exhaustion

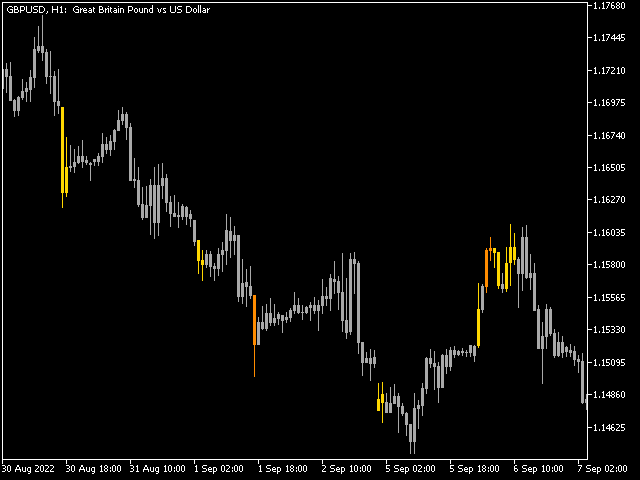
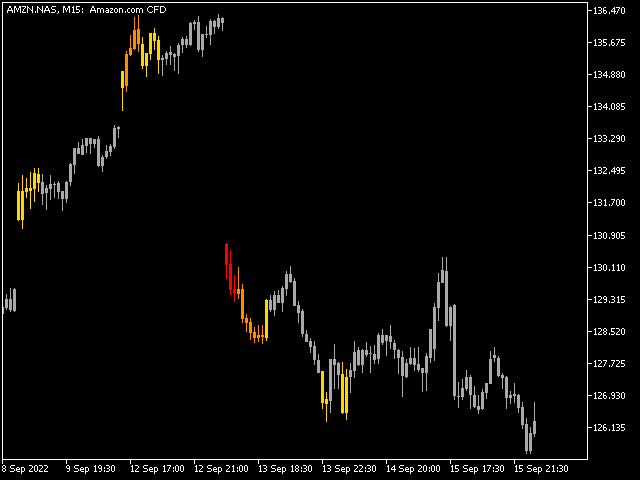
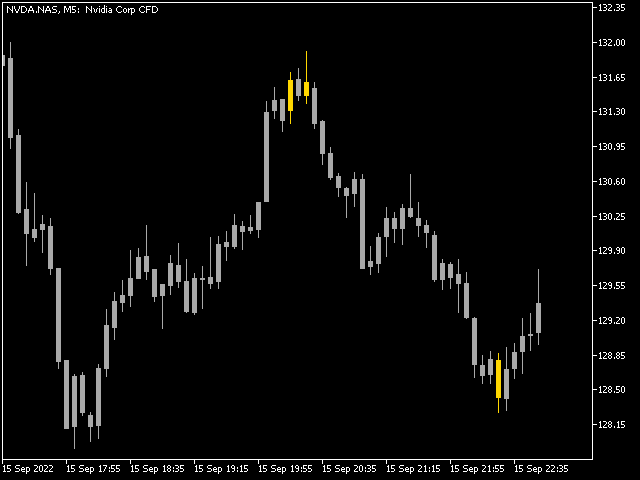
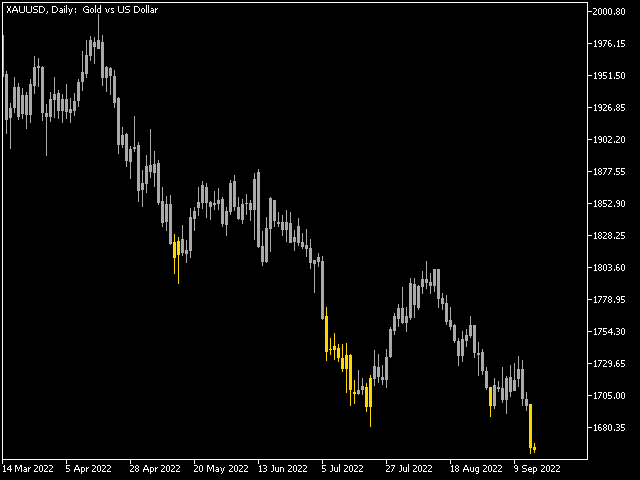
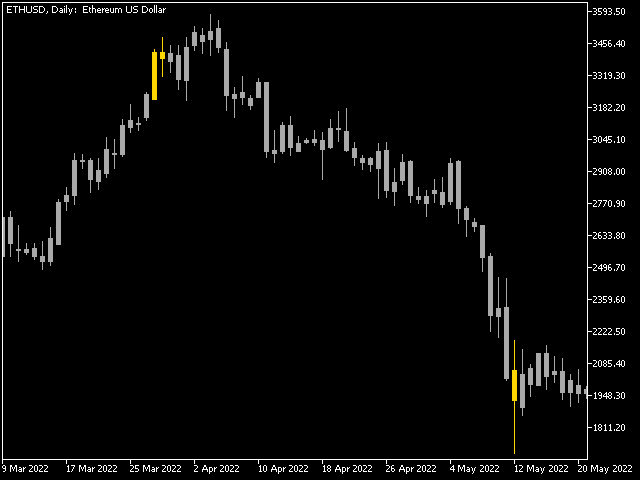
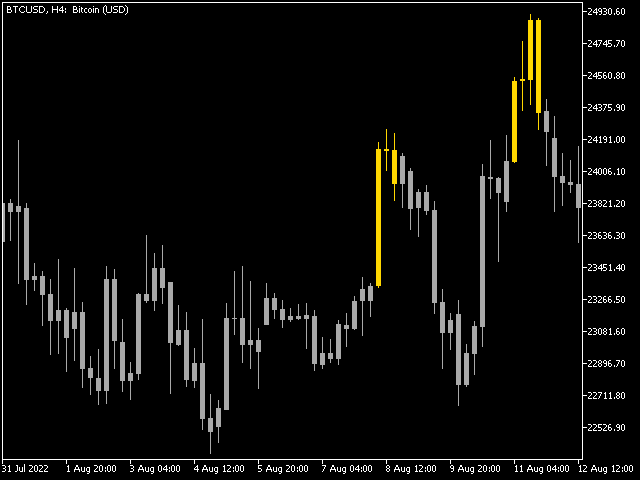
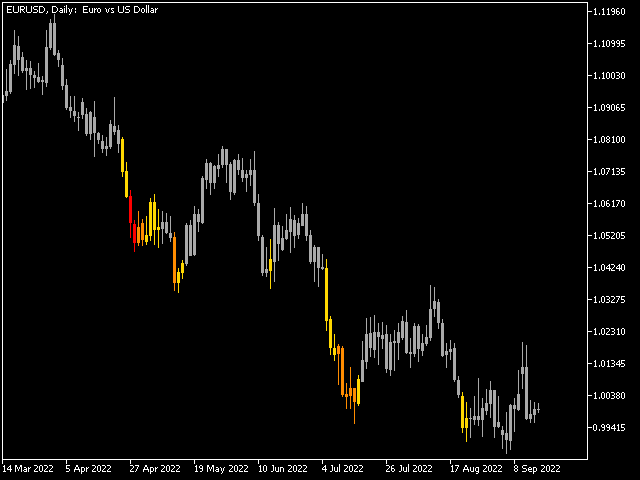
The movement exhaustion is a color rule that helps indicate when the movement will revert its direction.

The darker the color, the greater the probability to revert.

The indicator is based on the price statistic.

Works on every timeframe, every instrument.

Five color options:

0. Natural movement. (Gray)

1 - 4. Movement exhaustion (Yellow to maroon)

The trader can use it as reversal or exhaustion signal.

In a trend following trade it can be used as an exhaustion signal, indicating the movement can revert soon.

In a reversion trade it can be used as an entry region signal.

(Indicator do not repaint)


To use its signal as a Custom Indicator:

The buffer_num to access the signal is 5.

int h_Exhaustion;
double Exhaustion[];

int OnInit()
{
   //--- on init stuff ...

   h_Exhaustion = iCustom(_Symbol, _Period, "Exhaustion");

   //--- on init stuff ...
}

int OnCalculate()
{
   //--- The buffer_num to get the indicator signal is 5
   ArraySetAsSeries(Exhaustion, true);
   if (CopyBuffer(h_Exhaustion, 5, 0, bars + 1, Exhaustion) < 0 || h_Exhaustion < 0)
      return (-1);

   //--- on calculate stuff ...
}


推荐产品
Follow The Line MT5
Oliver Gideon Amofa Appiah
4.52 (29)
This indicator obeys the popular maxim that: "THE TREND IS YOUR FRIEND" It paints a GREEN line for BUY and also paints a RED line for SELL. (you can change the colors). It gives alarms and alerts of all kinds. IT DOES NOT REPAINT and can be used for all currency pairs and timeframes. Yes, as easy and simple as that. Even a newbie can use it to make great and reliable trades. NB: For best results, get my other premium indicators for more powerful and reliable signals. Get them here: https://www.m
FREE
What is this indicator? This indicator is the MACD (Moving Average Convergence/Divergence) supporting Virtual Trading mode of  Knots Compositor . When the mode is turned on, the indicator will be recalculated based on the displayed candlesticks. When the mode is turned off, the indicator will be recalculated based on the original chart candlesticks. Types of the applied price - Close - Open - High - Low - Median Price (HL/2) - Typical Price (HLC/3) - Weighted Price (HLCC/4) KC-Indicators
FREE
Time Segmented Volume for MT5
Fernando Carreiro
5 (1)
(谷歌翻译) 该指标基于 Worden Brothers, Inc 开发的原始“ Time Segmented Volume (TSV) ”。 但是,我为此添加了一些额外的功能。 可以选择要应用的价格,而不是仅使用原始默认收盘价。 您还可以选择使用哪种交易量加权,包括基于真实范围的伪交易量,或根本不使用交易量加权。 (谷歌翻譯) 該指標基於 Worden Brothers, Inc 開發的原始“ Time Segmented Volume (TSV) ”。 但是,我為此添加了一些額外的功能。 可以選擇要應用的價格,而不是僅使用原始默認收盤價。 您還可以選擇使用哪種交易量加權,包括基於真實範圍的偽交易量,或根本不使用交易量加權。 (Original text) This indicator is based on the original “ Time Segmented Volume (TSV) ” developed by Worden Brothers, Inc . However, I added an extra few features to this one. One ca
FREE
Important Lines
Terence Gronowski
4.86 (21)
This indicator displays Pivot-Lines, preday high and low, preday close and the minimum and maximum of the previous hour. You just have to put this single indicator to the chart to have all these important lines, no need to setup many single indicators. Why certain lines are important Preday high and low : These are watched by traders who trade in a daily chart. Very often, if price climbs over or falls under a preday low/high there is an acceleration in buying/selling. It is a breakout out of
FREE
Trendline mt5 indicator
David Muriithi
3 (1)
Are you tired of drawing trendlines every time you're analyzing charts? Or perhaps you would like more consistency in your technical analysis. Then this is for you. This indicator will draw trend lines automatically when dropped on a chart. How it works Works similar to standard deviation channel found on mt4 and mt5. It has 2 parameters: 1. Starting Bar 2. Number of bars for calculation The   starting bar   is the bar which drawing of the trend lines will begin, while the   number of bars for c
FREE
LT Donchian Channel
Thiago Duarte
4.8 (5)
Donchian Channel is an indicator created by Richard Donchian. It is formed by taking the highest high and the lowest low of the last specified period in candles. The area between high and low is the channel for the chosen period. Its configuration is simple. It is possible to have the average between the upper and lower lines, plus you have alerts when price hits one side. If you have any questions or find any bugs, please contact me. Enjoy!
FREE
Donchian Channel DC
Renato Takahashi
Donchian Channel DC is the indicator of Donchian Channels, that plots maximum and minimum values of a specific period, besides mean value line. It´s possible to configure simple period for analysis and the indicator will plot all three values. You can trade with this indicator as trend or reversal, according to each strategy. Do not let to test others indicators as soon as others expert advisors.
Order Book, known also as Market Book, market depth, Level 2, - is a dynamically updated table with current volumes of orders to buy and to sell specific financial instument at price levels near Bid and Ask. MetaTrader 5 provides the means for receiving market book from your broker, but in real time only, without access to its history. The indicator OrderBook Cumulative Indicator accumulates market book data online and visualizes them on the chart. In addition, the indicator can show the market
Countdown Candle Close
Sid Ali Temkit
3 (1)
The Candle Countdown Timer for MetaTrader 4 (also available for MT5) is a vital indicator designed to help you manage your trading time effectively. It keeps you updated about market open and close times by displaying the remaining time before the current candle closes and a new one forms. This powerful tool enables you to make well-informed trading decisions. Key Features: Asia Range: Comes with an option to extend the range. Broker Time, New York, London Time: Displays the current broker time
FREE
Menora Indicator
Arnold Kurapa
4 (1)
Menora (All In One) Indicator. This is the advanced and premium indicator for the Magic Trend, a free indicator.  It has 3 output signals driven by different market conditions. This indicator has a double function of working as an indicator and utility at the same time. Specifications  1]  3 output signals a) Slow Moving Average with color change - The MA has a non-repaint color change, which makes it perfect for entry signals. b) Fast Moving Average (the original Magic Trend line) - Give
FREE
如果产品有任何问题或者您需要在此产品上添加功能,请联系我 Contact/message me if you encounter any issue using the product or need extra feature to add on the base version. Floating Highest Lowest MT5 provides you an intuitive and user-friendly method to monitor the floating highest (profit) and lowest (loss) that all your trades together ever arrive. For example, I opened 3 orders, which arrived at $4.71 floating profit when trade following trend. Later when the trend is against me, these 3 orders arrive $30 in loss, and
FREE
FREE
DALA Forecast
Grigorii Matsnev
About the indicator: DALA Forecast is a universal tool for predicting the dynamics of time series of any nature. For prediction, modified methods of nonlinear dynamics analysis are used, on the basis of which a predictive model is built using machine learning methods.  To get the trial version of the indicator, you can contact me in private messages. How to use the indicator: Apply the indicator to your chosen financial instrument or indicator with the settings you need. The prediction will b
FREE
Cumulative Delta MT5
Evgeny Shevtsov
4.53 (53)
The indicator analyzes the volume scale and splits it into two components - seller volumes and buyer volumes, and also calculates the delta and cumulative delta. The indicator does not flicker or redraw, its calculation and plotting are performed fairly quickly, while using the data from the smaller (relative to the current) periods. The indicator operation modes can be switched using the Mode input variable: Buy - display only the buyer volumes. Sell - display only the seller volumes. BuySell -
FREE
The indicator measures the frequency of incoming ticks to analyze the market activity. Bullish and bearish ticks are analyzed separately, informing about the currently predominant market sentiment. According to observations, an increase in the frequency of ticks (panic) indicates the beginning of strong price changes, and an increase in the frequency of ticks in a particular direction not only accompanies a price change in this direction, but also often anticipates it. The indicator is indispens
FREE
TradeQL
Abdiel Aviles Jimenez
The TradeQL Indicator is a customizable tool that highlights specific trading patterns on candlestick charts. Users can define patterns through TradeQL queries, which the indicator then applies to the chart, visually representing matches and captured groups. Ideal for identifying complex trade setups in real-time. TradeQL queries are specified using the TradeQL Language. See https://github.com/abdielou/tradeql for more details. This language is expressed as a regular expression. The language a
FREE
Rainbow MT5
Jamal El Alama
4 (1)
Description : Rainbow MT5 is a technical indicator based on Moving Average with period 34 and very easy to use. When price crosses above MA and MA changes color to green, then this is a signal to buy. When price crosses below MA and MA changes color to red, then this is a signal to sell. The Expert advisor ( Rainbow EA MT5 ) based on Rainbow MT5 indicator is now available here . MT4 version is available here .
FREE
High Low Open Close
Alexandre Borela
4.97 (37)
如果你象这个项目一样,就有5个饥饿审查。 塔克的后续工作: borelatech 这项指标采用了既定价格的公开、高、低价和关闭价格 可以对特定时间区加以调整。 许多机构和专业人士都认为这些是重要的。 贸易商可以为你了解他们可能更进一步的地点, 积极。 现有期间为: 前一日。 前一星期。 曾任Month。 曾任。 前一年。 或: 目前日。 目前周。 目前 Month。 目前配额。 今年。
FREE
Expansoes M
Marcus Vinicius Da Silva Miranda
The M Extensions are variations of the Golden Ratio (Fibonacci Sequence). It is the World's first technique developed for Candle Projections. Advantages: Easy to plot. Candle anchoring; High and accurate precision as support and resistance; Excellent Risk x Return ratio; Works in any timeframe; Works in any asset / market.   The M Extensions are classified into: M0: Zero point (starting candle) RC: Initial candle control region M1: Extension region 1 M2: Extension region 2 M3: Extension r
FREE
VWAP Volume And Price is the indicator for Volume Weighted Average Price, designed according to regular calculation. The average price is calculated using typical price - (high + low + close) / 3 - and weighted by volume for each candle. So, the indicator can be used to trend trades, balanced with volume. Try other products and expert advisors too. Any doubt, PM.
Italo Trend Indicator MT5
Italo Santana Gomes
4.89 (9)
BUY INDICATOR AND GET EA FOR FREE AS A BONUS + SOME OTHER GIFTS! ITALO TREND INDICATOR  is the best trend indicator on the market, the Indicator works on all time-frames and assets, indicator built after 7 years of experience on forex and many other markets. You know many trend indicators around the internet are not complete, does not help, and it's difficult to trade, but the Italo Trend Indicator is different , the Italo Trend Indicator shows the signal to buy or sell, to confirm the signal t
Value Chart Candlesticks
Flavio Javier Jarabeck
4.7 (10)
The idea of a Value Chart indicator was presented in the very good book I read back in 2020 , " Dynamic Trading Indicators: Winning with Value Charts and Price Action Profile ", from the authors Mark Helweg and David Stendahl. The idea is simple and the result is pure genius: Present candlestick Price analysis in a detrended way! HOW TO READ THIS INDICATOR Look for Overbought and Oversold levels. Of course, you will need to test the settings a lot to find the "correct" one for your approach.
FREE
SC MTF Stochastic MT5
Krisztian Kenedi
4.92 (13)
Highly configurable Stochastic indicator. Features: Highly customizable alert functions (at levels, crosses, direction changes via email, push, sound, popup) Multi timeframe ability Color customization (at levels, crosses, direction changes) Linear interpolation and histogram mode options Works on strategy tester in multi timeframe mode (at weekend without ticks also) Adjustable Levels Parameters: Stochastic Timeframe:  You can set the lower/higher timeframes for Stochastic. Stochastic    Bar
FREE
This indicator is an automated version of the Fibonacci retracement (Fib) indicator. Deciding the best areas to use when drawing the fib can be tricky and this  indicator was made with that in mind. When you drop it on the chart it will automatically choose the best points to draw the fib with, but in case you aren't satisfied with those regions, you can adjust it as you wish.
FREE
WAPV Box Effort x Result
Eduardo Da Costa Custodio Santos
WA_PV_BOX_EFFORT X MT5 的结果 WAPV Box Effort x Result Indicator 是 Package Indicators 组(Wyckoff Academy Wave Market)的一部分。 MT5 的 WAPV Box Effort x Result Indicator 可帮助您阅读价格和交易量。它的阅读包括协助识别努力x结果 在图表创建的波浪中。 当方框为绿色时,MT5 的 WAPV Box Effort x Result Indicator 表示交易量有利于需求,而当方框为红色时 量有利于供应。 方框越大,成交量相对于价格的位移越大。如果价格的上升波与 Box 的大小不成比例,则 努力x结果。 以一种非常直观的方式,我们可以识别出数量和价格之间的这种差异。 MT5 的 WAPV Box Effort x Result Indicator 还允许您通过将指标置于零轴下方来改善可视化。 以即时交易量和实际交易量在市场上运作 看图片:
Tick Speed Free MT5
John Louis Fernando Diamante
Tick Speed Free povides a on-chart label of tick speed to allow you to see the ebb and flow of market activity. Observing rises and falls in tick speed may allow you to better time entries to reduce slippage and re-quotes. Options include: - colores for low-mid-high tick speeds - placement and styling - prefix & suffix to customise the speed label Troubleshooting: - Note, in the tester environment, tick timings are limited to what is supplied by the tester environment and it's speed - If
FREE
BoxInside MT5
Evgeny Shevtsov
5 (3)
This indicator calculates the volume profile and places labels that correspond to the VAH, VAL and POC levels, for each candle individually. Indicator operation features The indicator works on the timeframes from M3 to MN, but it uses the history data of smaller periods: M1 - for periods from M3 to H1, M5 - for periods from H2 to H12, M30 - for the D1 period, H4 - for the W1 period, D1 - for the MN period. The color and location of the VAL, VAH and POC labels on the current candle are consider
FREE
The indicator draws a normal chart by coloring it in colors based on prices calculated by the Heiken Ashi indicator algorithm. That is, the shape of the candles does not change. In fact, this is the same Heiken Ashi that does not distort the price chart. Then there will be a drawing of a cat, because there is nothing more to write about the indicator. .                                                       
FREE
Mitimom
Danil Poletavkin
The indicator is based on Robert Miner's methodology described in his book "High probability trading strategies" and displays signals along with momentum of 2 timeframes. A Stochastic oscillator is used as a momentum indicator. The settings speak for themselves period_1 is the current timeframe, 'current' period_2 is indicated - the senior timeframe is 4 or 5 times larger than the current one. For example, if the current one is 5 minutes, then the older one will be 20 minutes The rest of the
FREE
Forex Indicator Arrows
NGUYEN NGHIEM DUY
1 (1)
Forex Indicator Arrows is an arrow Indicator used as an assistant tool for your trading strategy. The indicator analyzes the standard deviation of bar close for a given period and generates a buy or sell signals if the deviation increases. It good to combo with Martingale EA to follow Trend and Sellect Buy Only/Sell Only for EA work Semi-Automatic. You can use this  Indicator with any EAs in my Products.
FREE
该产品的买家也购买
TPSpro RFI Levels MT5
Roman Podpora
4.75 (12)
指示       俄罗斯 -        英语   建议 与指示器一起使用     -       TPSpro 趋势专业版 -   MT4版本       交易中的一个关键要素是做出买卖交易工具决定的区域或水平。尽管主要参与者试图隐藏他们在市场中的存在,但他们不可避免地会留下痕迹。我们的任务是学习如何识别这些痕迹并正确解释它们。 主要功能: 向卖家和买家显示活跃区域! 该指标显示所有正确的初始买入和卖出脉冲水平/区域。激活这些水平/区域后,开始寻找切入点,水平会改变颜色并填充特定阴影。此外,还会显示箭头,以便更直观地了解情况。 显示更高时间范围内的级别/区域(MTF 模式) 添加了使用更高时间间隔显示级别/区域的功能。此外,该指标还具有自动趋势检测功能(   TPSproTREND PRO   )。 用于交易的单独专业的逐步算法。 该算法专为日内交易而设计,既可顺势交易,也可逆势交易。每个活动模板均提供详细说明。 适用于多种时间范围 。 TPSpro RFI 水平指标可用于图表上的任何时间范围,从一分钟(M1)开始一直到每月(MN)。 图形和声音警报。 该指标提供图形和声音指示
首先,值得强调的是,这个交易系统是一个非重绘、非重画和非滞后的指标,这使得它非常适合手动和机器人交易。 在线课程,手册和下载预设。 “智能趋势交易系统 MT5”是专为新手和经验丰富的交易者量身定制的综合交易解决方案。它结合了超过 10 个优质指标,具有 7 多个强大的交易策略,使其成为适用于各种市场条件的多功能选择。 趋势跟随策略:提供精确的入场和止损管理,以有效地跟随趋势。 反转策略:识别潜在的趋势反转,使交易者能够利用区域市场的机会。 剃头策略:专为快速准确的日内交易和短期交易而设计。 稳定性:所有指标都不会重绘、不会重画和不会滞后,确保可靠的信号。 定制:支持自定义策略,以满足个人交易偏好。超过 7 种策略和组合可帮助您找到最佳策略。 信号清晰度:提供箭头信号,以指示清晰的入场和退出点。 实时警报:通过交易进出警报使交易者保持了解。 深入分析:提供更高时间框架的趋势分析和实时交易监控。 自适应颜色编码:利用蜡烛颜色编码来显示成交量、趋势和反转蜡烛信号。通过蜡烛颜色分析市场方向。 “智能趋势交易系统 MT5”赋予交易者必要的工具,以便在各种市场条件下做出明智和战略性的交易决策。无论
该仪表盘显示所选符号的最新可用谐波形态,因此您可以节省时间并提高效率 /  MT4 版本 。 免费指标:  Basic Harmonic Pattern 指标列 Symbol:   显示所选符号 Trend:     看涨或看跌 Pattern:    形态类型(Gartley、蝴蝶、蝙蝠、螃蟹、鲨鱼、Cypher 或 ABCD) Entry:     入口价格 SL: 止损价 TP1: 第一止盈价 TP2: 第二次获利价格 TP3: 第三次获利价格 Current price:    当前价格 Age (in bars):   最后绘制的模式的年龄 主要输入 Symbols :   从 "28 种主要货币对 "或 "选定符号 "中选择。 Selected Symbols :   希望监控的符号,用逗号分隔("EURUSD,GBPUSD,XAUUSD")。如果您的经纪商为货币对设置了后缀或前缀,您必须在以下两个参数中添加(货币对前缀或货币对后缀)。 Max Iteration:   调整模式的最大迭代次数(如果该值越小,则模式越少,性能越快;如果该值越大,则模式越多,性能
Atomic Analyst MT5
Issam Kassas
4.32 (19)
首先值得强调的是,该交易指标是非重绘、非延迟的指标,这使其成为手动和机器人交易的理想选择。 用户手册:设置、输入和策略。 Atomic Analyst是一种PA价格行动指标,利用价格的力量和动量来寻找市场上更好的机会。配备了高级过滤器,可帮助去除噪音和假信号,并提高交易潜力。使用多层复杂的指标,Atomic Analyst扫描图表,并将复杂的数学计算转化为任何初学者都能理解并用来做出一致交易决策的简单信号和颜色。 “Atomic Analyst”是专为新手和经验丰富的交易者量身定制的综合交易解决方案。它将高级指标和一流功能融合为一体的交易策略,使其成为所有类型交易者的多功能选择。 日内交易和剥头皮策略:专为快速准确的日内交易和短期交易而设计。 日内和摆动交易策略:可用作追求价格大幅波动的日内和摆动交易者的可靠工具。 多货币和市场:凭借其可靠的精度,在不同的工具和市场上运作。 多个时间框架:可在多个时间框架上使用,性能良好。 稳定性:所有指标均不重绘、不重绘和不滞后,确保可靠的信号。 信号清晰度:提供箭头信号,用于清晰的入场和出场点。 实时警报:通过交易入场、SL和TP警报通知交
FX Power MT5 NG
Daniel Stein
5 (6)
通过 mql5 和 Telegram 上 的晨间简报获取每日市场更新,包括详细信息和屏幕截图 ! FX Power MT5 NG 是我们长期以来非常受欢迎的货币强度计算器 FX Power 的下一代产品。 这款下一代强度计算器能提供什么?您所喜爱的原版 FX Power 的所有功能 附加功能 黄金/XAU 强度分析 更精确的计算结果 可单独配置的分析周期 可自定义计算限制,以获得更好的性能 为希望查看更多信息的用户提供特殊的多实例设置 无尽的图形设置,可在每个图表中设置您最喜欢的颜色 无数的通知选项,让您再也不会错过任何重要信息 采用 Windows 11 和 macOS 风格的全新圆角设计 神奇的移动指标面板 FX Power 主要功能 所有主要货币的完整强势历史 所有时间框架内的货币强弱历史 所有经纪商和图表的计算结果完全相同 100% 可靠的实时计算 -> 无重绘 可通过下拉列表选择分析时段 通过自定义模式单独配置分析时段 可在一个图表中使用多个实例 可移动 FX Power 显示屏(通过拖放) 适用于高分辨率 QHD、UHD 和 4K 显示器 自动终端配置 针对平板电脑
Entry Points Pro for MT5
Yury Orlov
4.46 (124)
这款指标用于 MT5,可提供准确的入场交易信号,且无重绘。 它可应用在任何金融资产:外汇、加密货币、贵金属、股票、指数。 它将提供极其精准的评估,并告诉您何时开仓和平仓的最佳时机。 观看 视频 (6:22),其中包含一个仅处理单一信号的示例,该信号即可值回指标购价! 大多数交易者在 Entry Points Pro 指标的帮助下,在第一个交易周内即改善了他们的交易结果。 订阅我们的 Telegram 群 ! Entry Points Pro 指标的益处。 入场信号无重绘 如果信号出现,并得到确认,则它不会再消失;不像是重绘指标,它会导致重大的财产损失,因为它们可以在显示信号后再将其删除。 无差错开仓 指标算法可令您找到入场交易(买入或卖出资产)的理想时机,从而提高每位交易者的成功率。 Entry Points Pro 可操作任何资产 它允许您在 MT5 平台上交易任何经纪商的加密货币、股票、贵金属、指数、大宗商品和货币。 提供任何方向的信号 Entry Points Pro 指标提供针对任意价格走势的入场交易信号 - 上涨、下跌或横盘(横向)。
FX Volume MT5
Daniel Stein
4.93 (14)
通过 mql5 和 Telegram 上 的 " 晨间简报 "获取每日市场更新,包括详细信息和屏幕截图 ! 外汇交易量(FX Volume)是第一个也是唯一一个从经纪商角度真正洞察市场情绪的交易量指标。 直接在您的图表上看到这些信息是真正改变游戏规则和突破性的交易解决方案。 受益于独特的市场数据洞察,如 比率(Ratios )显示货币多头和空头头寸的比率(百分比 比率变化 显示所选时间段内的多头比率及其百分比变化 总交易量 显示货币的总交易量(多头和空头),以手为单位 多头 交易量显示货币所有多头头寸的交易量 空头 交易量显示所有货币空头头寸的交易量 净多头 显示净多头交易量,即所有多头头寸减去所有空头头寸(以手为单位)。 净多头百分比 显示货币净多头交易量的变化 请阅读我们的基本教程 -> "如何使用外汇交易量进行交易 " 获取更多信息,如常见问题、交易技巧和教程视频,请访问我们的 外汇交易量公共信息频道 请 安装并运行 SI Connect 以建立与我们数据中心的持续连接 背景信息 我们都知道,外汇是一个分散的市场。这就是为什么我们必须打破常规思维,开发一个独
TPA True Price Action indicator reveals the true price action of the market makers through 100% non-repainting signals strictly at the close of a candle! TPA shows entries and re-entries, every time the bulls are definitely stronger than the bears and vice versa. Not to confuse with red/green candles. The shift of power gets confirmed at the earliest stage and is ONE exit strategy of several. There are available now two free parts of the TPA User Guide for our customers. The first "The Basics"
ON Trade Gann Squares MT5
Abdullah Alrai
5 (1)
Gann 方块指标是一种强大的市场分析工具,基于 W.D. Gann 在其“市场预测数学公式”一文中介绍的数学概念。该指标融合了与平方数(如 144、90 和 52)有关的 Gann 技术,以及平方 9。此外,它还融入了  关于如何将平方 9 与通道和星形图案结合使用的方法。 用户手册和使用方式: 在使用该指标之前,我们建议您阅读用户手册,并与我们联系以获得任何澄清。您可以在我们的网站上找到完整的用户手册。 该指标提供了 MT5 的完整版本供购买,也提供了 MT4 的免费版本供测试。提供了两个版本的链接供您方便使用。 主要特点和功能: Gann 方块指标为您的交易环境提供了全套工具,使您能够基于几何图案和 Gann 的概念做出明智的决策。以下是主要特点: 平方 9 分析:   该指标可以绘制与平方 9 有关的各种元素,包括水平线、星形图案、网格、Gann 扇形等。这在您的图表上提供了 Gann 的几何概念的视觉表示。 Gann 方块:   该指标绘制了 Gann 方块 52、90 和 144,使您能够可视化和分析它们与价格走势的关系。 自由 Gann 星形图案:   该指标使您能够直接
Gartley Hunter Multi
Siarhei Vashchylka
5 (8)
Gartley Hunter Multi - An indicator for searching for harmonic patterns simultaneously on dozens of trading instruments and on all possible timeframes. Manual (Be sure to read before purchasing) | Version for MT4 Advantages 1. Patterns: Gartley, Butterfly, Shark, Crab. Bat, Alternate Bat, Deep Crab, Cypher 2. Simultaneous search for patterns on dozens of trading instruments and on all possible timeframes 3. Search for patterns of all possible sizes. From the smallest to the largest 4. A
Blahtech Supply Demand MT5
Blahtech Limited
4.54 (13)
Was: $299  Now: $99   Supply Demand uses previous price action to identify potential imbalances between buyers and sellers. The key is to identify the better odds zones, not just the untouched ones. Blahtech Supply Demand indicator delivers functionality previously unavailable on any trading platform. This 4-in-1 indicator not only highlights the higher probability zones using a multi-criteria strength engine, but also combines it with multi-timeframe trend analysis, previously confirmed swings
介绍     Quantum Breakout PRO   ,突破性的 MQL5 指标,正在改变您交易突破区域的方式!由拥有超过13年交易经验的资深交易员团队开发,     量子突破 PRO     旨在通过其创新和动态的突破区域策略将您的交易之旅推向新的高度。 量子突破指标将为您提供带有 5 个利润目标区域的突破区域的信号箭头,以及基于突破框的止损建议。 它既适合新手交易者,也适合专业交易者。 量子 EA 通道:       点击这里 重要的!购买后请私信我领取安装手册。 建议: 时间范围:M15 货币对:GBPJPY、EURJPY、USDJPY、NZDUSD、XAUUSD 账户类型:ECN、Raw 或 Razor,点差极低 经纪商时间:GMT +3 经纪商:IC Markets、Pepperstone with Raw 和 Razor 的点差最低 规格: 不重漆! 最多 5 个建议利润目标区域 建议止损水平 可定制的盒子。您可以设置自己的 Box Time Start 和 Box Time End。 接触 如果您有任何疑问或需要帮
Quantum Trend Sniper
Bogdan Ion Puscasu
4.8 (49)
介绍   量子趋势狙击指标 ,突破性的 MQL5 指标,正在改变您识别和交易趋势反转的方式!由拥有超过13年交易经验的资深交易员团队开发,     量子趋势狙击指标   旨在通过其创新的方式以极高的准确度识别趋势反转,将您的交易之旅推向新的高度。 ***购买量子趋势狙击指标,即可免费获得量子突破指标!*** 当量子突破指标识别出趋势反转时,它会向您发出警报和信号箭头,并建议您三个止盈水平。 它既适合新手交易者,也适合专业交易者。 量子 EA 通道:       点击这里 MT4版本:       点击这里 建议: 时间范围: 所有时间范围。为了获得最佳结果,我们建议在 M15、M30 和 H1 时间范围内使用它。 货币对:欧元兑美元、英镑兑美元、澳元兑美元、欧元兑英镑、, EURAUD,  XAUUSD 账户类型:ECN、Raw 或 Razor,点差极低 经纪时间:任意 经纪商:IC Markets、Pepperstone with Raw 和 Razor 的点差最低 建议止损:50 点 建议止盈水平:20 点、50 点和
Auto Order Block with break of structure based on ICT and Smart Money Concepts (SMC) Futures Break of Structure ( BoS )             Order block ( OB )            Higher time frame Order block / Point of Interest ( POI )    shown on current chart           Fair value Gap ( FVG ) / Imbalance   -  MTF      ( Multi Time Frame )    HH/LL/HL/LH  -  MTF      ( Multi Time Frame )  Choch  MTF      ( Multi Time Frame )  Volume Imbalance     ,  MTF          vIMB Gap’s Power of 3 Equal High
RelicusRoad Pro MT5
Relicus LLC
5 (17)
现在$ 147(更新后增加到$ 499) - 无限帐户(PC或Mac) RelicusRoad 用户手册 + 培训视频 + 访问 Private Discord Group + VIP 身份 一种看待市场的新方式 RelicusRoad 是世界上最强大的外汇、期货、加密货币、股票和指数交易指标,为交易者提供保持盈利所需的所有信息和工具。我们提供技术分析和交易计划,帮助每一位交易者取得成功,从初学者到高级。它是一个关键的交易指标,可以提供足够的信息来预测未来的市场。我们相信一个完整的解决方案,而不是图表上几个没有意义的不同指标。这是一个多合一指标,显示无与伦比且非常准确的信号、箭头 + 价格行为信息。 RelicusRoad 基于强大的人工智能,提供缺失的信息和工具来教育您并使您成为交易专家,成为成功的交易者。 几乎所有技术指标都滞后,这意味着它们只能报告已经发生的事情。因此,他们只确认您过去可以看到的价格已经在哪里。我们相信领先指标可以预测未来价格,而无需重新绘制,也不要过度依赖可能改变并导致重新绘制的滞后指标。如果您根据滞后指标进行交易并建立头寸,您就知道您已
PTS Divergence Buy Finder MT5
PrecisionTradingSystems
PTS - Divergence Buy Finder 由Precision Trading Systems制作 Precision Divergence Finder旨在精确找到市场底部,并经常成功。在技术分析中,挑选底部通常比挑选顶部容易得多,这个工具正是为了完成这个任务而设计的。在识别出牛市背离后,等待趋势上升再购买是明智的。您可以使用10或20个周期的最高点进场,或者使用15-30周期的移动平均线上升来识别趋势变化。 这个复杂的算法会实时逐根柱状图寻找并计算活跃的需求指数背离的数量。 该模型观察市场价格何时创出新低,而需求指数未创新低,从而产生背离。 该指标使用两个设置。     • 需求指数(DI)长度,它将为指标提供寻找的对象,并将为您选择的长度上的任何DI背离进行查找。     • 差异,这是[DI值现在]与[DI值长达200个周期以前]之间的背离量,对于它从各种回望期间找到的每个背离,它将在指标窗口中生成[1]输出。 最多检查20个周期,最大输出值将显示为20。 建议的设置 需求指数长度从15到100都可以使用,但最佳范围在20到60之间。 背离的差异为0.1至2
GannRS Trend Scalper   GannRS is an advanced trading tool based on Gann Law and Supports and Resistances. designed to have an   active trading at any time not lagging Indications are given at the beginning of a new candle Please watch the full tutorial video. How to use GannRS Very easy to set up... Put it on your chart Adjust inputs Inputs Show Resistance and support : [bool]  true = Shows R/S on chart false = does not show Show Levels :[bool]  true = Shows levels on the chart false = doe
Advanced Supply Demand MT5
Bernhard Schweigert
4.5 (14)
任何新手或专业交易者的最佳解决方案! 该指标是一款独特、高质量、且价格合理的交易工具,因为我们已经整合了许多专有功能和新公式。 依据此更新,您将能够显示双重时间帧区域。 您不仅可以显示一个较高的时间帧,还可以同时显示图表时间帧,加上更高的时间帧:显示嵌套时区。 供需双方所有交易者都会喜欢它。 :) 重要信息披露 高级供需的最大潜力,请访问 https://www.mql5.com/zh/blogs/post/720245   想象您的交易如何得以改善,是因为您能够精准定位入场或目标位吗? 构建于新的底层算法,它可以更轻松地识别出买卖双方之间的潜在失衡。 这是因为它以图形方式展示供需最强劲区域,及其过去的表现(显示旧区域)。 这些功能旨在帮助您更轻松地发现最佳入场区域和价位。 现在您可以针对您的交易品种和时间帧来优化和编辑区域强度! 高级供需指标适用于所有产品和时间帧。 它是一个新的公式,非常新的功能是两个区域强度函数可由用户输入进行调整! 这在交易中是一大优势。 当您学习如何使用专有功能,例如带有价格游离最小 X 因子的区域强度时,您能够判断该区域强劲与否。 供需区域用作警报触发器
FxaccurateLS
Shiv Raj Kumawat
WHY IS OUR FXACCCURATE LS MT5 THE PROFITABLE ? PROTECT YOUR CAPITAL WITH RISK MANAGEMENT Gives entry, stop and target levels from time to time. It finds Trading opportunities by analyzing what the price is doing during established trends. POWERFUL INDICATOR FOR A RELIABLE STRATEGIES We have made these indicators with a lot of years of hard work. It is made at a very advanced level. Established trends provide dozens of trading opportunities, but most trend indicators completely ignore them!
Matrix Arrow Indicator MT5
Juvenille Emperor Limited
5 (12)
矩阵箭头指标 MT5   是一种独特的 10 合 1 趋势,遵循   100% 非重绘多时间框架指标 ,可用于所有符号/工具: 外汇 、 商品 、 加密货币 、 指数 、 股票 。 Matrix Arrow Indicator MT5 将在其早期阶段确定当前趋势,从多达 10 个标准指标中收集信息和数据,它们是: 平均定向运动指数 (ADX) 商品渠道指数 (CCI) 经典 Heiken Ashi 蜡烛 移动平均线 移动平均收敛散度 (MACD) 相对活力指数 (RVI) 相对强弱指数 (RSI) 抛物线SAR 随机振荡器 威廉姆斯的百分比范围 当所有指标给出有效的买入或卖出信号时,相应的箭头将打印在图表上,在下一根蜡烛/柱线开盘时,指示强劲的上升趋势/下降趋势。用户可以选择使用哪些指标,并可以单独调整每个指标的参数。 Matrix Arrow Indicator MT5 仅从选定的指标中收集信息,并仅根据其数据打印箭头。   Matrix Arrow Indicator MT5   还可以为所有新信号发送终端、推送通知或电子邮件警报。无论您是黄牛、日内交易者还是波段交易者, Mat
Beast Super Signal MT5
Dustin Vlok
2.71 (7)
正在寻找可以帮助您轻松识别有利可图的交易机会的强大外汇交易指标? Beast Super Signal 就是您的不二之选。 这个易于使用的基于趋势的指标持续监控市场状况,寻找新的发展趋势或跳入现有趋势。当所有内部策略一致且彼此 100% 融合时,Beast Super Signal 会发出买入或卖出信号,无需额外确认。当您收到信号箭头警报时,只需买入或卖出。 购买后给我留言,让我加入我的私人 VIP 群组! (仅限购买完整产品)。 购买后给我发消息以获取最新的优化设置文件。 此处提供 MT4 版本。 在此处 获取 Beast Super Signal EA。 查看评论部分以查看最新结果! Beast Super Signal 根据您偏好的 1:1、1:2 或 1:3 风险回报率建议入场价、止损和获利水平,让您放心交易。这个 Beast Super Signal 是 100% 不可重新绘制的,这意味着它永远不会重新计算或重新绘制,每次都能为您提供可靠的信号。 Beast Super Signal 指标适用于所有时间范围,包括货币对、指数、商品和加密货币对。
Blahtech Market Profile MT5
Blahtech Limited
5 (9)
Was: $249  Now: $99   Market Profile defines a number of day types that can help the trader to determine market behaviour. A key feature is the Value Area, representing the range of price action where 70% of trading took place. Understanding the Value Area can give traders valuable insight into market direction and establish the higher odds trade. It is an excellent addition to any system you may be using. Inspired by Jim Dalton’s book “Mind Over Markets”, this indicator is designed to suit the
[ MT4 Version ] Only the next 10 units at current price! Final price: $299 Are you tired of spending months on demo or live accounts to test your trading strategies? The Backtesting Simulator is the ultimate tool designed to elevate your backtesting experience to new heights. Utilizing Metatrader historical symbol information, it offers an unparalleled simulation of real market conditions. Take control of your testing speed, test ideas quickly or at a slower pace, and witness remarkable improve
Quantum TrendPulse
Bogdan Ion Puscasu
介绍 Quantum TrendPulse   ,这是一款终极交易工具,它将 SuperTrend   、   RSI 和 Stochastic 的强大功能整合到一个综合指标中,以最大限度地发挥您的交易潜力。该指标专为追求精准和效率的交易者而设计,可帮助您自信地识别市场趋势、动量变化以及最佳进入和退出点。 主要特点: 超级趋势整合: 轻松跟随当前的市场趋势并乘上盈利浪潮。 RSI 精度: 检测超买和超卖水平,非常适合把握市场逆转时机,可用作 SuperTrend 的过滤器 随机精度: 利用随机振荡在波动的市场中寻找隐藏的机会, 用作超级趋势的过滤器 多时间范围分析: 从 M5 到 H1 或 H4,在不同时间范围内关注市场动态。 可定制的警报: 当您的自定义交易条件得到满足时收到通知,这样您就不会错过任何交易。 无论您是新手还是经验丰富的交易员,   Quantum TrendPulse 都能为您提供所需的优势,帮助您增强策略并自信地进行交易。借助这一强大的指标,将洞察力转化为利润 — 掌控您的交易! ***购买 Quantum TrendPulse,即可免费获得 Quantum T
IX Power MT5
Daniel Stein
4.17 (6)
IX Power 终于将 FX Power 的无与伦比的精确性带到了非外汇交易符号中。 它能准确判断您喜爱的指数、股票、商品、ETF 甚至加密货币的短期、中期和长期趋势强度。 您可以 分析 终端提供的 一切 。试试吧,体验一下您在交易时如何把握 时机 。 IX Power 主要功能 100% 精确的非重绘计算结果 - 适用于您终端中的所有交易符号 下拉式选择预配置以及可单独配置的强度分析周期 通过电子邮件、消息和手机通知的无数种通知选项 可访问的 EA 请求缓冲区 可自定义计算限制,以获得更好的性能 为希望查看更多信息的用户提供特殊的多实例设置 无尽的图形设置,让您在每个图表中都能找到最喜欢的颜色 采用 Windows 11 和 macOS 风格的圆角新面板设计 神奇的移动指标面板,可在子窗口和主图表之间无缝移动 适用于高分辨率 QHD、UHD 和 4K 显示器,并针对平板电脑和触摸屏进行了优化 IX Power 参数 最重要的参数不言自明,但我们很快会在另一篇文章中为您提供所有 IX Power 参数的完整说明。 使用别名 "参数可为技术交易符号
Contact me for instruction, any questions! Related Product:  Gold Trade Expert MT5 Introduction The breakout and retest strategy is traded support and resistance levels. it involves price breaking through a previous level.  The break and retest strategy is designed to help traders do two main things, the first is to avoid false breakouts. Many false breakouts start with a candlestick that breaks out of a level but ends with an immediate candlestick that brings the price back into the level. T
PZ Swing Trading MT5
PZ TRADING SLU
5 (4)
Swing Trading 是第一个旨在检测趋势方向的波动和可能的反转波动的指标。它使用在交易文献中广泛描述的基准摆动交易方法。该指标研究多个价格和时间向量,以追踪总体趋势方向,并检测市场超卖或超买并准备好进行修正的情况。 [ 安装指南 | 更新指南 | 故障排除 | 常见问题 | 所有产品 ] 市场波动的利润不会被窃取 指示器始终显示趋势方向 彩色价格带代表机会基准 彩色虚线表示可能的反转波动 该指标分析其自身的质量和性能 它实现了一个多时间仪表板 可定制的趋势和波动周期 它实现了电子邮件/声音/推送警报 指示器为非重涂或重涂 什么是摇摆交易 摇摆交易是一种尝试在一天到一周内从证券中获得收益的交易方式,尽管某些交易最终可以保持更长的寿命。摇摆交易者使用技术分析来买入弱点和卖出力量,并有耐心等待这些机会的发生,因为在发生一波抛售浪潮之后购买证券而不是陷入抛售更有意义。 机会基准 关于历史数据的大量研究证明,适合于波动交易的市场倾向于在基线价格带上下交易,基线价格带由图表显示,使用平均真实区间计算得出。波动交易者使用基线,该策略是购买常态和卖出躁狂,或做空常态并掩盖沮丧。
Trend Hunter MT5
Andrey Tatarinov
5 (2)
Trend Hunter 是外汇、加密货币和差价合约市场的趋势指标。 该指标的一个特点是,它可以自信地跟随趋势,当价格略微刺穿趋势线时不会改变信号。 指标不会重新绘制;收盘后会出现入市信号。 当沿着趋势移动时,指标会显示趋势方向上的其他入场点。 根据这些信号,您可以使用较小的止损进行交易。 趋势猎人是一个诚实的指标。 当您将鼠标悬停在指标信号上时,会显示该信号的潜在利润和可能的止损。 当出现新信号时,您可以收到以下通知: 警报 推送通知 通过电子邮件通知 电报中的通知 图表的屏幕截图也会发送到 Telegram,因此您无需打开终端即可做出交易决定。 指标信号可以在电报频道中在线查看 https://www.mql5.com/zh/market/product/11085#!tab=comments&page=13&comment=50356403 趋势猎人扫描仪可帮助您评估其他货币对和时间范围的趋势方向。 您还可以使用扫描仪接收其他仪器的入场信号。 要自动化交易,您可以使用使用指标信号进行交易的顾问  该指标通过位于图表下方的便捷面板进行控制。 MT4 版本 https://www.
AT Forex Indicator MT5
Marzena Maria Szmit
5 (4)
The AT Forex Indicator MT5 is a sophisticated trading tool designed to provide traders with a comprehensive analysis of multiple currency pairs. This powerful indicator simplifies the complex nature of the forex market, making it accessible for both novice and experienced traders. AT Forex Indicator uses advanced algorithms to detect trends, patterns and is an essential tool for traders aiming to enhance their forex trading performance. With its robust features, ease of use, and reliable signal
作者的更多信息
Breakout Fibo Target
Rodrigo Elizeu Cherutti
Indicator shows 3 Fibonacci expansion levels, based on the last pivot breakout. Pivots are calculated based on volatility (ATR), works on every Timeframe and Symbol. Lines are displayed only after the pivot breakout. A comment on the upper left side shows the minimum calculated value (in points) for pivots. Parameters: Variation: minimum variation for the pivot. ATR multiplication factor. (default 3) ATR Period: Period for ATR value calculations. (default 60) Ex.:   ATR on TimeFrame H1 = 100po
筛选:
无评论
回复评论
版本 1.2 2023.02.17
- Added the indicator signal on the Data Window
- Now the indicator signal can be used as a Custom Indicator
版本 1.1 2023.02.10
- Fixed a bug causing the indicator to not paint correctly new candles.