Market Steps MT5
- 指标
- Mahdi Ebrahimzadeh
- 版本: 5.50
- 更新: 19 六月 2024
- 激活: 5
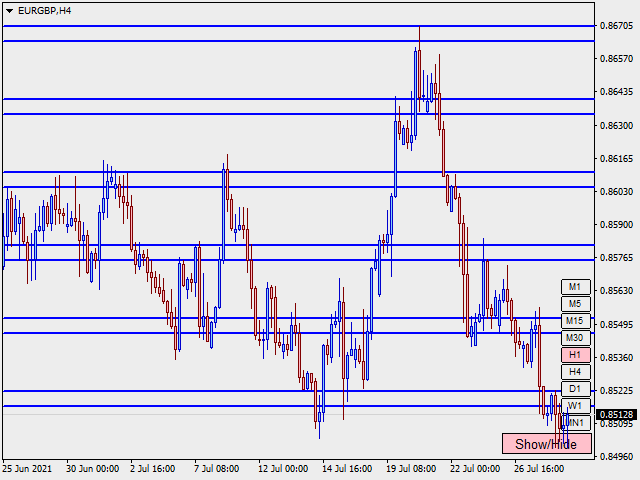
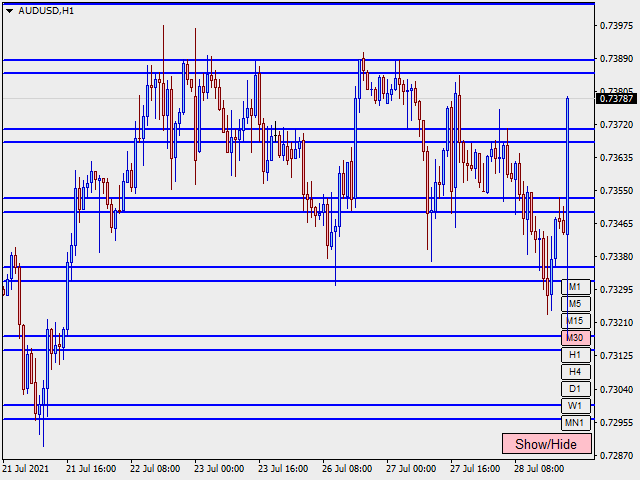
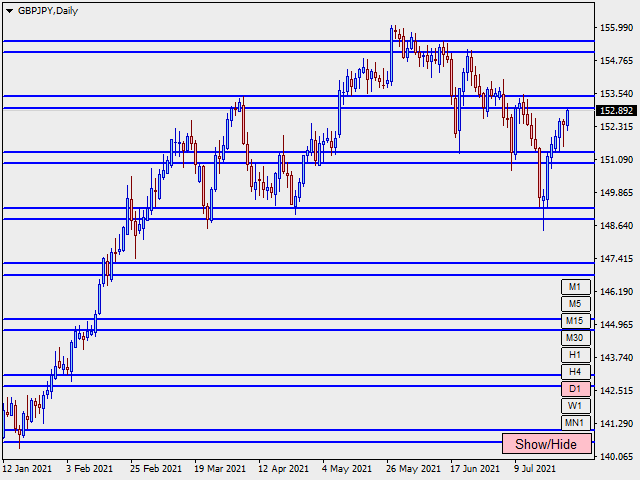
市场步骤指标是基于江恩时间/价格相关性设计和建立的,并通过外汇市场的价格行动特定规则进行优化。它使用市场订单流的概念来预测潜在的高订单量的价格区域。
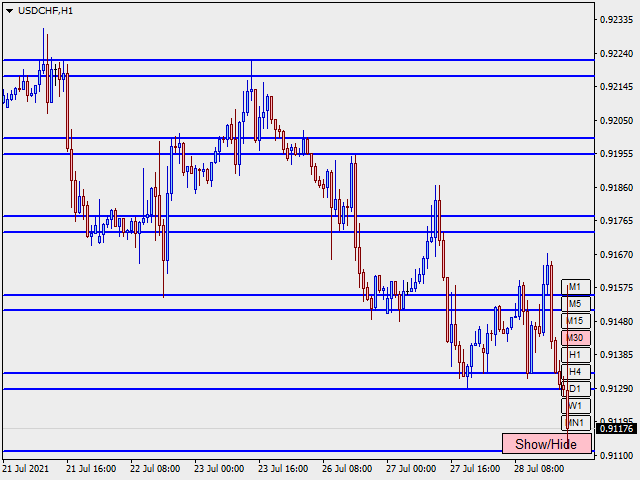
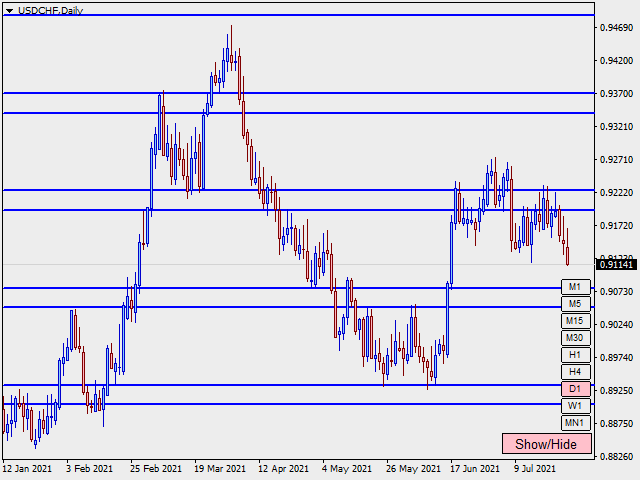
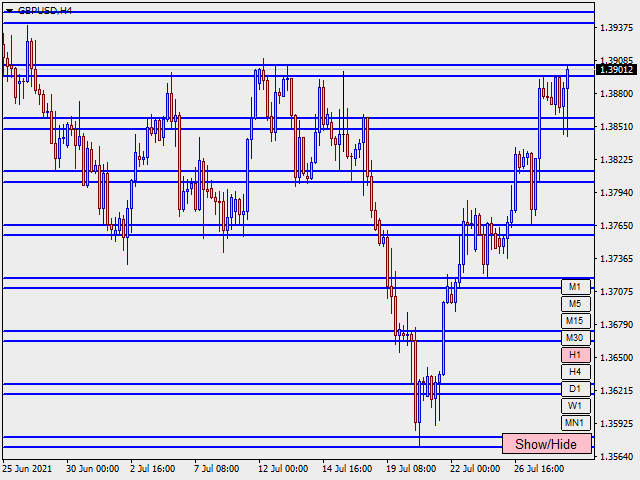
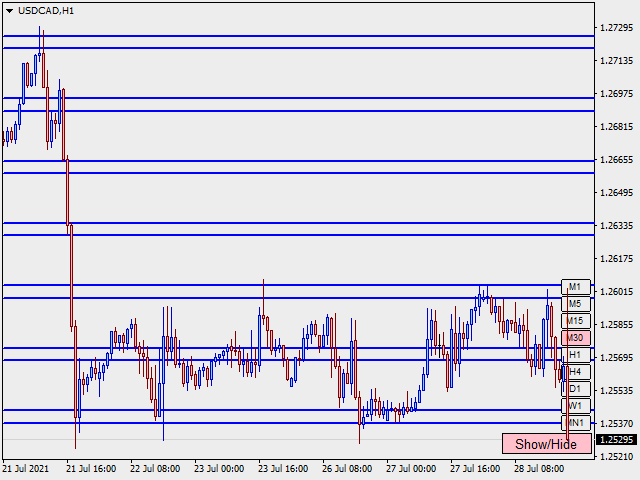
指标水平可用于交易本身,或作为一个组合来过滤其他策略/指标的错误信号。每个交易者都需要这样一个强大的工具,在图表上拥有多时间框架(TF)区域和价格运动的潜力。你可以在测试器模式下测试它的力量,看看它的水平如何支配图表上的价格。
指标的优势。
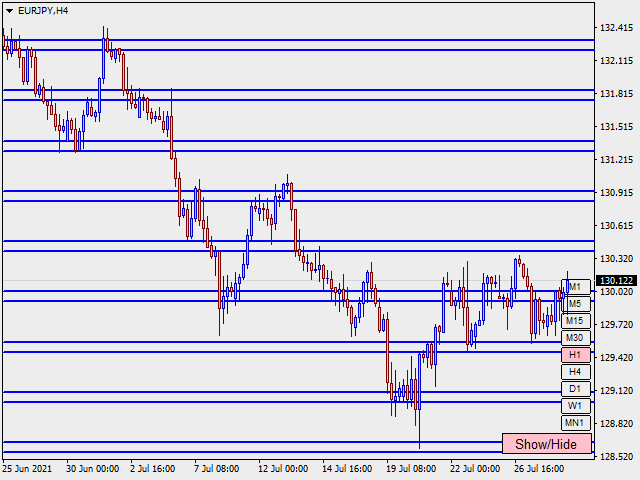
用两个不同的区域来标示图表,为不同的TFs指定趋势和范围市场。
价格行动交易者可以使用它来识别不同TFs/价格区的订单流,或验证FTR(失败返回)/FTC(失败继续)。
市场的波动区和流动区将出现在图表上,以便于未来的价格变动。
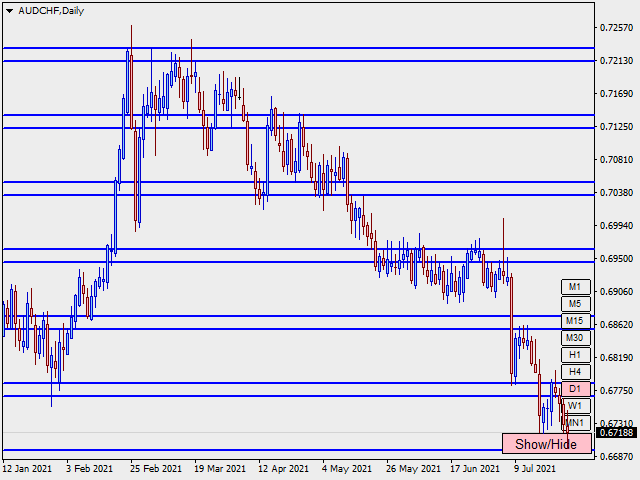
通过该指标,可以很容易地决定SL/TP、追踪、平衡和利润保存。
价格反转或延续可以很容易地被验证。
该指标的水平可以作为马丁格尔或网格水平使用,概率更高。