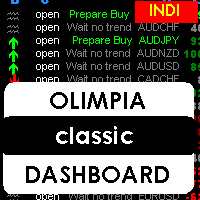
Olimpia Classic Dashboard
- 指标
- Robert Petters
- 版本: 1.5
- 更新: 26 九月 2024
- 激活: 5
This indicator is a multipairs dashboard which recognizes the best pair setup to open orders with 8 families of currencies. Families of currencies include: AUD, USD, EUR, GBP, CAD, NZD, CHF, JPY; 28 pairs in total. The precise moment to open an order is shown at Column A on the dashboard, you can also setup alerts, e-mails and notification to mobile devices. You can filter alerts by spread value of pairs.
What is the dashboard showing?
RED values mean short trends, GREEN values mean long trends
Explanation of Columns in Olimpia Classic Dashboard
- A: The precise moment to open an order:
- Wait EURUSD in Gray: means not a good moment to setup an order.
- Buy now EURUSD: means a good moment to open a buy ORDER in EURUSD pair.
- B: An ARROW appears when D1, H1 and M15 time frames have same trend direction in candle.
- C: 'Brake!' appears when the pair is oversold/overbought (Probably a price reversal zone).
- D: Prepare Buy or Sell message when H4, H1, M15, M5 have the same Moving Average bias (Exponential Moving Average crosses with 7 and 14 value).
- E: Trend Power percentage -- Best moment is between 60% and 80%. Very exclusive and secret Trend Power Percentage indicator uses MTF Multi indicator to know accurately trends directions for each pair and recognize the best moment to open a trade. More than 80% means the TREND has rolled a lot, probably its too late to enter a trade. Less than 60% means the trend is still not absolutely strong.
- F: Multi Time Frame shows green or red color when RSI, EMA and Candle trends are having same trend bias.
- G: Pairs turn blue when they are having a high volume moment: this column shows info or current M1 volume and compare with average value of last 120 minutes. Turns BLUE if current value is higher than average.
- H: Spread. Turns orange if values are higher than the minimum spread value.
Market Stats
- Trend Status shows a sum of 28 pairs trends and its average value.
- Reversal Zone is a sum of overbought/sold areas of 28 pairs and its average value.
- Currency Trends shows each currency group of 7 pairs, so green color means a long trend and red color means a short trend.
Indicator Parameters
- ShowColumnsInfo: true or false. Shows the info of columns values on one side.
- Spreadnum. Alerts only with pairs having less spread than the value.
- Enable messages. Alert popup, Email and/or notification.
- Trend Power: 50 (default). The perfect moment is 50% which means 75% or probability the trend will continue going to that direction with the pair, 90% is too late and less that 50% means that there is still not enough powerr.
- Market Trend status: 50 (default). More than 50% in Market Trends means that the market is having a good bias moment to open orders. Less than 50% the trends means that the market is very noisy, so it is not a good moment to open an order. You can disable this filter adding 0 value in properties.
- Difference Broker Time. You can compare the broker time to your local time to adjust this parameter (not important for indicator action).
Note
You don't have to worry in which TF or chart pair add the indicator. The indicator is programmed to use all included pairs (28). Its concept lays in recognition the best pair to have an alarm or visualize in the dashboard.
The indicator can NOT show history on charts because it's using real time values.
You can lose some or all of your initial investment even using this indicator; do not invest money that you cannot afford to lose. Educate yourself on the risks associated with foreign exchange trading before using this Olimpia Classic Dashboard!


