• 概述
  • 评论
  • 评论

Tablero de Cruces de MA

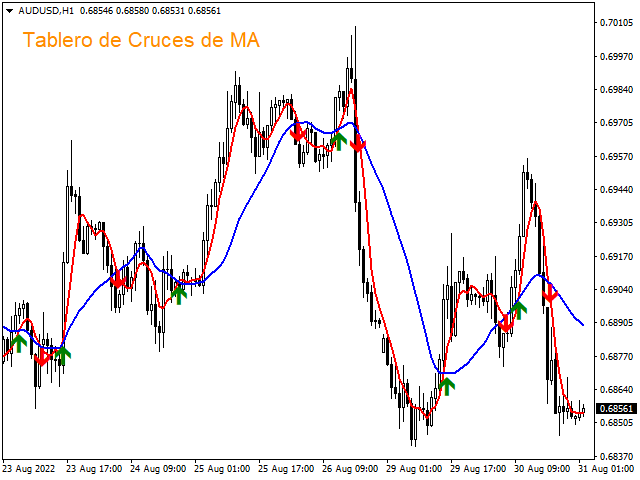
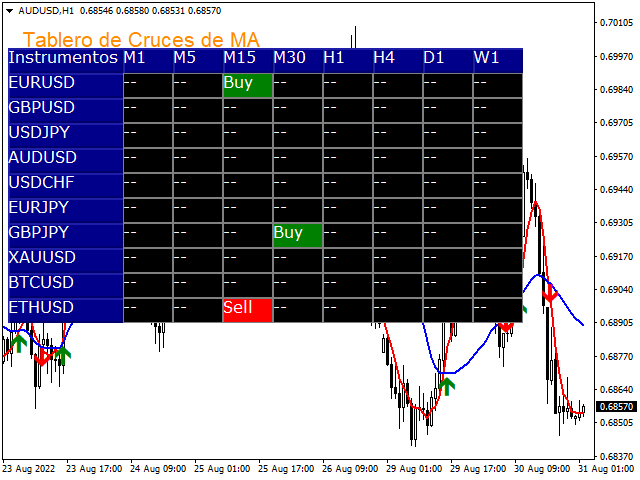
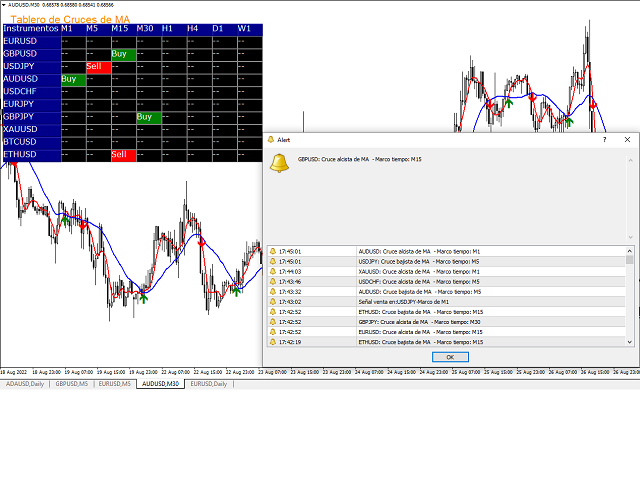
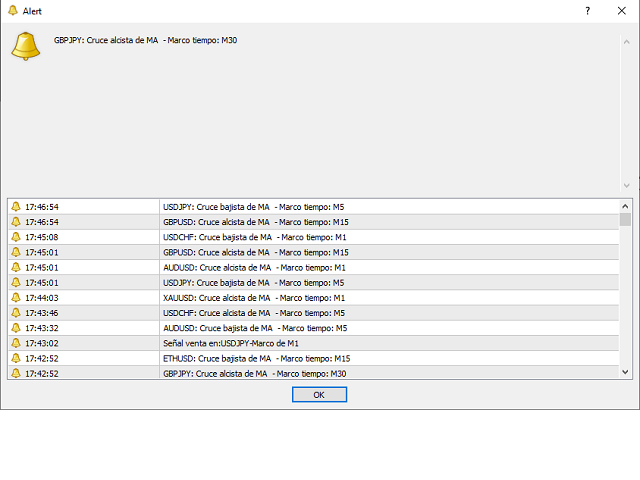
El indicador Tablero de Cruces de MA es un indicador que muestra los cruces de 2 medias móviles seleccionadas en el gráfico de precios indicando si se trata de un cruce alcista o bajista. Además, como su nombre lo indica, muestra un tablero de señales que indica en que mercado y marco de tiempo se produce un cruce de las dos medias móviles. En la ventana de configuración el usuario puede seleccionar los mercados y marcos de tiempo que puede visualizar en el tablero. También tiene la opción de activar una ventana de alertas que indica junto con una alerta sonora cuando ocurre un cruce de las medias móviles, en que par y en que marco de tiempo. 

Su principal ventaja es que permite vigilar múltiples mercados al mismo tiempo desde una sola ventana, en busca de posibles cruces de MA. Por ejemplo, el trader puede buscar un cruce dorado (cruce de la SMA 50 con la SMA 200) en todos los pares de divisas que sigue mediante el tablero. 

Es posible elegir entre los 4 tipos de medias móviles que ofrece MT4 en la actualidad: Simple, Exponencial, Suavizada y Ponderada Lineal.

También existe la posibilidad de calcular las medias móviles con base en distintos tipos de precios: Cierre, Apertura, Máximo, Mínimo, Típico, Mediano y Ponderado.

Finalmente, el indicador ofrece la opción de que las señales de cruces en el tablero y la ventana de alertas no se muestren a menos que sean confirmadas por la siguiente candela y/o el indicador ADX.

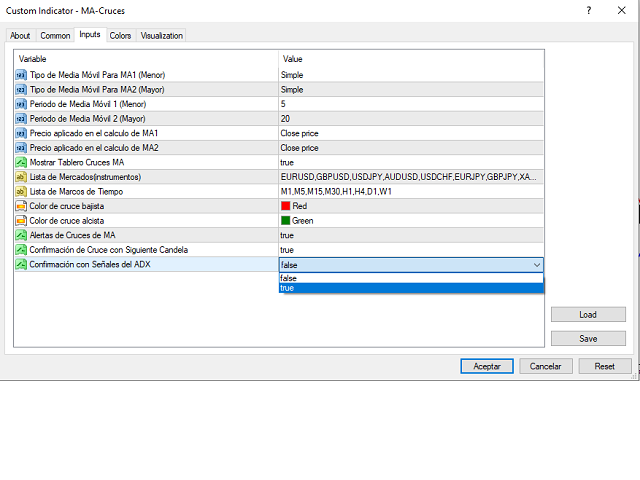
Los parámetros que pueden ser configurados en el Tablero de Cruces de MA son los siguientes:

  • Tipo de Media Móvil Para MA1 (Menor): Es el tipo de media móvil de la MA de corto plazo.
  • Tipo de Media Móvil Para MA2 (Mayor): Es el tipo de media móvil de la MA de largo plazo.
  • Periodo de Media Móvil 1 (Menor): Es el periodo de cálculo de la MA de corto plazo.
  • Periodo de Media Móvil 2 (Mayor): Es el periodo de cálculo de la MA de largo plazo.
  • Precio aplicado en el calculo de MA1: Es el tipo de precio aplicado en el cálculo de la MA de corto plazo ( Cierre, Apertura, Máximo, Mínimo, Típico, Mediano o Ponderado).
  • Precio aplicado en el calculo de MA2: Es el tipo de precio aplicado en el cálculo de la MA de largo plazo ( Cierre, Apertura, Máximo, Mínimo, Típico, Mediano o Ponderado).
  • Mostrar Tablero Cruces MA: Permite indicar si queremos visualizar o no el tablero de señales.
  • Mercados: Aquí el trader indica los mercados o pares de divisas en que desea detectar los cruces de MA. Se pueden agregar tantos pares como ofrezca el broker en la plataforma. Por defecto, el indicador muestra los pares EURUSD, GBPUSD, USDJPY y AUDUSD.
  • Lista de Marcos tiempo: En este parámetro podemos indicar en que marcos de tiempo queremos detectar cruces de MA para cada par de divisas. Podemos agregar todos los marcos de tiempo que ofrece MT4. Por defecto, el indicador muestra los marcos M5, M15, M30, H1, H4, D1 y W1.
  • Color de cruce bajista: Nos permite indicar el color para los cruces bajistas de MA  
  • Color de cruce alcista:  Nos permite indicar el color para los cruces alcistas de MA  
  • Alertas de Cruces de MA: Esta opción permite indicar si queremos que el indicador muestre una ventana de alertas
  • Confirmación de Cruce con Siguiente Candela: Permite indicar si queremos que los cruces de MA sean confirmados por la siguiente candela.
  • Confirmación con Señales del ADX: Permite indicar si queremos que los cruces de MA sean confirmados por el indicador de fuerza de la tendencia ADX (ADX>25).
Por si solo, no debe usarse como un sistema de trading dado que las señales de cruces de medias móviles no son 100% fiables, como ocurre con todo indicador técnico, pero es una herramienta de apoyo útil.


推荐产品
Max LotSize
Luis Alberto Atuncar Sanchez
5 (2)
LotSize Indicator Discover the appropriate lot size to use in your trades based on the available margin. This indicator provides valuable information for risk management. If the indicator shows a value of 0, it means that your balance or available margin is insufficient for trading. It is important to maintain adequate margin levels for safe trading practices. This indicator is exclusively designed for the MT4 platform, a popular and reliable trading platform in the market. With the LotSize Indi
FREE
Trend Catcher with Alert
Issam Kassas
4.71 (51)
趋势捕捉器: 具有警示指标的趋势捕捉器策略是一种多功能的技术分析工具,可帮助交易员识别市场趋势和潜在的进出点。它采用动态趋势捕捉器策略,根据市场条件进行调整,清晰地呈现趋势方向。交易员可以自定义参数,以符合其偏好和风险容忍度。该指标有助于识别趋势,发出潜在的反转信号,充当跟踪止损机制,并提供实时警报,以便及时应对市场。 具有警示指标的趋势捕捉器策略是一种多功能的技术分析工具,可帮助交易员识别市场趋势和潜在的进出点。它采用动态趋势捕捉器策略,根据市场条件进行调整,清晰地呈现趋势方向。交易员可以自定义参数,以符合其偏好和风险容忍度。该指标有助于识别趋势,发出潜在的反转信号,充当跟踪止损机制,并提供实时警报,以便及时应对市场。 特点: 趋势识别:信号牛市趋势和熊市趋势。 趋势反转:当蜡烛颜色从牛市变为熊市,反之亦然时,提醒可能的反转。 实时警报:为新趋势识别生成警报。 建议: 货币和货币对:EURUSD,AUDUSD,XAUUSD... 时间框架:H1。 账户类型:任何ECN,低点差账户。
FREE
Market Profile 3
Hussien Abdeltwab Hussien Ryad
3 (2)
Market Profile 3 MetaTrader 4 indicator  — is a classic Market Profile implementation that can show the price density over time, outlining the most important price levels, value area, and control value of a given trading session. This indicator can be attached to timeframes between M1 and D1 and will show the Market Profile for daily, weekly, monthly, or even intraday sessions. Lower timeframes offer higher precision. Higher timeframes are recommended for better visibility. It is also possible t
FREE
Candle EA MT4
Mansour Babasafary
4.43 (49)
This expert is based on patterns The main patterns of this specialist are candlestick patterns Detects trends with candlestick patterns It has a profit limit and a loss limit, so it has a low risk The best time frame to use this expert is M30 time frame The best currency pairs to use with this expert is the EURUSD, GBPUSD, AUDUSD, USDCAD currency pairs Attributes: Can be used in the EURUSD, GBPUSD, AUDUSD, USDCAD  currency pairs Can be used in M30, H1, H4 time frames Has profit limit an
Add indicator "Symbol Name Drawer " on chart. Indicator creates text object with name of current symbol. You can change symbols on chart and indicator automatically changes text. Free to use. Simple tool. If you have any suggestion you can write me about it in comments. I try to improve this tool in future versions. Thanks for using my indicator. If you want to order something special in mql4 or mql5 message.
FREE
MarketProfile EForex
Veridiana Adorno Kendrick
Market Profile Shows where the price has spent more time, highlighting important levels that can be used in trading. It is a powerful tool which is designed to take the fundamental components which comprise every market; price/volume/time, and visually display their relationship in real-time as the market develops for a pre-determined time period. Very powerful tool!
MASi Three Screens
Aleksey Terentev
5 (2)
MASi Three Screens is based on the trading strategy by Dr. Alexander Elder. This indicator is a collection of algorithms. Algorithms are based on the analysis of charts of several timeframes. You can apply any of the provided algorithms. List of versions of algorithms:     ThreeScreens v1.0 - A simple implementation, with analysis of the MACD line;     ThreeScreens v1.1 - A simple implementation, with analysis of the MACD histogram;     ThreeScreens v1.2 - Combines the first two algorithms
FREE
The   Volume Weighted ATR indicator   is a helpful tool for measuring market activity. It is based on the idea of the Volume-Weighted ATR. Combining these two elements helps identify potential turning points or breakout opportunities. The indicator for the classification of the activity of the market uses the moving average and its multiples. Accordingly, where the VWATR bar is located (relative to the moving average), it is labelled as ultra-low, low, average, high, very high or ultra high. Th
FREE
nrp vertex g indicator is no repaint vertex indicator. it works all time frame and all pairs. working princible is wery easy and can use beginners. when histogram up side and there is a white star on it that is buy signal.. and reverse signal sell comes when histogram below zero and white star on it.that is sell signal. indicator hold long time to signal.and it is not neccesary to stay on computer. minimum bar number is 500 bars on chart to work of it. and the cnt nr is minimum 500 can be. but p
Silver Bullet MT4
Saksham Solanki
Contact me for any queries or custom orders, if you want to use this in an EA. Key Features: Pattern Recognition : Identifies Fair Value Gaps (FVGs) Spots Break of Structure (BOS) points Detects Change of Character (CHoCH) patterns Versatile Application : Optimized for candlestick charts Compatible with any chart type and financial instrument Real-Time and Historical Analysis : Works seamlessly with both real-time and historical data Allows for backtesting strategies and live market analysis V
FREE
FRM Half Trend
Noiros Tech
5 (1)
YOU CAN NOW DOWNLOAD FREE VERSIONS OF OUR PAID INDICATORS . IT'S OUR WAY OF GIVING BACK TO THE COMMUNITY ! >>>    GO HERE TO DOWNLOAD   The system is a free open source pine script originally published on TradingView by everget   . It was converted to Mt4 by Forex Robot Makers. This system is a  popular trend indicator based on ATR ( Average True Range ) , Moving Averages and the Donchian channel . System BackGround ATR The average true range is an indicator of the price volatility of an as
FREE
Fibonacci SR Indicator
Martin Eshleman
3 (2)
菲波纳奇支撑阻力指标 本指标创建支撑和阻力线。此指标基于菲波纳奇回撤和扩展级别。它会考虑菲波纳奇级别的多种组合,并在这些基础上绘制支撑/阻力线。此指标使用的顶部和底部由之字折线指标计算而来。如有必要,之字折线也可以在图表上绘制。 本指标考虑许多过去的反转点和菲波纳奇比率级别的组合,而当它看到多条线在相同的价格汇合,那么这将成为指标绘制的支撑/阻力线。未来的市场反转往往会正好出现在这些线附近。这是一个自动指标。所以,旧线将被删除,新线将随着市场的进步而绘制。 设置 Bars_Back - 向后一定数量的柱线用于所有计算。数量较少则较少反转点将被使用,因此,绘制的支撑和阻力线较少。向后更多柱线则有更多反转点将被使用,因此,绘制的支撑和阻力线较多。  Buffer_Space - 这表示每个已计算的菲波纳奇级别所需的汇合之间的最大点数。该数值越高,则确切的汇合必须越少。数字越低,则精确汇合必须更多,因此有较高的可靠性。例如, 让我们设为 10 点, 且指标运行在非分形的 4-位报价经纪商 (同样是 10 点)。此指标看到 3 个 菲波纳奇 回撤级别,分别在 1.4995, 1.5000,
FREE
Lisek Weis Wave
Darius Hans Lischka
5 (3)
This Weis Wave Volume indicator is a tool to help traders identify the current price trend.  Understanding volume can provide insight into a market's behavior to help you determine its overall health. The most important rule is this: volume precedes price. Typically, before a market price moves, volume comes into play. It has 2 main colors histogram which are green and red. – Green indicates an upward wave. The more the price increases, the bigger the green volume gets. – The red color shows a d
FREE
Trade History for MT4  This indicator is specially developed for that traders want to display his trades on the charts. Shows history and current deals on the chart. Trades show on the chart with a dotted line, and profit will show realtime. Buy trades are displayed in bull color, Sell trades in bear color. Tip: The historical order displayed by the indicator is associated with the "Account History", so please set the historical order display in the "Account History" of MT software. If yo
FREE
Wicks UpDown Target GJ Wicks UpDown Target GJ is specialized in GJ forex pairs. Choppy movement up and down on the opening range every day.  Trading breakouts on London session and New York session is recommended. Guideline Entry Strategy Idea: Step 1 - Breakout Forming (Warning! Trade on London Session and New York Session) Step 2 - Breakout Starting (Take Action on your trading plan) Step 3 - Partial Close your order & set breakeven (no-risk) Step 4 - Target complete Step 5 - Don't tr
FREE
VR Money Flow Free
Kenneth Parling
4.5 (2)
Introduction Virtual Money Flow free - Lightweight free trading robot based on Money Flow index. Orders set with ISL and take profit is virtual. Equipped with trailing stop and limited money management. How to? Any account type,leverage and time frame Works only on currency pair   EURUSD, optimizations needed in regualar intervals You can start with as low as   $20-50   based on leverage   500 This is  not  a   scalper and trades can therefore be less frequent, be patient! Limited contract size
FREE
Pin Bars
Yury Emeliyanov
5 (3)
主要用途:"Pin Bars"旨在自动检测金融市场图表上的pin bars。 针杆是具有特征主体和长尾的蜡烛,可以发出趋势反转或修正的信号。 它是如何工作的:指标分析图表上的每个蜡烛,确定蜡烛的身体,尾巴和鼻子的大小。 当检测到与预定义参数相对应的引脚柱时,指示器会根据引脚柱的方向(看涨或看跌)在图表上用向上或向下箭头标记它。 参数: TailToBodyRatio-定义尾部长度和针杆主体尺寸之间的最小比率。 NoseToTailRatio-设置"鼻子"和销杆尾部之间的最大允许比率。 ArrowSize-定义标记的pin条与图表上指向它的箭头之间的距离。 应用:"Pin Bars"指标可用于识别潜在的趋势反转点,并产生进入市场或平仓的信号。 当正确使用并与其他技术指标和分析方法相结合时,该指标能够改善交易结果。 其他产品 :   https://www.mql5.com/ru/users/yura1994ru/seller#products 重要事项: 该指标不是一个现成的交易系统,应该与其他分析工具结合使用。 建议在真实账户上使用指标之前,先在历史数据上测试和优化指标的参数
FREE
枢轴点斐波那契 RSJ 是一个指标,它使用斐波那契汇率追踪当天的支撑线和阻力线。 这个壮观的指标使用斐波那契汇率通过枢轴点创建多达 7 个支撑位和阻力位。 价格如何尊重该支撑和阻力的每个水平真是太棒了,在那里可以感知操作的可能进入/退出点。 特征 多达 7 个支撑位和 7 个阻力位 单独设置级别的颜色 输入 枢轴类型 Pivot Fibo RSJ1 = Fibo ratio 1 计算 Pivot Fibo RSJ2 = Fibo ratio 2 计算 Pivot Fibo RSJ3 = Fibo ratio 3 计算 Pivot Fibo Classic = 经典枢轴计算 最低枢轴级别 旋转 3 个级别 旋转 4 个级别 旋转 5 个级别 枢轴 6 个级别 旋转 7 个级别 如果您仍有疑问,请通过直接消息与我联系: https://www.mql5.com/zh/users/robsjunqueira/
FREE
Highlights trading sessions on the chart The demo version only works on the AUDNZD chart!!! The full version of the product is available at: (*** to be added ***) Trading Session Indicator displays the starts and ends of four trading sessions: Pacific, Asian, European and American. the ability to customize the start/end of sessions; the ability to display only selected sessions; works on M1-H2 timeframes; The following parameters can be configured in the indicator: TIME_CORRECTION = Cor
FREE
Bomb Scalper
Andrey Kozak
Bomb Scalper is a ready-made mechanical trading system that analyzes the market using 12 market signals, as well as candle patterns, providing signals for opening and closing trades. On the screenshot below, you can see how the system draws the blue arrow for buying and the red one for selling. Order close signal is shown as the yellow arrow. Besides, during a closing signal, the indicator calculates potential profit/loss. How the indicator works After launching, Bomb Scalper navigates through
Forex Market Profile and Vwap
Lorentzos Roussos
5 (5)
外汇市场概况(简称FMP) 如果您希望在实时图表上看到它而不是阅读描述, 您可以立即在此处下载免费演示。 这不是什么: FMP 不是经典的字母编码 TPO 显示,不显示整体图表数据配置文件计算,并且不将图表分段并计算它们。 它能做什么 : 最重要的是,FMP 指示器将处理位于用户定义频谱左边缘和用户定义频谱右边缘之间的数据。 用户只需用鼠标拉动指示器的每一端即可定义频谱。 当指标右边缘被拉到实时柱并进一步(到未来)时,指标被认为是“实时的”(它会更新新柱) 该指标将一个“锚点”对象放在它所附加的图表上,然后将该锚点与硬盘驱动器上的文件相关联。 这允许您在图表上运行一个持续的 FMP,您的设置在重新启动时持续存在,直到图表 - 或指标 - 关闭。 FMP 指标可以在一个图表上运行多个自身实例,并且您可以命名它们。(名称在指标数据中显示为半透明,以便您能够区分它们) 指标的数据窗口被快速切换控件包围,当它们的状态发生变化时,这些控件会更新该图表的指标设置的“内存”。 左手柄、右手柄和数据窗口的显示可以自定义。您可以从 13 种不同的样式组合中进行选择,或者选择每个部分的单
FREE
Reversal Monster Mini
Abdulfattah Yahya Mohammed Alhazmi
The Most advanced and comprehensive EA to trade Trend Reversals/Pullbacks It is a very profitable EA, to trade trends breakout, and manage trades, takeprofit, stoploss, move to breakeven, and trailing stop. The   “Reversal Monster EA”   trades Reversal/Pullbacks when the current price of the pair pullback to a predefined horizontal level or trendline on the currency chart. The opening of the position can be immediate after pullback to the drawn trendline or after closing the candle below/abov
FREE
King Grid
Luis Mariano Vazquez Marcos
King Gold Grid Presentamos con orgullo el revolucionario Asesor Experto de Sistema Grid, una obra maestra creada por  Mr Beast. Este excepcional producto se distingue como uno de los mejores en su categoría, destacando por su magnífica gestión de riesgos y especialización en el trabajo con el oro. Diseñado meticulosamente para optimizar la eficiencia y maximizar los beneficios, este asesor experto se erige como un líder indiscutible en el mundo de los sistemas de rejilla. Su capacidad para adapt
IceFX TradeInfo
Norbert Mereg
4.76 (41)
IceFX 的 TradeInfo 是一款工具指标,显示当前账户和持仓的重要信息。 显示信息: 有关当前账户的信息 (结余, 净值, 可用保证金)。 当前点差, 当前回撤 (DD), 计划利润, 预计亏损, 等等。 开仓数量, 交易量 (手数), 盈利。 今日和昨日的范围。 距下一根柱线的剩余时间。 最后一日的盈利信息 (与 IceFX ProfitInfo 指标集成)。 风险- 基于开新仓的手数信息。 MagicNumber 过滤器。 注释过滤器。
FREE
Ppr PA
Yury Emeliyanov
4.5 (2)
"Ppr PA" is a unique technical indicator created to identify "PPR" patterns on the currency charts of the MT4 trading platform. These patterns can indicate possible reversals or continuation of the trend, providing traders with valuable signals to enter the market. Features: Automatic PPR Detection:   The indicator automatically identifies and marks PPR patterns with arrows on the chart. Visual Signals:   Green and red arrows indicate the optimal points for buying and selling, respectively. A
FREE
Mr Beast Trade Assistant
Luis Mariano Vazquez Marcos
MRBEAST Assistant El   indicador MR BEAST Assistant para MetaTrader   es un indicador multitemporal que se basa en tres indicadores estándar: el   oscilador estocástico, el   RSI   (Índice de Fuerza Relativa) y el   CCI   (Commodity Channel Index). Muestra las direcciones de la tendencia actual para los marcos temporales M1, M5, M15, M30, H1, H4, D1, W1 y MN1. Cuando se sigue un indicador de este tipo se tiene una visión clara de las tendencias en todos los marcos temporales importantes. No imp
FREE
EA Scalping Expert
Gerard Valldosera Gomez
3 (1)
This is a fully automated scalping Expert Advisor that can be run successfully using EURUSD currency pair at H1 timeframe. This EA can't run in the same account. If you want an Expert Advisor that trades daily this is not because it requires patience to wait for a few days or weeks on the right opportunity for it to trade. It takes advantage of the volatility of the price movement.
FREE
History Pattern Search
Yevhenii Levchenko
该指标建立当前报价,可以与历史报价进行比较,并在此基础上进行价格走势预测。指示器有一个文本字段,用于快速导航到所需日期。 选项: 符号 - 选择指标将显示的符号; SymbolPeriod - 选择指标从中获取数据的时段; IndicatorColor - 指示器颜色; HorisontalShift - 由指标绘制的报价移动指定的柱数; Inverse - true 反转引号,false - 原始视图; ChartVerticalShiftStep - 图表垂直移动(键盘上的向上/向下箭头); 接下来是文本字段的设置,您可以在其中输入日期,您可以通过按“回车”立即跳转到该日期。 接下来是文本字段的设置,您可以在其中输入日期,您可以通过按“回车”立即跳转到该日期。
Scalping Binary Option Pro is an arrow indicator that is completely free from repainting . Although it may work incorrectly in strategy testers, its signals remain relevant for real trading. Signals: A red arrow pointing down indicates a selling opportunity, while a green arrow pointing up indicates a buying opportunity. Settings: All you need to adjust are the colors of the signal arrows and the sound alert for signal notifications. Usage Recommendations: It is best to use the indicator on hig
TrendPlus
Sivakumar Subbaiya
4.08 (12)
Trend Plus   Trendplus  Indicator   Time Frame: Suitable for any time frame.  Purpose: Trend Prediction. Blue and red candle indicate the buy and sell call respectively. Buy: When the blue candle is formed buy call is initiated. close the buy trades when the next red candle will formed.   Sell: When the Red candle is formed Sell call is initiated. close the Sell trades when the next blue candle will formed.   Happy trade!!
FREE
该产品的买家也购买
Gann Made Easy
Oleg Rodin
4.85 (82)
Gann Made Easy 是一个专业且易于使用的外汇交易系统,它基于使用先生理论的最佳交易原则。 W.D.江恩。该指标提供准确的买入和卖出信号,包括止损和获利水平。您甚至可以使用推送通知在旅途中进行交易。 购买后请联系我!我将免费与您分享我的交易技巧和丰厚的红利指标! 您可能已经多次听说过江恩交易方法。通常 Gann 的理论不仅对于新手交易者而且对于那些已经有一定交易经验的人来说都是非常复杂的东西。这是因为江恩的交易方法在理论上并不那么容易应用。我花了几年时间来完善这些知识,并将最好的原则应用到我的外汇指标中。 该指标非常易于应用。您所需要的只是将其附加到您的图表并遵循简单的交易建议。该指标不断进行市场分析工作并寻找交易机会。当它检测到一个好的入口点时,它会为您提供一个箭头信号。该指标还显示止损和获利水平。 换句话说,当您像先生一样进行交易时,该指标会为您提供最佳江恩建议。江恩亲自告诉你此时此刻该做什么。但最好的部分是您不需要了解任何有关江恩交易原则的知识,因为该指标会为您完成整个市场分析工作。
- Real price is 80$ - 40% Discount ( It is 49$ now ) Contact me for instruction, add group and any questions! Related Product:  Bitcoin Expert , Gold Expert Introduction The breakout and retest strategy is traded support and resistance levels. it involves price breaking through a previous level.  The break and retest strategy is designed to help traders do two main things, the first is to avoid false breakouts. Many false breakouts start with a candlestick that breaks out of a level but ends wi
Atomic Analyst
Issam Kassas
5 (2)
首先值得强调的是,该交易指标是非重绘、非延迟的指标,这使其成为手动和机器人交易的理想选择。 用户手册:设置、输入和策略。 Atomic Analyst是一种PA价格行动指标,利用价格的力量和动量来寻找市场上更好的机会。配备了高级过滤器,可帮助去除噪音和假信号,并提高交易潜力。使用多层复杂的指标,Atomic Analyst扫描图表,并将复杂的数学计算转化为任何初学者都能理解并用来做出一致交易决策的简单信号和颜色。 “Atomic Analyst”是专为新手和经验丰富的交易者量身定制的综合交易解决方案。它将高级指标和一流功能融合为一体的交易策略,使其成为所有类型交易者的多功能选择。 日内交易和剥头皮策略:专为快速准确的日内交易和短期交易而设计。 日内和摆动交易策略:可用作追求价格大幅波动的日内和摆动交易者的可靠工具。 多货币和市场:凭借其可靠的精度,在不同的工具和市场上运作。 多个时间框架:可在多个时间框架上使用,性能良好。 稳定性:所有指标均不重绘、不重绘和不滞后,确保可靠的信号。 信号清晰度:提供箭头信号,用于清晰的入场和出场点。 实时警报:通过交易入场、SL和TP警报通知交
Scalper Inside PRO
Alexey Minkov
4.73 (56)
An exclusive indicator that utilizes an innovative algorithm to swiftly and accurately determine the market trend. The indicator automatically calculates opening, closing, and profit levels, providing detailed trading statistics. With these features, you can choose the most appropriate trading instrument for the current market conditions. Additionally, you can easily integrate your own arrow indicators into Scalper Inside Pro to quickly evaluate their statistics and profitability. Scalper Inside
TPSproTREND PrO
Roman Podpora
4.79 (19)
TPSpro TREND PRO 是一个趋势指标,可以自动分析市场并提供有关趋势及其每次变化的信息,并给出进入交易的信号而无需重新绘制! 该指标使用每根蜡烛,分别对其进行分析。指不同的脉冲——向上或向下脉冲。货币、加密货币、金属、股票、指数交易的准确切入点! MT5版本                 指标的完整描述   我们建议将其与 指示器 -   RFI LEVELS 一起使用 主要功能: 准确的输入信号,无需渲染! 如果出现信号,它仍然相关!这是与重提指标的一个重要区别,重提指标可以提供信号然后改变信号,这可能导致存款资金的损失。现在您可以以更高的概率和准确度进入市场。还有一个功能是在箭头出现后为蜡烛着色,直到达到目标(止盈)或出现反转信号。 显示止损/获利区域 为了提高搜索切入点时的视觉清晰度,创建了一个模块,该模块最初显示买入/卖出区域,在该区域中搜索进入市场的最佳点。用于处理止损水平的附加智能逻辑有助于随着时间的推移减小其大小,从而降低进入交易(移动 sl)时的初始风险。 显示较高时间范围内的最小值/最大值(MTF 模式) 添加了一项功能,可以显示较高时间间隔的最小
Gold Stuff
Vasiliy Strukov
4.89 (239)
Gold Stuff 是专为黄金设计的趋势指标,也可用于任何金融工具。 该指标不会重绘,也不会滞后。 推荐时间框架 H1。 在它指标工作全自动专家顾问 EA Gold Stuff。 你可以在我的个人资料中找到它。 重要! 购买后立即与我联系,以获得说明和奖金!   您可以免费收到我们的强力支持和趋势扫描指标的副本,请私信。大部头书! 购买后立即联系我以获得设置和个人奖励!   设置 绘制箭头 - 打开关闭。 在图表上绘制箭头。 警报 - 打开关闭声音警报。 电子邮件通知 - 打开关闭。 电子邮件通知。 Puch-notification - 打开关闭。 推送通知。 接下来,调整色域。 Gold Stuff 是专为黄金设计的趋势指标,也可用于任何金融工具。 该指标不会重绘,也不会滞后。 推荐时间框架 H1。 在它指标工作全自动专家顾问 EA Gold Stuff。 你可以在我的个人资料中找到它。 购买后立即联系我以获得设置和个人奖励!   设置 绘制箭头 - 打开关闭。 在图表上绘制箭头。 警报 - 打开关闭声音警报。 电子邮件通知 - 打开关闭。 电子邮件通
FX Volume
Daniel Stein
4.58 (33)
通过 mql5 和 Telegram 上 的 " 晨间简报 "获取每日市场更新,包括详细信息和屏幕截图 ! 外汇交易量(FX Volume)是第一个也是唯一一个从经纪商角度真正洞察市场情绪的交易量指标。 直接在您的图表上看到这些信息是真正改变游戏规则和突破性的交易解决方案。 受益于独特的市场数据洞察,如 比率(Ratios )显示货币多头和空头头寸的比率(百分比 比率变化 显示所选时间段内的多头比率及其百分比变化 总交易量 显示货币的总交易量(多头和空头),以手为单位 多头 交易量显示货币所有多头头寸的交易量 空头 交易量显示所有货币空头头寸的交易量 净多头 显示净多头交易量,即所有多头头寸减去所有空头头寸(以手为单位)。 净多头百分比 显示货币净多头交易量的变化 请阅读我们的基本教程 -> "如何使用外汇交易量进行交易 " 获取更多信息,如常见问题、交易技巧和教程视频,请访问我们的 外汇交易量公共信息频道 请 安装并运行 SI Connect 以建立与我们数据中心的持续连接 背景信息 我们都知道,外汇是一个分散的市场。这就是为什么我们必须打破常规思维,开发一个独
目前八折优惠! 对任何新手或专家交易者来说都是最好的解决方案! 这个仪表板软件适用于28种货币对。它基于我们的两个主要指标(高级货币强度28和高级货币冲动)。它对整个外汇市场提供了一个伟大的概述。它显示高级货币强度值,货币运动速度和28个外汇对在所有(9)时间段的信号。想象一下,当你可以使用图表上的单一指标观察整个市场,以确定趋势和或剥头皮的机会时,你的交易将得到改善 我们已经在这个指标中建立了一些功能,使你更容易识别强势和弱势货币,同时识别和确认潜在的交易。该指标以图形方式显示货币的强势或弱势是增加还是减少,以及它在所有时间段的表现。 增加的新功能是动态市场斐波那契水平,它适应当前的市场条件变化,这是一个已经在我们的高级货币强度28和高级货币冲动指标中使用的成熟的加分项。 在交易时,总是将弱势货币和强势货币配对,这个新指标将帮助你做到这一点。 用户手册:点击这里  https://www.mql5.com/en/blogs/post/708783 特点  显示每个时间段的ACS28和GAP-speed(冲动)的货币强度值。 列:颜色代码以7种颜色
Trend Punch
Mohamed Hassan
4.95 (19)
This indicator is unstoppable when combined with our other indicator called  Support & Resistance . After purchase, send us a message and you will get it   for  FREE as a BONUS! Introducing Trend Punch , the revolutionary forex trend indicator that will transform the way you trade! Trend Punch is uniquely designed to provide precise buy and sell arrows during strong market trends, making your trading decisions clearer and more confident. Whether you're trading major currency pairs or exotic sym
Trend Screener
STE S.S.COMPANY
4.8 (87)
趋势指标,趋势交易和过滤的突破性独特解决方案,所有重要趋势功能都内置在一个工具中! 它是 100% 非重绘多时间框架和多货币指标,可用于所有符号/工具:外汇、商品、加密货币、指数、股票。 限时优惠:支撑和阻力筛选指标仅售 50美元,终身有效。(原价 250 美元)(优惠延长) 趋势筛选器是有效的指标趋势跟踪指标,它在图表中提供带有点的箭头趋势信号。 趋势分析器指标中可用的功能: 1.趋势扫描仪。 2. 具有最大利润分析的趋势线。 3.趋势货币强度计。 4. 带有警报的趋势反转点。 5. 带有警报的强趋势点。 6. 趋势箭头 每日分析示例,每日信号表现...等与我们的趋势筛选指标,可以在这里找到: 点击这里 限时优惠:Trend Screener Indicator 仅售 50 美元且终身可用。原价 125$) 通过访问我们的 MQL5 博客,您可以找到我们所有的高级指标以及分析示例、每日信号表现...等。 : 点击这里 我们的趋势系统由 2 个指标组成: 1. Trend Screener Indicator:显示趋势仪表盘、图表中的趋势线、入场点...等。 2.
FX Power MT4 NG
Daniel Stein
5 (13)
通过 mql5 和 Telegram 上 的晨间简报获取每日市场更新,包括详细信息和屏幕截图 ! FX Power MT4 NG 是我们长期以来非常受欢迎的货币强度计算器 FX Power 的下一代产品。 这款下一代强度计算器能提供什么?您所喜爱的原版 FX Power 的所有功能 附加功能 黄金/XAU 强度分析 更精确的计算结果 可单独配置的分析周期 可自定义计算限制,以获得更好的性能 为希望查看更多信息的用户提供特殊的多实例设置 无尽的图形设置,可在每个图表中设置您最喜欢的颜色 无数的通知选项,让您再也不会错过任何重要信息 采用 Windows 11 和 macOS 风格的全新圆角设计 神奇的移动指标面板 FX Power 主要功能 所有主要货币的完整强势历史 所有时间框架内的货币强弱历史 所有经纪商和图表的计算结果完全相同 100% 可靠的实时计算 -> 无重绘 可通过下拉列表选择分析时段 通过自定义模式单独配置分析时段 可在一个图表中使用多个实例 可移动 FX Power 显示屏(通过拖放) 适用于高分辨率 QHD、UHD 和 4K 显示器 自动终端配置 针对平板电脑
Dynamic Forex28 Navigator - 下一代外汇交易工具。 当前 49% 折扣。 Dynamic Forex28 Navigator 是我们长期流行的指标的演变,将三种功能合二为一: 高级货币强度 28 指标 (695 条评论)+ 高级货币 IMPULSE 带警报 (520 条评论)+ CS28 组合信号(奖励)。 有关指标的详细信息 https://www.mql5.com/en/blogs/post/758844 下一代强度指标提供什么? 您喜欢的原始指标的一切,现在通过新功能和更高的精度进行了增强。 主要特点: 专有货币强度公式。  所有时间范围内的平滑和准确的强度线。 非常适合识别趋势和精确进入。 动态市场斐波那契水平(市场斐波那契)。  此指标独有的独特功能。 斐波那契应用于货币强度,而不是价格图表。 适应实时市场活动以获得准确的反转区域。 实时市场动量。  第 9 行显示市场是活跃还是被动。 对于定时交易至关重要。 全面的警报和显示。  每种货币最强的买入和卖出动量。 ​​28 对的双重动量买入和卖出。 超买/超卖警告外部范围
TPSpro RFI Levels
Roman Podpora
4.82 (22)
指示       俄罗斯 -        英语   建议 与指示器一起使用     -       TPSpro 趋势专业版 -   MT4版本       交易中的一个关键要素是做出买卖交易工具决定的区域或水平。尽管主要参与者试图隐藏他们在市场中的存在,但他们不可避免地会留下痕迹。我们的任务是学习如何识别这些痕迹并正确解释它们。 主要功能: 向卖家和买家显示活跃区域! 该指标显示所有正确的初始买入和卖出脉冲水平/区域。激活这些水平/区域后,开始寻找切入点,水平会改变颜色并填充特定阴影。此外,还会显示箭头,以便更直观地了解情况。 显示更高时间范围内的级别/区域(MTF 模式) 添加了使用更高时间间隔显示级别/区域的功能。此外,该指标还具有自动趋势检测功能(   TPSproTREND PRO   )。 用于交易的单独专业的逐步算法。 该算法专为日内交易而设计,既可顺势交易,也可逆势交易。每个活动模板均提供详细说明。 适用于多种时间范围 。 TPSpro RFI 水平指标可用于图表上的任何时间范围,从一分钟(M1)开始一直到每月(MN)。 图形和声音警报。 该指标提供图形和声音指示
首先,值得强调的是,这个交易工具是非重绘、非重画和非滞后的指标,非常适合专业交易。 在线课程,用户手册和演示。 智能价格行动概念指标是一个非常强大的工具,既适用于新手,也适用于经验丰富的交易者。它将超过20个有用的指标合并到一个指标中,结合了高级交易思想,如内圈交易员分析和智能资金概念交易策略。该指标侧重于智能资金概念,提供有关大型机构交易方式的见解,帮助预测它们的动向。 它在流动性分析方面尤其擅长,有助于理解机构的交易方式。它擅长预测市场趋势,并仔细分析价格波动。通过将您的交易与机构策略对齐,您可以更准确地预测市场走向。该指标多才多艺,擅长分析市场结构,识别重要的订单区块,并识别各种模式。 它擅长识别BOS和CHoCH等模式,理解动量的转变,并突出显示供需强劲的关键区域。它还擅长发现强大的不平衡,并分析价格创造更高高点或更低低点的模式。如果您使用斐波那契回撤工具,该指标可以满足您的需求。它还可以识别相等的高点和低点,分析不同的时间框架,并通过仪表板显示数据。 对于使用更高级策略的交易者,该指标提供了工具,如公平价值差指标和优惠和折扣区域的识别。它特别关注高时间框架订单
Enigmera
Ivan Stefanov
5 (3)
ENIGMERA:市场核心 https://www.enigmera.com 简介 该指标和交易系统是金融市场的一种非凡方法。ENIGMERA 利用分形周期精确计算支撑位和阻力位。它能显示真实的累积阶段,并给出方向和目标。 该系统无论在趋势中还是在修正中都能发挥作用。 它是如何运行的? ENIGMERA 由三条线组成:支撑/阻力线、目标线和偏离线。与一般市场指标将过去的数据推断为现在和未来的情况不同,该系统能提供当前的完整情况。如果你处于支撑位,这意味着真正的支撑;如果你处于阻力位,这意味着真正的阻力。如果突破某一水平,则表示趋势发生变化。没有重绘。 由于市场在不断变化,ENIGMERA 不断调整其评估工具,定期修改策略。  这保证了每种情况都能得到全面评估。这一市场指标的独特性显而易见,其能力不言而喻。  ENIGMERA 为金融分析师和咨询师提供服务,他们需要可靠的见解与客户分享,也为投资者提供服务,他们需要最精确和最可靠的保证。 该系统能够达到最佳精度,使交易者能够自信、清晰地评估他们的选择。 ENIGMERA 将 20 年的交易专长和知识整合到一个综合软件
Stratos Pali
Michela Russo
5 (1)
Stratos Pali Indicator   is a revolutionary tool designed to enhance your trading strategy by accurately identifying market trends. This sophisticated indicator uses a unique algorithm to generate a complete histogram, which records when the trend is Long or Short. When a trend reversal occurs, an arrow appears, indicating the new direction of the trend. Important Information Revealed Leave a review and contact me via mql5 message to receive My Top 5 set files for Stratos Pali at no cost! D
M1 Gold
Abdulkarim Karazon
MetaBands M4
Vahidreza Heidar Gholami
5 (2)
MetaBands使用强大且独特的算法绘制通道并检测趋势,以便为交易者提供进出交易的潜在点。它是一个通道指标和强大的趋势指标。它包括不同类型的通道,可以通过使用输入参数简单地合并以创建新通道。MetaBands使用所有类型的警报通知用户市场事件。 功能 支持大多数通道算法 强大的趋势检测算法 能够合并不同类型的通道 多时间帧和多货币(信号矩阵) 所有类型的警报功能(声音、屏幕闪烁、推送通知、电子邮件、弹出窗口、箭头) 它永远不会重绘 趋势检测 MetaBands使用在通道内振荡的蓝色线来检测趋势。当该线遇到通道的上界时,表明开始下跌趋势,当它遇到下界时,表明开始上涨趋势。如果蓝线接近中线,则市场处于整理期。 该指标使用独特的方法来检测趋势。一开始可能看起来有些复杂,但如果您观看视频教程,您就会意识到它是多么强大且易于使用。 入场和出场信号 当趋势变化或价格穿过上下通道时,MetaBands会立即通过不同的方法提醒交易者,这些方法可以在指标设置中启用。 信号矩阵 要监视来自不同时间框架的多个符号并在一个地方查看信号,请单击右上角按钮或按键盘上的M键以打开信号矩阵。该矩阵可以
PRO Renko System
Oleg Rodin
5 (25)
PRO Renko Arrow Based System for trading renko charts.  准确的信号交易任何外汇工具. 另外,我将免费提供系统的附加模块! PRO Renko系统是RENKO图表上高度准确的交易系统。该系统是通用的。 该交易系统可应用于各种交易工具。 该系统有效地中和了所谓的市场噪音,打开了获得准确反转信号的通道。 该指标易于使用,只有一个参数负责产生信号。 您可以很容易地使算法适应您感兴趣的交易工具和renko酒吧的大小。 我很乐意通过提供任何咨询支持来帮助所有客户有效地使用该指标。 祝您交易成功!购买后,立即写信给我! 我将与您分享我的建议和我的renko发电机。 另外,我将免费提供系统的附加模块!
Legacy of Gann
Pavel Zamoshnikov
4.83 (12)
The indicator very accurately determines the levels of the possible end of the trend and profit fixing. The method of determining levels is based on the ideas of W.D.Gann, using an algorithm developed by his follower Kirill Borovsky. Extremely high reliability of reaching levels (according to K. Borovsky  - 80-90%) Indispensable for any trading strategy – every trader needs to determine the exit point from the market! Precisely determines targets on any timeframes and any instruments (forex, met
Currency Strength Exotics
Bernhard Schweigert
4.87 (30)
目前8折优惠! 对任何新手或专家交易者来说都是最好的解决方案! 这个指标是专门用来显示任何符号的货币强度,如异国货币对、商品、指数或期货。它是同类产品中的第一个,任何符号都可以添加到第9行,以显示黄金、白银、石油、DAX、US30、MXN、TRY、CNH等的真实货币强度。这是一个独特的、高质量的、负担得起的交易工具,因为我们已经纳入了一些专有的功能和一个新的公式。想象一下,你的交易将如何改善,因为你能够准确地确定新趋势或剥头皮机会的触发点? 用户手册:点击这里   https://www.mql5.com/en/blogs/post/708876 它适用于所有时间框架。你将很快能够看到TREND! 根据新的基础算法设计,它使识别和确认潜在交易变得更加容易。这是因为它以图形方式显示了8种主要货币和一种符号的强弱。 该指标显示了8种主要货币(澳元加元瑞士法郎欧元英镑日元新西兰美元)的强弱线,再加上一个符号! 该指标显示了符号的真实价值。例如:对于XAUUSD(黄金):价格以美元报价。如果黄金在上涨,你怎么能知道是黄金的强势还是美元的弱势?只有当黄金走强时,我们才会进行
Shepherd Harmonic Pattern
Abdullah Alrai
4.65 (49)
这个指标将检测手动和自动方法在图表上绘制的谐波模式。 您可以从此链接查看用户手册: 添加您的评论并联系我们以获得它 有一个免费版本可以在mt4上尝试此产品。 您可以使用它来检测Gartley和Nenstar模式: https://www.mql5.com/en/market/product/30181 您可以从以下链接购买完整的MT4版本: https://www.mql5.com/en/market/product/15212 注意 指标具有控制面板,并将保存每个(图表和时间框架)设置。 您可以将其最小化以在图表上获得更多空间,并且如果您更喜欢使用其他分析工具,则可以按关闭按钮隐藏所有指标数据 当您使用此指标并更改设置,添加诸如移动平均线或布林带之类的指标时,此指标将自动保存您的模板编辑,并且您可以随时加载它们。 如果您使用的是Windows 10,请右键单击MetaTrader图标>兼容性>更改高DPI设置>系统(增强)以获得最佳屏幕设置(应在高清设备中完成)。 指标只是谐波交易理论的解释,用于检测图表上的谐波模式。 如果您想学习它,可以搜索Scott Carney的书,名为“Ha
SSM ZakopiecFX Follow The Trend
ROBERT URBANSKI
4.81 (21)
使用我们的自定义MT4指标发现成功外汇交易的秘诀! 您是否曾经想过如何在外汇市场上取得成功,一贯赚取利润,同时降低风险? 这是您一直在寻找的答案! 允许我们介绍我们的专有MT4指标,该指标将彻底改变您的交易方法。 独特的多功能性 我们的指标专为喜欢Renko和Rangebar Candle编队的用户而设计。 我们了解到,这些图表类型受到许多经验丰富的交易者的青睐,这就是为什么我们的指标与它们无缝集成,从而提供无与伦比的市场分析。 清晰的趋势信号 忘记复杂的分析! 我们的指标利用鲜艳的色彩和清晰的点结构来明确指示市场趋势。 红色和蓝色的点毫无疑问地对价格变动的方向留下了疑问,从而可以在您的交易中快速决策。 与HH/HL HL/LL策略对齐 如果您正在寻求一个指标,该指标无缝地与基于HH/HL和HL/LL结构的策略无缝合作,则不需要更多。 我们的工具不仅确定了这些形式,而且还促进了它们在投资过程中的有效利用。 绝对的清晰度和简单性 我们的首要任务是为您提供一种不仅有效而且易于使用的工具。 我们的指标是为了清晰而设计的,使您可以专注于做出投资决策,而不是
Gold Channel XAUUSD
Paulo Rocha
5 (2)
Gold Channel is a volatility-based indicator, developed with a specific timing algorithm for the XAUUSD pair, which consists of finding possible corrections in the market. This indicator shows two outer lines, an inner line (retracement line) and an arrow sign, where the theory of the channel is to help identify overbought and oversold conditions in the market. The market price will generally fall between the boundaries of the channel. If prices touch or move outside the channel it is a tra
Apollo BuySell Predictor 是一个包含多个模块的专业交易系统。该指标为交易者提供价格突破区、基于斐波那契的支撑和阻力位、趋势反转线、交易量信号、回调和任何交易者每天都需要的其他有用功能。该系统将适用于任何一对。推荐的时间框架是 M30、H1、H4。尽管该指标可以与其他时间范围一起使用,但 H4 以上的时间范围除外。 该系统是通用的,因为它提供了任何交易者成功交易所需的一切。该系统可以多种方式使用。该指标可用于日内交易、波段交易甚至剥头皮交易。无论您喜欢哪种交易方式,系统都会帮助您以真实的形式看待市场。所有系统信号都不会被重绘! 您可以根据您的交易偏好和任务启用/禁用各种系统模块。系统提供所有类型的通知,包括PUSH通知。您可以打开/关闭您需要的通知。 购买后请给我发电子邮件。我将与您分享交易说明和重要的红利指标,它们将使您的交易更加有利可图!
Currency Strength Wizard
Oleg Rodin
4.93 (44)
货币强度向导是一个非常强大的指标,为您提供成功交易的一体化解决方案。该指标使用多个时间范围内所有货币的数据来计算这个或那个外汇对的力量。此数据以易于使用的货币指数和货币电力线的形式表示,您可以使用它们来查看这种或那种货币的力量。 您所需要的只是将指标附加到您要交易的图表上,该指标将向您显示您交易的货币的真实强度。该指标还向您显示买卖量压力的极值,您可以在顺势交易时利用这些压力。该指标还显示了基于斐波那契的可能目标。该指标可用于各种交易时间范围。该指标支持各种货币对的交易。 该指标为您提供所有类型的警报,包括推送通知。 购买后请联系我。我将与您分享我的交易技巧,并免费为您提供丰厚的红利指标! 祝您交易愉快,获利丰厚!
GOLD Impulse with Alert
Bernhard Schweigert
4.56 (9)
这个指标是我们2个产品 Advanced Currency IMPULSE with ALERT  +   Currency Strength Exotics 的一个超级组合。 它适用于所有时间框架,并以图形方式显示8种主要货币和一种符号的强势或弱势冲动! 该指标专门用于显示任何符号的货币强度加速,如黄金、异国货币对、商品、指数或期货。这是它的第一个指标,任何符号都可以被添加到第9行,以显示黄金、白银、石油、DAX、US30、MXN、TRY、CNH等的真实货币强度加速(冲动或速度)。 建立在新的基础算法上,它使识别和确认潜在的交易更加容易。这是因为它以图形方式显示了一种货币的强势或弱势是否正在加速,并测量了这种加速的速度--把它想象成你汽车中的速度表。当你加速时,事情显然会发生得更快,这在外汇市场上也是一样的,即如果你配对的货币正在向相反的方向加速,你就会发现一个潜在的有利可图的交易。 动态市场斐波那契28水平被用作警报触发器,将适应市场活动。如果冲动击中黄色触发线,你将收到警报。然后你就知道作为一个交易员应该做什么。货币对和方向已经给出。只需点击警报按钮,就可以
Scalper Vault
Oleg Rodin
5 (27)
Scalper Vault 是一个专业的剥头皮系统,为您提供成功剥头皮所需的一切。该指标是一个完整的交易系统,可供外汇和二元期权交易者使用。推荐的时间范围是 M5。 该系统为您提供趋势方向的准确箭头信号。它还为您提供顶部和底部信号以及江恩市场水平。无论您拥有何种交易经验,该系统都易于使用。您只需要遵循简单的规则并每天重复该过程。 建议将此系统用于主要货币对。感谢您的关注! 请注意,该指标在策略测试器中可能无法正常工作。因此,我建议仅在模拟或真实账户的真实交易条件下使用该系统。 指示器提供所有类型的警报,包括推送通知。 购买指标后请与我联系。我将免费与您分享我的个人交易建议和出色的奖励指标! 祝您交易愉快,盈利!
ICT, SMC, SMART MONEY CONCEPTS, SMART MONEY, Smart Money Concept, Support and Resistance, Trend Analysis, Price Action, Market Structure, Order Blocks, BOS/CHoCH,   Breaker Blocks ,  Momentum Shift,   Supply&Demand Zone/Order Blocks , Strong Imbalance, HH/LL/HL/LH,    Fair Value Gap, FVG,  Premium  &   Discount   Zones, Fibonacci Retracement, OTE, Buy Side Liquidity, Sell Side Liquidity, BSL/SSL Taken, Equal Highs & Lows, MTF Dashboard, Multiple Time Frame, BigBar, HTF OB, HTF Market Structure, 
Matrix Arrow Indicator MT4
Juvenille Emperor Limited
5 (3)
矩阵箭头指标 MT4 是一种独特的 10 合 1 趋势,遵循 100% 非重绘多时间框架指标 ,可用于所有符号/工具:外汇、商品、加密货币、指数、股票。  Matrix Arrow Indicator MT4 将在其早期阶段确定当前趋势,从多达 10 个标准指标中收集信息和数据,它们是: 平均定向运动指数 (ADX) 商品渠道指数 (CCI) 经典 Heiken Ashi 蜡烛 移动平均线 移动平均收敛散度 (MACD) 相对活力指数 (RVI) 相对强弱指数 (RSI) 抛物线SAR 随机振荡器 威廉姆斯的百分比范围 当所有指标给出有效的买入或卖出信号时,相应的箭头将打印在图表上,在下一根蜡烛/柱线开盘时,指示强劲的上升趋势/下降趋势。用户可以选择使用哪些指标,并可以单独调整每个指标的参数。 Matrix Arrow Indicator MT4 仅从选定的指标中收集信息,并仅根据其数据打印箭头。 Matrix Arrow Indicator MT4 还可以为所有新信号发送终端、推送通知或电子邮件警报。无论您是黄牛、日内交易者还是波段交易者, Matrix Arrow Indicat
作者的更多信息
The   Moving Average Crossover Dashboard indicator   is a technical tool that displays the crossovers of 2 selected moving averages on the price chart indicating whether it is a bullish or bearish crossover. In addition, as its name indicates, it shows a signal dashboard that indicates in which market and time frame a crossover of the two moving averages occurs. In the setting window the user can select the markets and time frames that can be displayed on the dashboard. You also have the option
The Bullish and Bearish Engulfing Pattern Screener for MetaTrader 4 is a powerful tool designed for traders looking to identify key reversal patterns in the financial markets. This indicator scans price charts for bullish and bearish engulfing patterns, which signal potential trend reversals. Key Features: Real-time Scanning : Continuously analyzes price data to provide instant alerts when engulfing patterns are detected. Customizable Settings : Allows users to adjust parameters to fit their tra
FREE
Indicador de Bandas de Fibonacci para Metatrader 4 . Este indicador funciona de forma similar a las conocidas Bandas de Bollinger clásicas, pero en lugar de usar la desviación estándar para trazar las bandas usa números de Fibonacci y el ATR (Average True Range). Puede usarse para trazar niveles de soporte y resistencia que pueden emplearse en sistemas de scalping de corto plazo y swing trading.  Las bandas del indicador son calculadas de la siguiente forma: Línea central : Media móvil de n peri
FREE
MA Trend Following Indicator for MT4 is a simple technical analysis tool designed to follow the trend in any currency pair chosen by the trader by combining 3 moving averages on two different time frames, one long term and one short term.  It basically provides a bullish or bearish signal when the moving averages on one time frame align with the moving averages on a different time frame to have a confluence signal. The indicator is presented as a screener with multiple currency pairs (that
RSI Signals is a simple dashboard type indicator that displays the values of the RSI (Relative Strength Index) oscillator on various instruments and time frames chosen by the user. In addition, it can be configured by the trader to show signals when the RSI is in an overbought/oversold condition, when it crosses these levels or when it crosses the 50 level, which is important in some strategies. It is simple and easy to set up. By itself, it should not be used as a trading system since RSI signa
The Magic MA Moving Average Indicator is a market analysis tool that has more than 30 types of moving averages that the trader can use to gauge the market trend. Among the types of moving averages that the trader can visualize are the most common MAs (SMA, EMA and SMMA), adaptive moving averages such as FRAMA and KAMA and other MAs based on innovative calculation and analysis methods such as LSMA, ZLEMA and others. The indicator is designed to display all these moving averages on a single c
Stochastic Signals is a simple dashboard type indicator that displays the values of the stochastic oscillator on various instruments and time frames chosen by the user. The stochastic is usually used in many trading strategies, especially in countertrend systems when the price reaches overbought/oversold conditions. In addition, this indicator can be configured by the trader to show signals when the stochastic oscillator is in an overbought/oversold condition, when it crosses these levels or whe
ADX Analyzer Board Indicator
Raul Canessa Castameda
ADX Analyzer is a simple dashboard type indicator that displays the values of the ADX oscillator on multiple instruments and time frames chosen by the trader. The ADX is a trend strength indicator that is usually used in many trading strategies, especially in trend following systems, as a filter that indicates when the price has a strong bullish or bearish trend. This indicator and its dashboard can be configured to show signals when the ADX detects a strong bullish/bearish trend, when a strong
Williams R Scanner Indicator
Raul Canessa Castameda
Williams R Scanner Indicator is a technical tool for Metatrader 4 designed to display a simple dashboard showing the values of the Williams %R oscillator across multiple markets and time frames of the trader's choosing. The dashboard also shows when the Williams %R indicator reaches an overbought or oversold condition which may precede market reversals. The trader also has the option of viewing signal alerts on the platform that indicate when the Williams %R has made a bullish or bearish cros
The Donchian Scanner Signals Indicator with is a powerful tool designed for traders operating in the financial market using the Metatrader 4 platform. This indicator combines the popular Donchian Channels strategy with advanced signalization and real-time alert features, providing a clear view of potential entry and exit points in a financial asset. Key Features: Donchian Channels Visualization: The indicator graphically displays Donchian Channels on the price chart. These channels are formed us
筛选:
无评论
回复评论