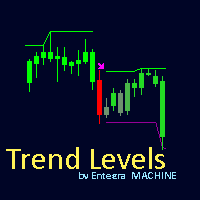
Fractal breakout level
- 指标
- Gennadiy Stanilevych
- 版本: 7.1
- 更新: 8 二月 2023
- 激活: 13
Purpose and functions of the indicator
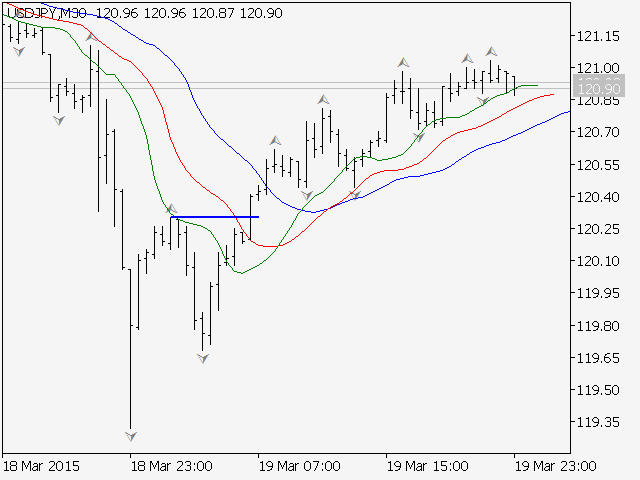
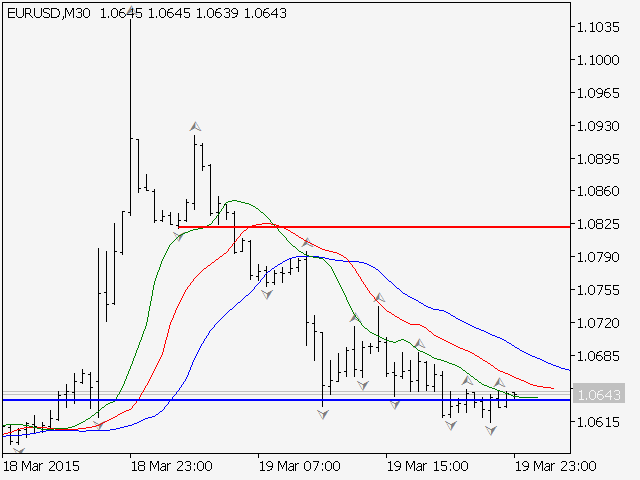
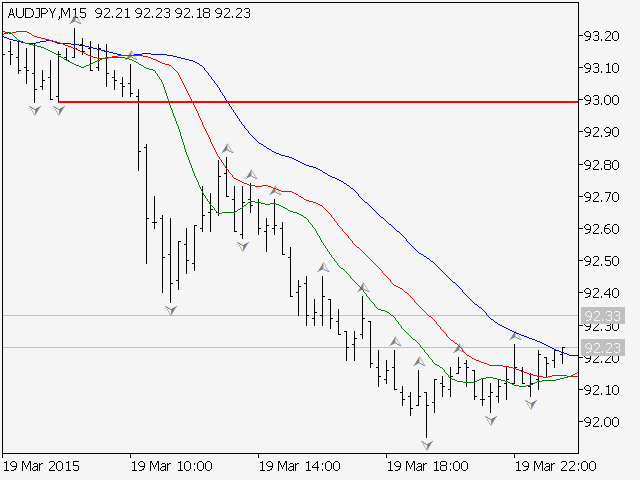
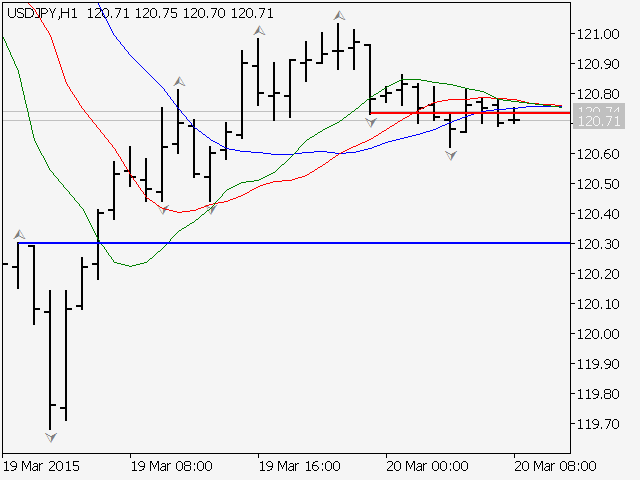
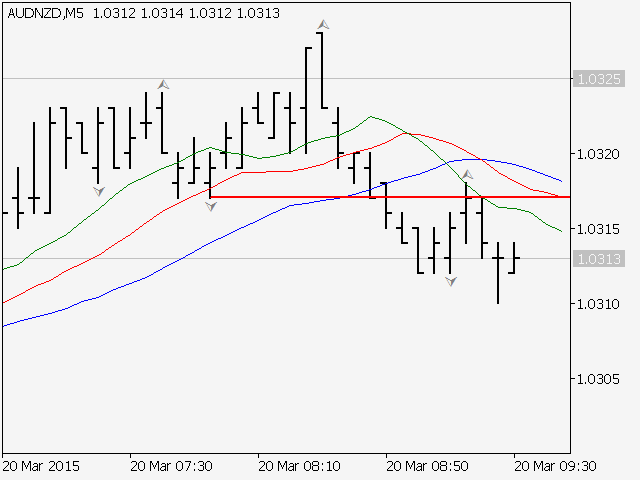
The indicator determines and marks the moments of trend change on the chart based on the theory of fractal levels breakout on any of the analyzed timeframes. If a breakout based on all rules is valid, a horizontal line with corresponding color will appear on the chart. If there is an uptrend, the line will be blue. In the descending trend, the line will be red. The blue line is a strong support level, the trader should look for buying opportunities above this line. The red line is a resistance level, the trader should sell below it.
Stop loss with a buy trade should be set under the lowest low below the blue line. Stop loss for a sell trade should be set on the highest high above the red line. The color change of the line notifies the trader about a trend change. All the fractals and their breakouts that are located between these lines do not represent the change of trend. If the line appears on a larger timeframe, it has a higher priority than the smaller ones. When the line is formed on the daily chart, the trader should look for buying/selling opportunities on the smaller timeframes.
Indicator parameters
- Draw history levels = false\true — method to display the support and resistance levels in the history. False - display only the last 2 lines of a trend change. True - all changes in history.
- Labels size=2 — thickness of support or resistance lines.
- Color of UP signals=Blue — color of line in the ascending trend. Blue color is default.
- Color of DN signals=Red — color of line in the descending trend. Red color is default.
- UP - size and color of a dot, which displays the period when there is an uptrend.
- DN - size and color of a dot, which displays the period when there is a downtrend.
The indicator is self-sufficient trading system. It is recommended to use it as a filter of trading signals in a software package consisting of the following products:

