• 概述
  • 评论
  • 评论
  • 新特性

Delta of 2 symbols on the chart

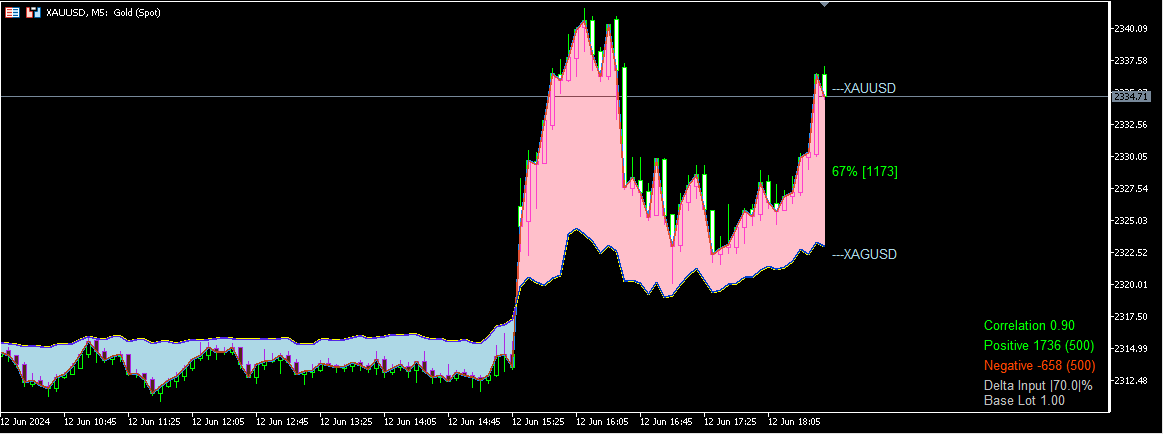
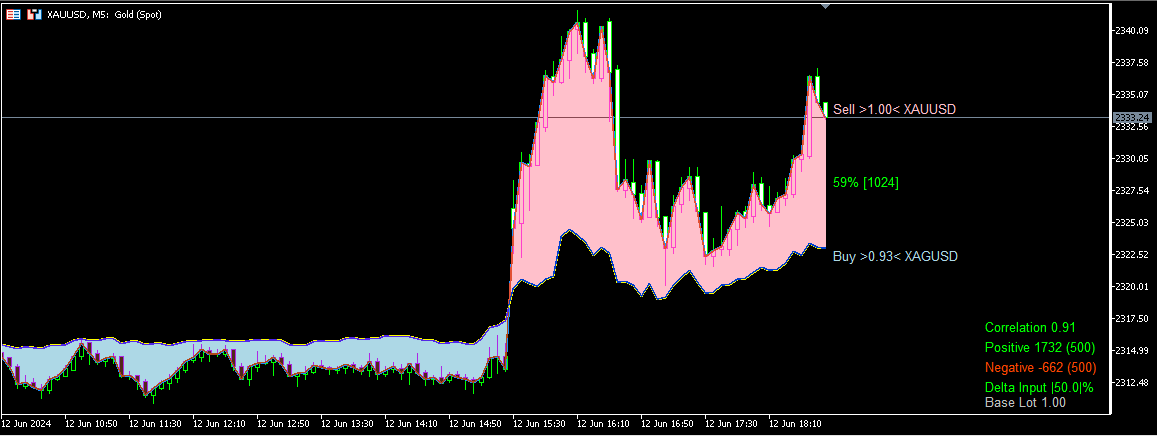
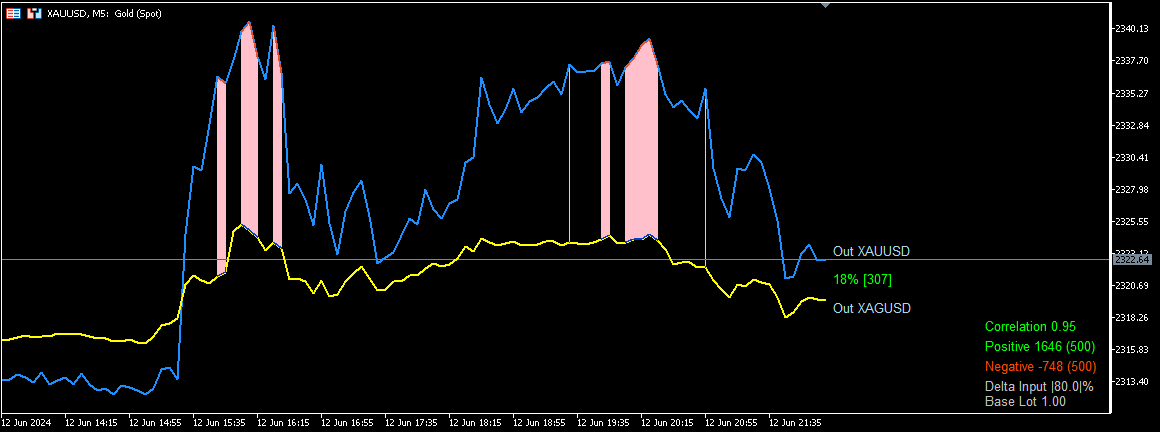
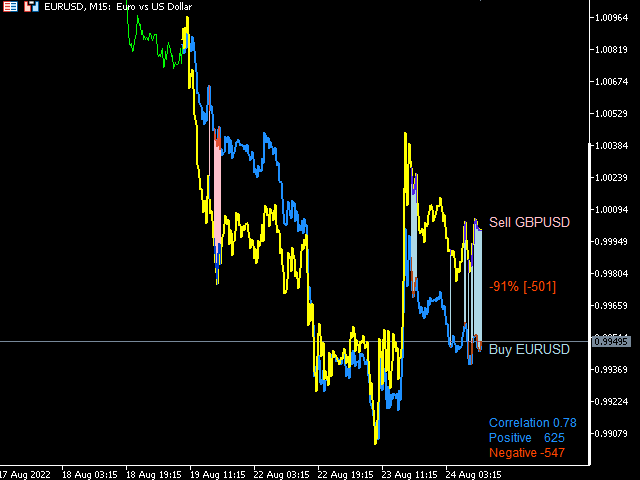
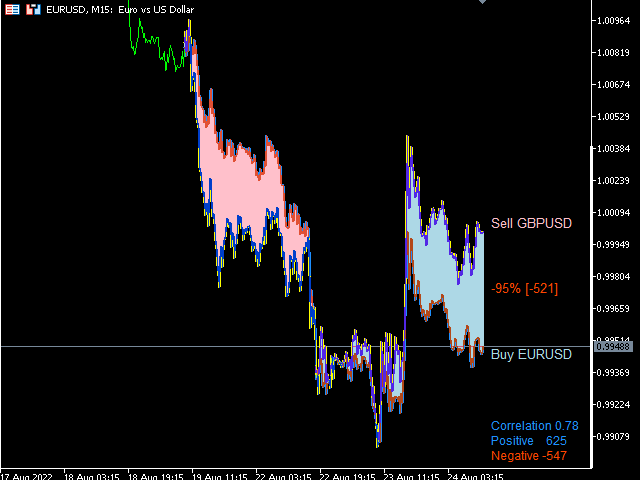
The indicator calculates the correlation coefficient of 2 instruments, shifts the chart of the 2nd instrument relative to the 1st and displays the charts of both instruments on the current chart. The maximum positive and negative deltas and the current delta as a percentage of the maximum are calculated. It is possible for signals to set a delta for entry and exit with displaying the direction of entry into trade for each instrument. The space between the charts is also filled with different colors, depending on the sign of the delta, completely or only the areas where the delta corresponded to the signal to enter the trade. If the minimum maximum delta is set in points in the indicator settings and any of the maximum deltas is less than the specified one, then its value in the lower right corner will be displayed in gray.
推荐产品
Point Black
Ignacio Agustin Mene Franco
Black Card Pack indicator 5/1 point black It has the strategy of professional bollingers where each arrow gives you a different entry signal. It is used to operate in m1 and in d1 It is used for scalping and intraday, modified for forex markets ! suitable for all pairs modified for synthetic index markets suitable for all pairs! Ideal for volatility and jumps!
Volume by price
Zhongquan Liang
成交量在交易中扮演着至关重要的角色,它是衡量市场活跃度和投资者情绪的关键指标。以下是成交量对交易的几个重要作用: 确认趋势 :道氏理论强调了成交量在确定市场趋势中的重要性。较大的成交量通常表明市场多空双方的分歧较大,而较小的成交量则可能意味着市场对当前价格的认同度较高。 捕捉主力动作 :通过一段时间的成交量分析,可以捕捉到主力资金的动向。一天的成交量可能会被操纵,但长期的成交量更能真实反映市场主力的行为。 预测价格变动 :成交量的变化往往先于价格变动。例如,价格上涨时伴随着成交量的增加,可能预示着后市将继续上涨;相反,如果价格上涨但成交量减少,则可能意味着上涨动力不足。 衡量市场活跃度 :成交量的大小可以直接反映市场的活跃程度。高成交量表明市场活跃,低成交量则可能意味着市场冷淡。 供需关系的体现 :成交量是市场供需关系的直接表现。供不应求时,成交量会放大;供过于求时,成交量会萎缩。 辅助技术分析 :在技术分析中,成交量与价格、时间和空间一起构成了分析的四大要素。成交量的分析可以帮助投资者更准确地判断市场趋势和转折点。 决策依据 :有经验的投资者会将成交量作为进出市场的依据之一。例如,带
ToolBox 360 is the swiss knife of all indicators. It is full packed with useful tools to help you with your trading. It can be used to find best entry and exit points and help you to decide if you should open a trade or not. It shows market trends, candlestick formations outside / inside bars and you can sett time based allerts. Main features: Time based Fibonacci lines Choose a start and end time and the indicator shows you Fibonacci lines within the selected time range including range high
Harmonic ABCD Monitor MT5
Mihail Matkovskij
5 (2)
Multi-currency, multi-timeframe, harmonic pattern indicator AB = CD. Supports sending push notifications about signals to a mobile device, messages on e-mail, as well as messages using alerts on all available currency pairs and timeframes. This indicator was based on the indicator Harmonic ABCD Universal. Version for MetaTrader 5:  https://www.mql5.com/en/market/product/44972 . See also: Harmonic ABCD Universal for MetaTrader 4 . Using modern software development methods has made the indicator a
The Super Trend is one of the best trend-following indicator for MT5 platforms. It's working fine for real-time trend alerts and accurate signals and it help to identify the best market entry and exit positions.  This indicator is the tool you can  refers to a trend following overlays. It contains two major parameters: the period and the multiplier. Besides, traders should consider default values that include 10 for every true range aтd 3 for the multiplier. 2 Types TP SL you set in input Point
Owl Smart Levels MT5
Sergey Ermolov
4.31 (39)
MT4版本  |   FAQ Owl Smart Levels Indicator 是一個完整的交易系統,包含 Bill Williams 的高級分形、構建正確的市場波浪結構的 Valable ZigZag 以及標記準確入場水平的斐波那契水平等流行的市場分析工具 進入市場和地方獲利。 策略的详细说明 指示灯使用说明 顾问-贸易猫头鹰助手助理 私人用户聊天 ->购买后写信给我,我会将您添加到私人聊天中,您可以在那里下载所有奖金 力量在於簡單! Owl Smart Levels 交易系統非常易於使用,因此適合專業人士和剛開始研究市場並為自己選擇交易策略的人。 策略和指標中沒有隱藏的秘密公式和計算方法,所有策略指標都是公開的。 Owl Smart Levels 允許您快速查看進入交易的信號,突出顯示下訂單的水平並向您發送有關已出現信號的通知。 優點很明顯: 清楚地顯示主要和更高時間框架的趨勢方向。 指示儀器信號的出現。 標記開單、止損設置和固定利潤的水平。 沒有多餘的,只有必要的結構! ZigZag 表示全球趨勢的方向,因此也表示貿易方向。 市場反轉點的短線清楚地表明在什麼水平上構建斐波
Renko System
Marco Montemari
This indicator can be considered as a trading system. It offers a different view to see the currency pair: full timeless indicator, can be used for manual trading or for automatized trading with some expert advisor. When the price reaches a threshold a new block is created according to the set mode. The indicator beside the Renko bars, shows also 3 moving averages. Features renko mode median renko custom median renko 3 moving averages wicks datetime indicator for each block custom notificatio
Supply and Demand Monster
Tsog Erdene Borjigon Enkhkhudulmur
Supply and demand zones are at the heart of   supply and demand trading . These zones are areas that show  liquidity at a specific price.  The supply zone is also called the distribution zone, while the demand zone is called the accumulation zone.   Our indicator automatically draw supply and demand zones in Metatrader 5. It give opportunity to understand trading zone and avoiding risk.
Go Way TREND
Ywsf Hsyn Hmad Alrsh
順應潮流。是的,在 15 分鐘的框架上等待進場信號,無論是買入還是賣出,並檢查信號是否出現在 30 分鐘的框架上(有時信號需要一個小時或更長時間才會出現。您可以返回到15分鐘框架並返回到30分鐘框架,重複此操作,直到主要訊號出現在您面前。被記錄,或當相反的訊號出現時它非常簡單並且適用於所有主要貨幣。  金屬、指標和所有框架,但最好的結果是 30 分鐘框架。 始終將止損設置在蠟燭底部下方,資金管理不得超過 資本的10% 順應潮流。是的,在 15 分鐘的框架上等待進場信號,無論是買入還是賣出,並檢查信號是否出現在 30 分鐘的框架上(有時信號需要一個小時或更長時間才會出現。您可以返回到15分鐘框架並返回到30分鐘框架,重複此操作,直到主要訊號出現在您面前。被記錄,或當相反的訊號出現時它非常簡單並且適用於所有主要貨幣。  金屬、指標和所有框架,但最好的結果是 30 分鐘框架。 始終將止損設置在蠟燭底部下方,資金管理不得超過 資本的10% 順應潮流。是的,在 15 分鐘的框架上等待進場信號,無論是買入還是賣出,並檢查信號是否出現在 30 分鐘的框架上(有時信號需要一個小時或更長時
A Média Móvel é um indicador que faz parte da Análise Técnica. Com ela, é possível identificar o equilíbrio dos preços no mercado, observando tendências de alta, neutra ou baixa. Este indicador customizado traz opções extras pera definir o método de cálculo podendo-se esclolher entre SMA,EMA,SSMA,LWMA,JJMA,JurX,ParMA,T3,Vidya,AMA,HULL MA. Também conta com varias opções para escolher o método de cálculo para o preço base a ser usado no cáculo da média.
DYJ ChameleonTrend基于趋势跟踪和反趋势系统工作。 DYJ ChameleonTrend是一种高概率指标。该指标使用独特的混合指标,将复杂的指标与用户的判断力相结合。 该指标是一种最先进的Ma交叉和ATR和方差算法。 该指示器显示两个彩色方向箭头和趋势滚动球,指示交易者的最佳进入和退出位置。 参数 InpPeriod=50--指标周期 InpPrice=指标价格方法有7种:1.收盘价格 方法 ,2.开盘价格 方法 . 3. 最高价格 方法 , 4. 最低价格 方法 , 5.中间价格 方法 , 6. 典型价格 方法 ,7. 加权方法 InpAtrDevPeriod = 5 —— 标准偏差指标或者ATR指标周期 InpUseWhat = 使用atr计算方法
The indicator detects divergence signals - the divergences between the price peaks and the MACD oscillator values. The signals are displayed as arrows in the additional window and are maintained by the messages in a pop-up window, e-mails and push-notifications. The conditions which formed the signal are displayed by lines on the chart and in the indicator window. The indicator parameters MacdFast - fast MACD line period MacdSlow - slow MACD line period MacdSignal - MACD signal line period Mac
该指标将向您显示您已经为图表上的每个订单设置的 TP 和 SL 值(以该货币表示)(接近交易/订单行),这将帮助您估算每个订单的利润和损失。它还会向您显示 PIP 值。显示的格式是“我们的损益/PIP 值的货币值”。 TP 值将以绿色显示,SL 值将以红色显示。 如有任何问题或了解更多信息,请随时通过 fxlife.asia@hotmail.com 或 fxlife.asia@yahoo.com 与卖家联系 (而指标中即将加入的下一个功能是“自动或半自动TP和SL设置”,我们的客户将免费获得更新版本。谢谢...^_^) (或者如果您认为在指示中应该增加一些功能,请随时告诉我们) ========================================================
Binary Trader EA
Bright Lance Soli
Binary Trader EA   This EA is designed to trade synthetic indices Boom 1000 index & Crash 1000 index. Boom1000 index & Crash1000 index from volatility 75 index Please don't use the default settings, ask for proper settings and I will send you. This EA follows the trend. Can set risk as a percentage. Only tested on binary deriv broker indices.  Crash 1000 index spikes down, so to avoid that, we trade on a bigger timeframes, 1hr timeframe is perfect. Contact me if you have any questions. Recomme
TrendDetect
Pavel Gotkevitch
The Trend Detect indicator combines the features of both trend indicators and oscillators. This indicator is a convenient tool for detecting short-term market cycles and identifying overbought and oversold levels. A long position can be opened when the indicator starts leaving the oversold area and breaks the zero level from below. A short position can be opened when the indicator starts leaving the overbought area and breaks the zero level from above. An opposite signal of the indicator can
Atomic Analyst MT5
Issam Kassas
4.78 (18)
首先值得强调的是,该交易指标是非重绘、非延迟的指标,这使其成为手动和机器人交易的理想选择。 用户手册:设置、输入和策略。 Atomic Analyst是一种PA价格行动指标,利用价格的力量和动量来寻找市场上更好的机会。配备了高级过滤器,可帮助去除噪音和假信号,并提高交易潜力。使用多层复杂的指标,Atomic Analyst扫描图表,并将复杂的数学计算转化为任何初学者都能理解并用来做出一致交易决策的简单信号和颜色。 “Atomic Analyst”是专为新手和经验丰富的交易者量身定制的综合交易解决方案。它将高级指标和一流功能融合为一体的交易策略,使其成为所有类型交易者的多功能选择。 日内交易和剥头皮策略:专为快速准确的日内交易和短期交易而设计。 日内和摆动交易策略:可用作追求价格大幅波动的日内和摆动交易者的可靠工具。 多货币和市场:凭借其可靠的精度,在不同的工具和市场上运作。 多个时间框架:可在多个时间框架上使用,性能良好。 稳定性:所有指标均不重绘、不重绘和不滞后,确保可靠的信号。 信号清晰度:提供箭头信号,用于清晰的入场和出场点。 实时警报:通过交易入场、SL和TP警报通知交
Darwin Assistant
Ramzi Abuwarda
隆重推出革命性的 MT5 指标 DARWIN Assistant   - 您通往成功交易世界的终极门户! DARWIN Assistant   采用精确和专业知识设计,采用特殊策略运行,利用先进技术指标(RSI、随机指标、CCI 和趋势)的力量,涵盖所有时间范围。准备好迎接非凡的交易体验吧,因为这个尖端指标为您提供最准确的入场信号,使您能够以无与伦比的信心驾驭市场。 借助 DARWIN Assistant   ,您可以访问关键指标的全面分析,并经过精心校准,以发现最有利可图的交易机会。告别不确定性,迎接明智决策的新时代。释放 RSI、随机指标、CCI 和趋势的力量,因为它们在 DARWIN Assistant   中无缝融合,以前所未有的方式描绘出一幅生动的市场动态图景。 由于 DARWIN Assistant   密切关注每个时间范围,因此可以轻松深入了解市场趋势和模式的世界。无论您喜欢短期的兴奋还是长期的战略投资,这个卓越的指标都能满足您的交易风格,为您提供市场潮起潮落的整体视图。 DARWIN Assistant   的准确性是其成功的基石。在广泛的研究和开发的支持
Automated Trendlines MT5
Georgios Kalomoiropoulos
趋势线是外汇交易中最重要的技术分析工具。不幸的是,大多数交易者没有正确绘制它们。自动趋势线指标是专业交易者的专业工具,可帮助您可视化市场的趋势运动。 有两种类型的趋势线看涨趋势线和看跌趋势线。 在上升趋势中,外汇趋势线是通过价格变动的最低摆动点绘制的。 连接至少两个“最低点”将创建一条趋势线。 在下跌趋势中,趋势线是通过价格走势的最高摆动点绘制的。 连接至少两个“最高点”将创建一条趋势线。 趋势线何时突破? 当看跌蜡烛收于看涨​​趋势线下方并且蜡烛的高点在趋势线上方时,看涨趋势线会被打破。 当看涨蜡烛收于看跌趋势线上方并且蜡烛的低点低于趋势线时,看跌趋势线会被打破。 趋势线何时删除? 当一根完整的蜡烛在看涨趋势线下方形成时,看涨趋势线将被删除。 当完整的蜡烛在看跌趋势线上方形成时,看跌趋势线将被删除。 您可以从输入参数更改看涨和看跌趋势线的颜色和宽度。
This indicator scans the 1-3 Trendline pattern . The indicator is a 100 % non repaint low risk breakout system . The patterns are formed around swing high and swing lows which make them a low risk pattern with high reward. PATTERN BACKGROUND The 1-3 Trendline Breakout pattern is formed by four(4) points which are composed of three (3) primary points and the pattern neck. A trendline is always formed by the point 1 and the neck of the pattern . When price breaks out of the trendline formed ,
我们创新的基本烛台形态仪表盘专为自动识别图表上的盈利烛台形态而设计。该仪表盘使用先进的算法实时扫描价格图表,并检测从经典到复杂的各种烛台形态。此外,它还有一个易于使用的界面,允许您在不同的时间框架上对检测到的形态进行可视化,从而轻松做出明智的决策/ MT4 版本 免费指标:   Basic Candlestick Patterns 包括谐波形态 看涨形态 Hammer  Inverse hammer Bullish engulfing Morning star 3 White soldiers 看跌形态 Hanging man Shooting star Bearish engulfing Evening star 3 Black crows 指标列 Symbol:   将显示所选符号 Pattern:   形态类型(锤子型、反向锤子型、看涨吞没型......) Bar:   自检测到该形态以来所经过的柱状图数量 Age (in minutes):   自检测到该形态以来的年龄 主要输入 Symbols :   从 "28 种主要货币对 "或 "选定符号
"Hunttern harmonic pattern finder" base on the dynamic zigzag with the notification and prediction mode This version of the indicator identifies 11 harmonic patterns and predicts them in real-time before they are completely formed. It offers the ability to calculate the error rate of Zigzag patterns depending on a risk threshold. It moreover sends out a notification once the pattern is complete. The supported patterns: ABCD BAT ALT BAT BUTTERFLY GARTLEY CRAB DEEP CRAB CYPHER SHARK THREE
Forex Relative Performance indicator This indicator calculates the relative strength of major currencies against the US dollar. The basic idea behind this indicator is "to buy strong currency and to sell weak currency". This indicator allows you to quickly identify the best forex pair to trade according to your trading style (Intraday, Scalping, Swing, or Long Term)
Fibonacci and RSI Demo version MQL5
Carlos Daniel Vazquez Rosas
4 (1)
Fibonacci and RSI. Demo versión only works with GBPUSD. For full version, please, visit visit https://www.mql5.com/en/market/product/52101 The indicator is a combination of the Fibonacci and RSI indicators. Every time the price touches one of the fibonacci levels and the rsi condition is met, an audible alert and a text alert are generated. Parameters number_of_candles : It is the number of candles that will be calculated. If you put 100, the indicator will give you the maximum and min
FREE
Indicator and Expert Adviser  EA Available in the comments section of this product. Download with Indicator must have indicator installed for EA to work. Mt5 indicator alerts for bollinger band and envelope extremes occurring at the same time. Buy signal alerts occur when A bullish candle has formed below both the lower bollinger band and the lower envelope  Bar must open and close below both these indicators. Sell signal occur when A bear bar is formed above the upper bollinger band and upp
Advanced Bollinger Bands Scanner is a multi symbol multi timeframe Bollinger bands dashboard that monitors and analyzes the Bollinger Bands indicator from one chart. This panel scans the Bollinger bands indicator in up to 28 configurable instruments and 9 timeframes for price overbought/oversold, price consolidation (Bollinger bands squeeze), and consolidation breakout (squeeze break)  with a deep scan feature to scan all market watch symbols (up to 1000 instruments!).    Download Demo here  
Looking for reliable levels on a price chart? Already tired of searching for similar indicators? Are the levels not working out as they should? Then this is the indicator for you. Volume Prices Universal is a reliable indicator of horizontal volumes. What does it show? First of all, the main idea of ​​the indicator is to display at which price mark the price has been for the longest time. Thus, the display of price volumes on the price chart is formed. With the help of which you can very simp
This indicator is intended for visual multicurrency analysis. It allows synchronous scrolling and analysis of a few charts simultaneously and can also be used for pairs trading. The indicator works both on Forex and on Russian FORTS market. The product has a very important property - if there are skipped bars at the symbols, the synchronism of charts on the time axis is fully preserved. Each chart point is strictly synchronous with the others on the time axis at any time frame. This is especiall
Supertrend indicator uses a combination of a moving average and average true range to detect the trend of a trading instrument. Supertrend indicator for MetaTrader 5 easily shows the trend as a line following the price. Triple SuperTrend Histo indicator  calculate  three supertrends to show the trend as a histogram. Changing the color from red to green means you can BUY , from green to red means you can SELL . Description of the method of drawing a histogram. The price is above the EMA 20
Real Trend Zigzag PRO   shows the real trend of a market, u nlike the default Zigzag indicator. It calculates the trend in real time and shows green lines for upwards trends, red lines for downward trends and blue lines for no trends.  Regarding the old slogan "the trend is your friend" it helps you to decide if should open a buy or sell position. The PRO version is a multi timeframe zigzag (MTF). Means, it shows the trend of the current timeframe as well as the trend of a higher or lower time.
Price Average Mt5
Kenneth Parling
价格观察的常识方法 价格上涨时买入,价格下跌时卖出 上面关于价格上涨时买入或价格下跌时卖出的声明可能过于宽泛,因此可能需要一些指导和规则,这就是 The 3 Duck's 发挥作用的地方。 价格平均 Mt5 指标将帮助您识别在最后一个上升趋势方向的买入机会和在最后一个下降趋势方向的卖出机会。标题中的“duck's”来自“让所有的鸭子排成一行”的说法,意思是让所有东西都按正确的顺序排列。共有三只鸭子,第一只鸭子将帮助您识别最后的上涨或下跌趋势,第二只鸭子有助于确认趋势方向,第三只鸭子将帮助您识别趋势方向的买入或卖出机会。该指标涉及使用三个不同的时间框架,一个 4 小时图(第一只鸭子)、一个 1 小时图(第二只鸭子)和一个 5 分钟图(第三只鸭子)。 我们需要做的第一件事是查看我们最大的时间范围(4 小时第一只鸭子),看看当前价格是高于还是低于。这只鸭子告诉我们当前价格高于或低于。这告诉我们,我们可能希望买入或卖出。 我们需要做的第二件事是查看我们的(1 小时第二只鸭子),我们还需要在此图表上查看当前价格高于或低于,这给了我们确认,例如,如果这两只鸭子现在低于平均水平,我们关注出
该产品的买家也购买
首先,值得强调的是,这个交易系统是一个非重绘、非重画和非滞后的指标,这使得它非常适合手动和机器人交易。 在线课程,手册和下载预设。 “智能趋势交易系统 MT5”是专为新手和经验丰富的交易者量身定制的综合交易解决方案。它结合了超过 10 个优质指标,具有 7 多个强大的交易策略,使其成为适用于各种市场条件的多功能选择。 趋势跟随策略:提供精确的入场和止损管理,以有效地跟随趋势。 反转策略:识别潜在的趋势反转,使交易者能够利用区域市场的机会。 剃头策略:专为快速准确的日内交易和短期交易而设计。 稳定性:所有指标都不会重绘、不会重画和不会滞后,确保可靠的信号。 定制:支持自定义策略,以满足个人交易偏好。超过 7 种策略和组合可帮助您找到最佳策略。 信号清晰度:提供箭头信号,以指示清晰的入场和退出点。 实时警报:通过交易进出警报使交易者保持了解。 深入分析:提供更高时间框架的趋势分析和实时交易监控。 自适应颜色编码:利用蜡烛颜色编码来显示成交量、趋势和反转蜡烛信号。通过蜡烛颜色分析市场方向。 “智能趋势交易系统 MT5”赋予交易者必要的工具,以便在各种市场条件下做出明智和战略性的交易决策。无论
Quantum Trend Sniper
Bogdan Ion Puscasu
4.92 (48)
介绍   量子趋势狙击指标 ,突破性的 MQL5 指标,正在改变您识别和交易趋势反转的方式!由拥有超过13年交易经验的资深交易员团队开发,     量子趋势狙击指标   旨在通过其创新的方式以极高的准确度识别趋势反转,将您的交易之旅推向新的高度。 ***购买量子趋势狙击指标,即可免费获得量子突破指标!*** 当量子突破指标识别出趋势反转时,它会向您发出警报和信号箭头,并建议您三个止盈水平。 它既适合新手交易者,也适合专业交易者。 量子 EA 通道:       点击这里 MT4版本:       点击这里 建议: 时间范围: 所有时间范围。为了获得最佳结果,我们建议在 M15、M30 和 H1 时间范围内使用它。 货币对:欧元兑美元、英镑兑美元、澳元兑美元、欧元兑英镑、, EURAUD,  XAUUSD 账户类型:ECN、Raw 或 Razor,点差极低 经纪时间:任意 经纪商:IC Markets、Pepperstone with Raw 和 Razor 的点差最低 建议止损:50 点 建议止盈水平:20 点、50 点和
Entry Points Pro for MT5
Yury Orlov
4.55 (160)
这款指标用于 MT5,可提供准确的入场交易信号,且无重绘。 它可应用在任何金融资产:外汇、加密货币、贵金属、股票、指数。 它将提供极其精准的评估,并告诉您何时开仓和平仓的最佳时机。 观看 视频 (6:22),其中包含一个仅处理单一信号的示例,该信号即可值回指标购价! 大多数交易者在 Entry Points Pro 指标的帮助下,在第一个交易周内即改善了他们的交易结果。 订阅我们的 Telegram 群 ! Entry Points Pro 指标的益处。 入场信号无重绘 如果信号出现,并得到确认,则它不会再消失;不像是重绘指标,它会导致重大的财产损失,因为它们可以在显示信号后再将其删除。 无差错开仓 指标算法可令您找到入场交易(买入或卖出资产)的理想时机,从而提高每位交易者的成功率。 Entry Points Pro 可操作任何资产 它允许您在 MT5 平台上交易任何经纪商的加密货币、股票、贵金属、指数、大宗商品和货币。 提供任何方向的信号 Entry Points Pro 指标提供针对任意价格走势的入场交易信号 - 上涨、下跌或横盘(横向)。
FX Power MT5 NG
Daniel Stein
5 (6)
通过 mql5 和 Telegram 上 的晨间简报获取每日市场更新,包括详细信息和屏幕截图 ! FX Power MT5 NG 是我们长期以来非常受欢迎的货币强度计算器 FX Power 的下一代产品。 这款下一代强度计算器能提供什么?您所喜爱的原版 FX Power 的所有功能 附加功能 黄金/XAU 强度分析 更精确的计算结果 可单独配置的分析周期 可自定义计算限制,以获得更好的性能 为希望查看更多信息的用户提供特殊的多实例设置 无尽的图形设置,可在每个图表中设置您最喜欢的颜色 无数的通知选项,让您再也不会错过任何重要信息 采用 Windows 11 和 macOS 风格的全新圆角设计 神奇的移动指标面板 FX Power 主要功能 所有主要货币的完整强势历史 所有时间框架内的货币强弱历史 所有经纪商和图表的计算结果完全相同 100% 可靠的实时计算 -> 无重绘 可通过下拉列表选择分析时段 通过自定义模式单独配置分析时段 可在一个图表中使用多个实例 可移动 FX Power 显示屏(通过拖放) 适用于高分辨率 QHD、UHD 和 4K 显示器 自动终端配置 针对平板电脑
AT Forex Indicator MT5
Marzena Maria Szmit
5 (4)
The AT Forex Indicator MT5 is a sophisticated trading tool designed to provide traders with a comprehensive analysis of multiple currency pairs. This powerful indicator simplifies the complex nature of the forex market, making it accessible for both novice and experienced traders. AT Forex Indicator uses advanced algorithms to detect trends, patterns and is an essential tool for traders aiming to enhance their forex trading performance. With its robust features, ease of use, and reliable signal
FX Volume MT5
Daniel Stein
4.94 (17)
通过 mql5 和 Telegram 上 的 " 晨间简报 "获取每日市场更新,包括详细信息和屏幕截图 ! 外汇交易量(FX Volume)是第一个也是唯一一个从经纪商角度真正洞察市场情绪的交易量指标。 直接在您的图表上看到这些信息是真正改变游戏规则和突破性的交易解决方案。 受益于独特的市场数据洞察,如 比率(Ratios )显示货币多头和空头头寸的比率(百分比 比率变化 显示所选时间段内的多头比率及其百分比变化 总交易量 显示货币的总交易量(多头和空头),以手为单位 多头 交易量显示货币所有多头头寸的交易量 空头 交易量显示所有货币空头头寸的交易量 净多头 显示净多头交易量,即所有多头头寸减去所有空头头寸(以手为单位)。 净多头百分比 显示货币净多头交易量的变化 请阅读我们的基本教程 -> "如何使用外汇交易量进行交易 " 获取更多信息,如常见问题、交易技巧和教程视频,请访问我们的 外汇交易量公共信息频道 请 安装并运行 SI Connect 以建立与我们数据中心的持续连接 背景信息 我们都知道,外汇是一个分散的市场。这就是为什么我们必须打破常规思维,开发一个独
该仪表盘显示所选符号的最新可用谐波形态,因此您可以节省时间并提高效率 /  MT4 版本 。 免费指标:  Basic Harmonic Pattern 指标列 Symbol:   显示所选符号 Trend:     看涨或看跌 Pattern:    形态类型(Gartley、蝴蝶、蝙蝠、螃蟹、鲨鱼、Cypher 或 ABCD) Entry:     入口价格 SL: 止损价 TP1: 第一止盈价 TP2: 第二次获利价格 TP3: 第三次获利价格 Current price:    当前价格 Age (in bars):   最后绘制的模式的年龄 主要输入 Symbols :   从 "28 种主要货币对 "或 "选定符号 "中选择。 Selected Symbols :   希望监控的符号,用逗号分隔("EURUSD,GBPUSD,XAUUSD")。如果您的经纪商为货币对设置了后缀或前缀,您必须在以下两个参数中添加(货币对前缀或货币对后缀)。 Max Iteration:   调整模式的最大迭代次数(如果该值越小,则模式越少,性能越快;如果该值越大,则模式越多,性能
TPSpro RFI Levels MT5
Roman Podpora
5 (8)
Reversal First Impulse levels (RFI)      INSTRUCTIONS        RUS       -       ENG              R ecommended to use with an indicator   -   TPSpro  TREND PRO -  Version MT4                 A key element in trading is zones or levels from which decisions to buy or sell a trading instrument are made. Despite attempts by major players to conceal their presence in the market, they inevitably leave traces. Our task was to learn how to identify these traces and interpret them correctly. Main functi
Trend Screener Pro MT5
STE S.S.COMPANY
4.88 (66)
使用趋势筛选指标释放趋势交易的力量:由模糊逻辑和多货币系统提供支持的终极趋势交易解决方案! 使用趋势筛选器(由模糊逻辑提供支持的革命性趋势指标)提升您的趋势交易。 它是一个强大的趋势跟踪指标,结合了超过 13 种高级工具和功能以及 3 种交易策略,使其成为使您的 Metatrader 成为趋势分析器的多功能选择。 限时优惠:趋势筛选指标终身仅需 50 美元。 ( 原价 125$ ) (优惠延长) 体验趋势筛选器 100% 无需重新绘制的准确性,确保您的交易决策不受过去价格变化的影响。 释放多时间框架和多货币功能的多功能性,使您能够以无与伦比的信心在外汇、商品、加密货币和指数领域进行交易。 利用 Trend Screener 的综合策略套件增强您的交易: - 趋势跟踪策略和趋势延续策略 :趋势筛选器的趋势跟踪策略提供清晰的趋势延续信号,让您有效捕捉趋势走势并管理风险。 - 反转策略和早期入场点策略 :趋势筛选器的反转策略可检测市场方向的潜在变化,使您能够预测趋势反转并利用疲弱的市场趋势。通过早期入场点,您可以在潜在的趋势变化之前定位自己 获取可观的利润。 - 倒卖策略: 趋势筛选器的倒卖
介绍     Quantum Breakout PRO   ,突破性的 MQL5 指标,正在改变您交易突破区域的方式!由拥有超过13年交易经验的资深交易员团队开发,     量子突破 PRO     旨在通过其创新和动态的突破区域策略将您的交易之旅推向新的高度。 量子突破指标将为您提供带有 5 个利润目标区域的突破区域的信号箭头,以及基于突破框的止损建议。 它既适合新手交易者,也适合专业交易者。 量子 EA 通道:       点击这里 重要的!购买后请私信我领取安装手册。 建议: 时间范围:M15 货币对:GBPJPY、EURJPY、USDJPY、NZDUSD、XAUUSD 账户类型:ECN、Raw 或 Razor,点差极低 经纪商时间:GMT +3 经纪商:IC Markets、Pepperstone with Raw 和 Razor 的点差最低 规格: 不重漆! 最多 5 个建议利润目标区域 建议止损水平 可定制的盒子。您可以设置自己的 Box Time Start 和 Box Time End。 接触 如果您有任何疑问或需要帮
Trend Sensor MT5
Yuriy Lyachshenko
该指标显示最合适的进入和退出点。它还显示所有信号的统计数据,以便更好地分析交易。 在这个指标的帮助下,你将能够更好地了解市场。 一旦趋势的力量开始减弱(这将显示在面板上),趋势线将引向水平位置 - 这是退出交易的信号。或者你可以在达到平均/中值利润水平时退出。 该指标是我自2010年以来的交易经验的结晶。 MT4的指标版本 特点 这个指标不会重新绘制。印在历史图表上的东西也将被实时打印出来。 它可以用于交易任何资产:加密货币、股票、金属、指数、商品和货币。 在所有的时间框架上都可以工作。 进入的信号出现在新蜡烛的开端。 退出交易的信号是暂定的,因为通常你可以用更大的利润关闭交易。 在左上方有一个详细的交易统计面板,它可以被最小化。 在M1到W1的时间框架上,一次显示趋势的方向和它的力量。 有一个轻量级的代码,所以它不需要加载,也不会降低终端的速度。 使用一个特殊的公式计算移动平均线,它决定了趋势的方向。 为了不错过交易的信号,你可以在警报窗口和推送中收到通知。 适用于所有级别的用户,从初学者到专家。 统计小组 取自信号历史的天数。 提供统计的信号总数。 盈利和亏损信号
PZ Day Trading MT5
PZ TRADING SLU
2.83 (6)
该指标仅使用价格行为分析和donchian渠道以锯齿形检测价格反转。它是专门为短期交易而设计的,根本不需要重新粉刷或补漆。对于精明的交易者来说,这是一个绝佳的工具,旨在增加他们的运作时间。 [ 安装指南 | 更新指南 | 故障排除 | 常见问题 | 所有产品 ] 极易交易 它在每个时间段都提供价值 实施自我分析统计 它实现了电子邮件/声音/视觉警报 基于可变长度的突破和拥挤区域,该指标仅使用价格行为来选择交易并对市场快速做出反应。 显示过去信号的潜在利润 该指标分析其自身的质量和性能 突围的损失突出显示并解决 该指标是不可重涂和不可重涂的 该指标将帮助盘中交易者不要错过单个价格反转。但是,并非所有价格反转都是一样的,也不是具有相同的可行质量。决定要突破哪些突破而忽略哪些取决于交易者的良好判断。 如何解释统计数据 该指标研究其自身信号的质量,并在图表上绘制相关信息。将分析每笔交易,并在图表的左上角显示总体历史结果,这使您可以针对任何给定的工具和时间范围自行优化指标参数。每个乐器和时间表都有其自己的最佳设置,您可以自己找到它们。 最大优惠交易:对于任何给定的交易,MFE都是
PZ Trend Trading MT5
PZ TRADING SLU
3.67 (3)
许多盈利交易者不仅知道如何识别市场趋势,而且也能把握趋势建立后的交易机会。 Pz 趋势交易 指标设计用来在趋势行情中尽可能的赚取利润。 已建立的趋势提供了一揽子交易机会,但大多数趋势交易指标完全忽视了它们,让交易者在趋势行情时完全不知道该如何做!一般趋势指标只通知有关的趋势变化,但根本不足以得到卓越的回报. Pz 趋势交易 指标比一般趋势指标显示多达 20 倍的交易 , 因为它注重所谓的市场时机。它不仅显示当前的市场趋势,也有回调,内柱线的突破和调整。它令您在趋势回调之后介入,安全的柱线内突破金字塔加仓,以及发现潜在的反转,和已知的调整。 趋势改变 一个趋势改变在市场方向变化时发生。趋势变化在图表上用带数字的彩色圆圈显示。蓝色 (1) 信号为上涨开始, 而红色 (1) 信号为下跌开始。趋势变化并非评估当前价格动作的结果, 它意味着交易设置是不定时地。如果您正确使用本指标, 在趋势变化时, 您将将已经入场 (参看下面的调整)。 回调 但凡趋势在运动中,行情上下抖动,盈利者收割利润,且其它参与者入场。趋势回调代表好的买入机会,通常是由主力获利离场导致。如果行情在回调后回归上行, 指
该仪表盘可根据您对所选符号的交易策略,以剥头皮和长期模式在图表上发现并显示供需区。此外,仪表盘的扫描模式可帮助您一目了然地检查所有需要的符号,不错过任何合适的仓位/ MT4 版本 免费指标: Basic Supply Demand 功能 允许您查看多个货币对的交易机会,为您提供所有货币对的清晰简明视图,并根据其与供需区的接近程度进行排序 可定制设置,从颜色到检测参数,满足您的特定需求 主要输入 Indicator mode : 选择指标模式或具有新功能的面板模式 Symbols : 从 "28 种主要货币对 "或 "选定符号 "中进行选择 Selected Symbols : 您希望监控的符号,用逗号分隔("EURUSD,GBPUSD,XAUUSD")。如果您的经纪商对货币对有后缀或前缀,您必须在以下两个参数中添加(货币对前缀或货币对后缀) Trading Style : 选择剥头皮或长期模式 Allowed Deviation : 该参数允许修改需求或供应区域的精确度(数值越小,精确度越高) Zone   thickness : 通过该参数可以修改需求和供应
Blahtech Supply Demand MT5
Blahtech Limited
4.54 (13)
Was: $299  Now: $99   Supply Demand uses previous price action to identify potential imbalances between buyers and sellers. The key is to identify the better odds zones, not just the untouched ones. Blahtech Supply Demand indicator delivers functionality previously unavailable on any trading platform. This 4-in-1 indicator not only highlights the higher probability zones using a multi-criteria strength engine, but also combines it with multi-timeframe trend analysis, previously confirmed swings
MTF Supply Demand Zones MT5
Georgios Kalomoiropoulos
下一代自动化供需区。适用于任何图表的创新算法。所有区域都是根据市场的价格行为动态创建的。 两种类型的警报 --> 1) 当价格触及区域时 2) 当新区域形成时 你不会再得到一个无用的指标。您将获得一个完整的交易策略和经过验证的结果。     新的功能:     价格触及供需区时发出警报     创建新的供应/需求区时发出警报     推送通知警报     以点为单位的区域宽度标签     关于 MTF 的又一个时间表。因此,现在您将能够看到高于当前 3 个时间帧,而不是高于当前 2 个时间帧     启用/禁用警报/区域/MTF 功能的按钮 您获得的优势:     消除交易中的情绪。     客观化您的交易条目。     通过高概率设置提高您的利润。     节省绘图区域的时间。     像专业人士一样交易金融市场。     任何市场的即时多时间框架分析。 你在图表上看到了什么?     蓝色和红色矩形是当前时间范围的供需区。     虚线
Blahtech Market Profile MT5
Blahtech Limited
5 (9)
Was: $249  Now: $99   Market Profile defines a number of day types that can help the trader to determine market behaviour. A key feature is the Value Area, representing the range of price action where 70% of trading took place. Understanding the Value Area can give traders valuable insight into market direction and establish the higher odds trade. It is an excellent addition to any system you may be using. Inspired by Jim Dalton’s book “Mind Over Markets”, this indicator is designed to suit the
Volume by Price MT5
Brian Collard
3.6 (5)
The Volumebyprice.com Indicator for MetaTrader 5 features Volume Profile and Market Profile TPO (Time Price Opportunity). Volume and TPO histogram bar and line charts. Volume Footprint charts. TPO letter and block marker collapsed and split structure charts. Static, dynamic and flexible range segmentation and compositing methods with relative and absolute visualizations. Session hours filtering and segment concatenation with Market Watch and custom user specifications. Graphical layering, posit
[ MT4 Version ] Only the next 10 units at current price! Final price: $299 Are you tired of spending months on demo or live accounts to test your trading strategies? The Backtesting Simulator is the ultimate tool designed to elevate your backtesting experience to new heights. Utilizing Metatrader historical symbol information, it offers an unparalleled simulation of real market conditions. Take control of your testing speed, test ideas quickly or at a slower pace, and witness remarkable improve
PZ Harmonacci Patterns MT5
PZ TRADING SLU
3.25 (4)
可以说,这是您可以为MetaTrader平台找到的最完整的谐波价格形成自动识别指标。它检测19种不同的模式,像您一样认真对待斐波那契投影,显示潜在的反转区域(PRZ),并找到合适的止损和获利水平。 [ 安装指南 | 更新指南 | 故障排除 | 常见问题 | 所有产品 ] 它检测19种不同的谐波价格形态 它绘制了主要,衍生和互补的斐波那契投影(PRZ) 它评估过去的价格走势并显示每个过去的形态 该指标分析其自身的质量和性能 它显示合适的止损和获利水平 它使用突破来表明合适的交易 它在图表上绘制所有样式比率 它实现了电子邮件/声音/视觉警报 受斯科特·M·卡尼(Scott M. Carney)的书的启发,该指标旨在满足最纯粹和最熟练的交易者的需求。但是,它采取了一种使交易更容易的方式:在向交易发出信号之前,它会等待Donchian朝正确方向突破,从而使交易信号非常可靠。 斐波那契投影与向量无关 它实现了电子邮件/声音/推送警报 它绘制了ABCD投影 重要提示: 为了符合 Scott M. Carney先生 的商标申诉,某些图案名称已重命名为不言自明的替代方式, Scot
TPA True Price Action indicator reveals the true price action of the market makers through 100% non-repainting signals strictly at the close of a candle! TPA shows entries and re-entries, every time the bulls are definitely stronger than the bears and vice versa. Not to confuse with red/green candles. The shift of power gets confirmed at the earliest stage and is ONE exit strategy of several. There are available now two free parts of the TPA User Guide for our customers. The first "The Basics"
XQ Indicator MetaTrader 5
Marzena Maria Szmit
5 (1)
Step into the realm of Forex trading with confidence and precision using XQ, a cutting-edge Forex indicator designed to elevate your trading game to unprecedented heights. Whether you're a seasoned trader or just stepping into the world of currency exchange, XQ Forex Indicator empowers you with the insights and signals needed to make informed trading decisions. The signal conditions are a combination of three indicators, and XQ Forex Indicator only display  medium and long-term trends . The ind
Advanced Supply Demand MT5
Bernhard Schweigert
4.53 (15)
任何新手或专业交易者的最佳解决方案! 该指标是一款独特、高质量、且价格合理的交易工具,因为我们已经整合了许多专有功能和新公式。 依据此更新,您将能够显示双重时间帧区域。 您不仅可以显示一个较高的时间帧,还可以同时显示图表时间帧,加上更高的时间帧:显示嵌套时区。 供需双方所有交易者都会喜欢它。 :) 重要信息披露 高级供需的最大潜力,请访问 https://www.mql5.com/zh/blogs/post/720245   想象您的交易如何得以改善,是因为您能够精准定位入场或目标位吗? 构建于新的底层算法,它可以更轻松地识别出买卖双方之间的潜在失衡。 这是因为它以图形方式展示供需最强劲区域,及其过去的表现(显示旧区域)。 这些功能旨在帮助您更轻松地发现最佳入场区域和价位。 现在您可以针对您的交易品种和时间帧来优化和编辑区域强度! 高级供需指标适用于所有产品和时间帧。 它是一个新的公式,非常新的功能是两个区域强度函数可由用户输入进行调整! 这在交易中是一大优势。 当您学习如何使用专有功能,例如带有价格游离最小 X 因子的区域强度时,您能够判断该区域强劲与否。 供需区域用作警报触发器
Gold Trend 5
Sergei Linskii
5 (1)
黄金趋势 - 这是一个很好的股票技术指标。该指标算法分析资产的价格走势,并反映波动性和潜在进入区。 最佳指标信号: - 卖出 = 红色柱状图 + 红色短指针 + 同方向黄色信号箭头。 - 买入 = 蓝色柱状图 + 蓝色多头指针 + 同方向水蓝色信号箭头。 该指标的优点 1. 该指标生成的信号准确度高。 2. 只有当趋势发生变化时,才能重新绘制已确认的箭头信号。 3. 您可以在任何经纪商的 MetaTrader 5 交易平台上进行交易。 4. 您可以交易任何资产(货币、金属、加密货币、股票、指数等)。 5. 最好在 H1 时间框架(中期交易)上进行交易。 6. 在指标设置中可更改个别参数(TF、颜色等),以便每位交易者都能轻松定制适合自己的指标。 7. 该指标既可作为交易系统的主要补充,也可作为独立的交易系统使用。   注意:交易的入市准确性和盈利能力仅取决于交易者的技能。任何指标都只是交易者的助手,而非行动指南。 MetaTrader 4 黄金趋势指标版本  祝大家交易好运,稳定盈利!
RelicusRoad Pro MT5
Relicus LLC
4.83 (23)
现在$ 147(更新后增加到$ 499) - 无限帐户(PC或Mac) RelicusRoad 用户手册 + 培训视频 + 访问 Private Discord Group + VIP 身份 一种看待市场的新方式 RelicusRoad 是世界上最强大的外汇、期货、加密货币、股票和指数交易指标,为交易者提供保持盈利所需的所有信息和工具。我们提供技术分析和交易计划,帮助每一位交易者取得成功,从初学者到高级。它是一个关键的交易指标,可以提供足够的信息来预测未来的市场。我们相信一个完整的解决方案,而不是图表上几个没有意义的不同指标。这是一个多合一指标,显示无与伦比且非常准确的信号、箭头 + 价格行为信息。 RelicusRoad 基于强大的人工智能,提供缺失的信息和工具来教育您并使您成为交易专家,成为成功的交易者。 几乎所有技术指标都滞后,这意味着它们只能报告已经发生的事情。因此,他们只确认您过去可以看到的价格已经在哪里。我们相信领先指标可以预测未来价格,而无需重新绘制,也不要过度依赖可能改变并导致重新绘制的滞后指标。如果您根据滞后指标进行交易并建立头寸,您就知道您已
Gold Venamax MT5
Sergei Linskii
3.5 (2)
Gold Venamax - 這是最好的股票技術指標。 此指標演算法分析資產的價格變動並反映波動性和潛在的進入區域。 指標特點: 這是一個帶有 Magic 和兩個趨勢箭頭塊的超級指標,可實現舒適且有利可圖的交易。 圖表上顯示用於切換方塊的紅色按鈕。 Magic 在指標設定中進行設置,以便您可以將指標安裝在顯示不同區塊的兩個圖表上。 Gold Venamax 可以放置在具有不同箭頭緩衝區(GV 和 SF)的兩個圖表上。 為此,您需要在設定中選擇不同的 Magic,例如,一個具有 Magic = 999,另一個具有 Magic = 666。接下來,您可以使用圖表上的紅色按鈕選擇箭頭緩衝區。 進入的最佳訊號 = 遵循兩個緩衝區的訊號箭頭(GV 和 SF)+ 所有三個 MA 線(紅色或藍色)的方向。 此指標的優點: 1. 此指示器產生高精度訊號。 2. 確認的箭頭訊號不會重新繪製。 3. 您可以在任何經紀商的 MetaTrader 5 交易平台上進行交易。 4. 您可以交易任何資產(貨幣、金屬、加密貨幣、股票、指數等)。 5. 在 M30 和 H1 時間範圍內
Gartley Hunter Multi
Siarhei Vashchylka
5 (7)
Gartley Hunter Multi - An indicator for searching for harmonic patterns simultaneously on dozens of trading instruments and on all possible timeframes. Manual (Be sure to read before purchasing) | Version for MT4 Advantages 1. Patterns: Gartley, Butterfly, Shark, Crab. Bat, Alternate Bat, Deep Crab, Cypher 2. Simultaneous search for patterns on dozens of trading instruments and on all possible timeframes 3. Search for patterns of all possible sizes. From the smallest to the largest 4. A
MetaTrend M5
Vahidreza Heidar Gholami
5 (2)
Meta Trend Indicator is an efficient way to forecast and detect the trend in any market. It reveals the trend, support and resistance levels, volatility and the maximum potential target, all in one indicator. To adapt to the price and to decrease consecutive trend failures, the internal trend detector algorithm studies the market and dynamically chooses the right values for the internal parameters. This indicator is a perfect trend filter for any strategy or expert advisor. Features Super Adapti
Scalping Tool for Deriv Description: This trading indicator is designed for traders specializing in scalping. It provides signals for trading in the direction of short-term price movements. The indicator is optimized for use on the M1 timeframe and supports Boom and Crash indices (300, 500, 1000). The indicator will be sold in a limited quantity. Features: Trading direction: towards short-term price movements. Filters and indicators: Reaction volume indicator: displays activity zones. Trend i
作者的更多信息
Amka Ccf
VLADISLAV AKINDINOV
5 (8)
A trend indicator is a hybrid of several well-known indicators that process data sequentially with signaling a trend change. Final processing of the AMka indicator data. The indicator is conventionally not drawing - upon restarting, it can change some of the chart data, but if you do not touch it, it will not redraw. It is possible to issue an alert, sound, send an e-mail or a message to another terminal when the trend changes.
FREE
Delta 2 symbols
VLADISLAV AKINDINOV
The indicator is designed for pair trading with 2 highly correlated instruments.  Indicator charts can be displayed as lines or histograms. There is an MTF mode, the maximum and minimum deltas for the calculated number of bars are displayed with a check for a specified minimum value. It is possible to enable the calculation of trade operations with checking the current correlation coefficient for the minimum specified, the current delta in points or percent of the maximum (minimum) delta and
Signal indicator Cma 2 Cjcf
VLADISLAV AKINDINOV
5 (5)
A signal indicator consisting of several well-known indicators that process data sequentially. 2 options - for schedule and basement. In the settings it is possible to enable alerts about the change of trend (alerts) sound, by e-mail and push. It is possible to change the colors and thickness of the lines, the colors and codes of the arrows, the number of calculation bars and separately configure the parameters included in the indicators.
FREE
Delta 2 Symbols MT5
VLADISLAV AKINDINOV
The indicator is designed for pair trading with 2 highly correlated instruments.  Indicator charts can be displayed as lines or histograms. There is an MTF mode, the maximum and minimum deltas for the calculated number of bars are displayed with a check for a specified minimum value. It is possible to enable the calculation of trade operations with checking the current correlation coefficient for the minimum specified, the current delta in points or percent of the maximum (minimum) delta and
Advisor for semi-automatic trading with a virtual multi-level trail of take profit and stop loss, a trail of target profit, martingale functions, manual opening of orders, managing third-party orders, counting trading instruments, displaying current information and statistics on a chart. It is possible to set several levels of trailing take profit and stop loss and to each level to assign the percentage of partial closing of the order. The percentage of the lot when closing the level is calculat
The indicator is a mathematical analog of a two-level RC (resistor-capacitor) filter. On the chart (default colors), the red line is the standard terminal Moving Average, the values ​​of which are filtered by the first level filter (yellow line) and then by the second level filter (blue line). Moving Average sets the preliminary smoothing of the price series.  The indicator has the ability to use the sticking together of any combination of its own charts among themselves, if they are at a dis
Trend Deviation
VLADISLAV AKINDINOV
Trend indicator with calculation of dynamic levels and signaling their intersection. Description of input parameters: StepTF = true; - Calculation of the indicator by closing the bar (true) or by each tick (false) BarsCount = 300; - Number of settlement bars Price = PRICE_CLOSE; - Type of price used TimeFrame = PERIOD_CURRENT; - Estimated timeframe TrendPeriod = 9; - Trend calculation period TrendDeviations = 4.9; - coefficient of deviation PeriodTrendSmooth = 1; - Trend smoothi
MEA2RTEn
VLADISLAV AKINDINOV
The adviser works on the basis of terminal indicators. It can work in martingale mode if you set the number of unidirectional orders to be greater than 1 and adjust the lot coefficients and the step of opening the knees, which can be opened taking into account the indicator signal. If the adviser is launched on several instruments and the comments of the orders are the same, then you can limit the number of simultaneously trading advisers - the advisers themselves will track how much they are c
Arrow indicator of trend reversal with 2-level signaling and multi timeframe. The indicator line consists of 4 colors, indicating the divergence level and possible trend reversals. Light arrows indicate a weak trend, dark arrows indicate a strong one. Sensitivity levels and steps are set in the settings. Signals are output to the mailbox and mobile terminal.
The Expert Advisor trades on a trend reversal on any instrument and timeframe. Testing was carried out on the H4 timeframe. Trades are not frequent and therefore, to increase the number of trades, it is advisable to put on several instruments. To control the number of simultaneously trading advisors, a limit for trading symbols is set and advisors must have the same order comments. Closing deals can be done in virtual mode (preferably). There are information and statistics panels. Indicator base
CCi indicator with dynamic levels based on the standard MA, taken as the basis for reading the levels, and modified data of the standard CCi relative to the MA. The input parameter CutCCi, if greater than 0, limits the vertical drawing of the CCi graph, but does not affect the calculations. There are 3 options for displaying arrows: arrows when crossing levels to exit the level zone - trend, arrows to return after exiting the level zone - reverse and crossing the zero level (red MA line). You ca
Growth and trend reversal indicator. It does not redraw in the bar calculation mode and can redraw on the 0th bar in the tick calculation mode. The trend line and level lines with their own settings are calculated separately. There are 2 types of arrows - for the intersection of trend lines and the reverse intersection of trend lines (reversal). The arrows are buffer and you can output signals to the Expert Advisor. The arrows can be duplicated with a sound signal, a message from the terminal,
Deviation trend indicator
VLADISLAV AKINDINOV
5 (1)
Indicator of trend deviation with a static level. The deviation coefficient is set for the trend histogram. Signals are the intersection of the level trend histogram in the direction of the trend or during a trend reversal - the option is selected in the indicator settings by the "Revers" parameter. There are all the necessary settings for the design of the indication and sending messages to mail or a mobile terminal. All input parameters have an intuitive name. Analog for MT5: https://www.mql5
CCi MA Trend
VLADISLAV AKINDINOV
The indicator consists of a base of the standard CCI and levels calculated on the basis of MAs, which move following the price. To strengthen the trend movement, the deviation coefficient is used. To exclude triggering in a flat, the minimum trend limiter is used. Signal arrows are displayed on the indicator chart and the price chart - everything is turned off. There is an arrow trigger function - the arrows alternate when it is turned on. You can display signals on a chart, on e-mail and on a m
Multi Closer MT4
VLADISLAV AKINDINOV
The utility is designed to control all account orders with the ability to automatically close them by: profit, breakeven or trailing profit in points separately for each order separately profit, breakeven or trailing profit in points for buy orders of each symbol profit, breakeven or trailing profit in points for sell orders of each symbol profit, breakeven or trailing profit in points for buy+sell orders of each symbol profit, breakeven or trailing profit in points for the entire account as a
The Expert Advisor is designed for pair trading with 2 instruments with high positive or negative correlation. Instrument lots are balanced automatically depending on the tick value of the instrument, and therefore it is advisable to use the base lot of at least 0.05. The function of refills is built-in, taking into account the number of knees and the coefficients of multiplication and addition of lots. Trades are opened when there is a discrepancy by a specified distance in points of instrument
The Expert Advisor is designed for pair trading with 2 selected instruments with automatic calculation of the correlation coefficient and determination of one of 8 possible entries by 4 for positive and negative correlation. The inputs used are set in the settings: 1 and 3 for trading for a fall in the delta between instruments, 2 and 3 for trading for a rise in the delta (a more dangerous trading option). There are trade control buttons, information and statistical panels. There is a wide range
Trend reversal expert
VLADISLAV AKINDINOV
The Expert Advisor is based on a proprietary triple indicator. Each of the 3 parts of the indicator can be disabled and individually configured. Initially, it was supposed to enter trade at a trend reversal, but you can set up an entry along the trend. It is possible to control the main functions using the buttons on the chart, including opening positions manually. There are grid functions with the total profit of all unidirectional positions (for hedging accounts) with martingale functions (opt
Deviation trend
VLADISLAV AKINDINOV
Indicator of trend deviation with a static level. The deviation coefficient is set for the trend histogram. Signals are the intersection of the level trend histogram in the direction of the trend or during a trend reversal - the option is selected in the indicator settings by the "Revers" parameter. There are all the necessary settings for the design of the indication and sending messages to mail or a mobile terminal. All input parameters have an intuitive name. Analog for MT4: https://www.mql5.
Signal scanner MT5
VLADISLAV AKINDINOV
The scanner is designed to scan signal buffers of indicators (arrows) and display the nearest signal bar on the panel in color and digital display. Symbols to be scanned, time frames and the number of bars to be scanned are specified, starting from the current (0th) bar. There is also a complex signal, which indicates a list of timeframes on which the indicator signal must match.   You can collapse the indicator by clicking the left mouse button on the upper left corner of the panel (name)
Extremum levels
VLADISLAV AKINDINOV
此指標顯示前一天、前一周和前一個月的最高價和最低價。 旨在確定極值點的突破並確定進入交易的方向。 為了更準確地確定反轉水平,您可以顯示斐波那契水平。 也可以在最高價和最低價之間的空間上進行繪製,以更清楚地顯示上一個計費週期的價格變動。 指示當前蠟燭(柱)關閉之前的時間。 2.0 版在鋸齒形上新增了 3 個反轉等級的訊號,並為每個等級提供警報。 This indicator shows the maximum and minimum prices of the previous day, week and month. Designed to identify breakouts of extreme points and determine the direction of entry into a trade. To more accurately determine reversal levels, you can display Fibonacci levels. It can also be plotted in the space between the high an
Semi automatic expert
VLADISLAV AKINDINOV
The advisor is intended for trading on a hedging account, because trades in both directions simultaneously. In this case, you can use both trading with one order (preferably) and a grid of orders in martingale mode. In this case, built-in indicators of our own design are used. There is a limit on the number of simultaneously trading symbols. Trading can be carried out on any symbol with any time frames. The advisor has built-in functionality for manual trading. This is a panel with the abilit
Flipping expert
VLADISLAV AKINDINOV
The advisor is intended for trading on a hedging account, because trades in both directions simultaneously and reverses the direction of trade. In this case, you can use both trading with one order (preferably) and a grid of orders in martingale mode. In this case, a built-in indicator of our own design is used. There is a limit on the number of simultaneously trading advisors. Trading can be carried out on any symbol with any time frames.
筛选:
无评论
回复评论
版本 2.0 2024.06.12
Added calculation of lots, including for CFDs.