Price Channel Mt5
- 指标
- Ruslan Latypov
- 版本: 3.0
- 激活: 10
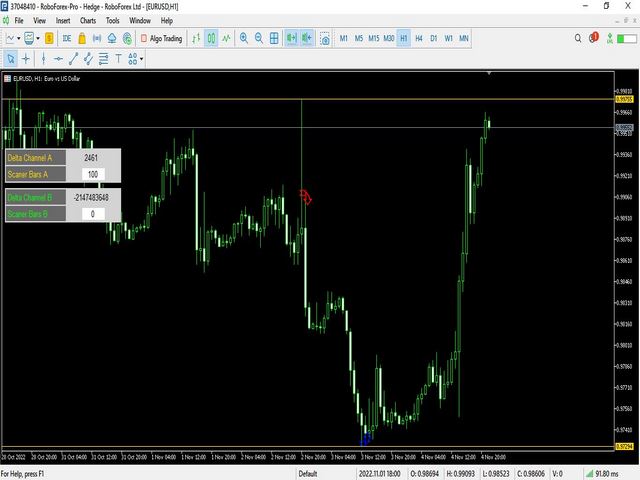
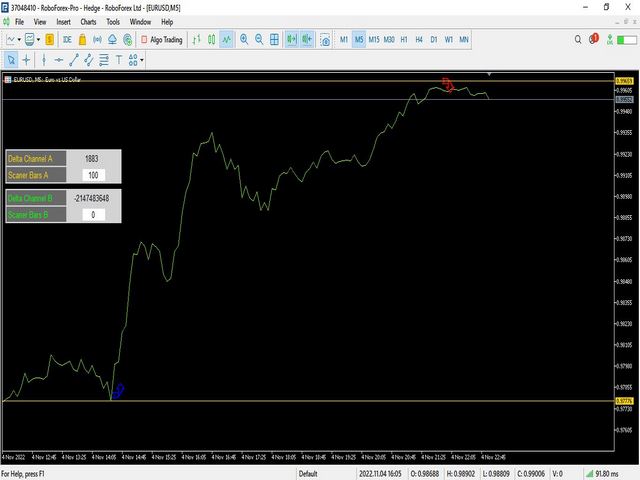
价格通道指标由两个独立的价格通道和水平价格区组成--(A/B)。该指标不断监测价格的行为和运动,以及通道水平的崩溃--(A/B),重新安排水平和固定新的极值和最小值区域。
对于以前和现在的高点和低点的分析,它不取决于每个通道的条数 - (A / B)。
该指标显示图表上每个通道的有用信息--(A/B)。
1. 分析中为每个通道指定的条数。
2. Delta - 每个通道的电平之间的距离。
1. 指标的应用实例:为了搜索和更新区域和新的本地最高和最低水平(顶部或底部),在通道-(A)中,我们指定范围-(100-500)条为例。我们不想使用通道(B),所以在通道(B)中我们表示(0)条。
-(B)通道的水平将在图表上消失,不会干扰我们。
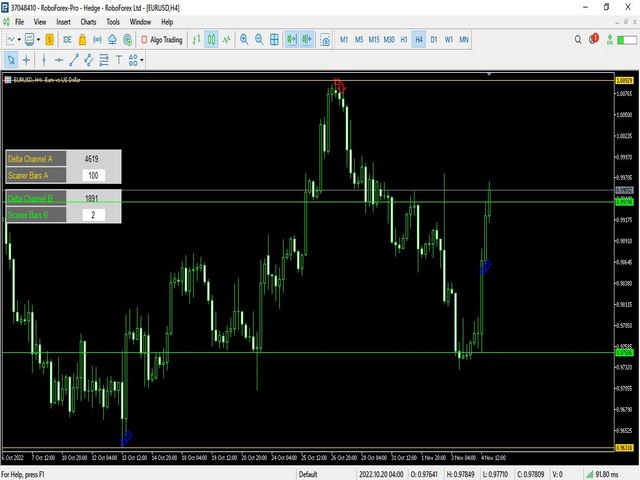
2. 指标应用实例:当跟踪价格并在狭窄的走廊中打破平坦时,在渠道(B)中我们指出例如范围(1-5)条。
我们不需要对(0)条使用通道(A)。
-(A)通道的水平将在图表上消失,不会干扰我们。
3. 指标应用实例:在通道--(A/B)中,我们可以指定不同的条形范围,为每个通道指定自己的用途。
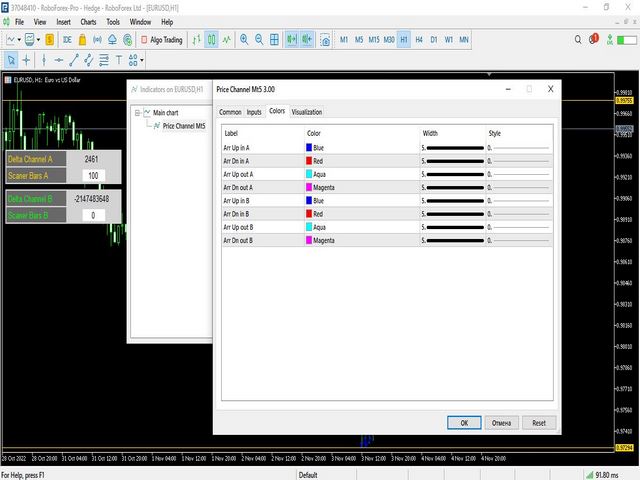
指标价格通道有八个信号缓冲区,用于编写和使用作者的专家顾问时的手动和自动交易。对于这个想法,可以作为我的作者的指标--价格通道的基础。如果你为此购买了一个指标,请给我发电子邮件,我将把所有需要的参数发给你,以便在专家顾问中调用该指标作为资源。
在通道外和通道内都有突破水平的信号--(A/B)。
对于通道(A/B)有自己独立的信号缓冲器。
SetIndexBuffer(0,ArrUpInA)。
SetIndexBuffer(1,ArrDnInA)。
SetIndexBuffer(2,ArrUpOutA)。
SetIndexBuffer(3,ArrDnOutA)。
SetIndexBuffer(4,ArrUpInB)。
SetIndexBuffer(5,ArrDnInB)。
SetIndexBuffer(6,ArrUpOutB)。
SetIndexBuffer(7,ArrDnOutB)。
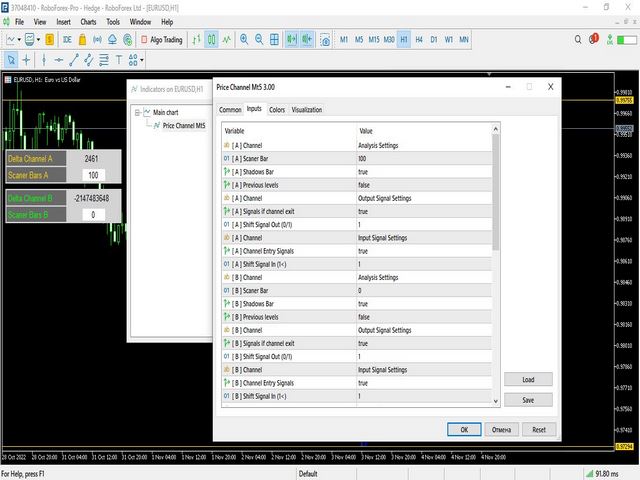
指标设置 - 价格通道。
[ A ] 频道 "分析设置
[ A ] 扫描仪条
[A] 阴影酒吧
[ A ] 以前的水平
[A] 通道 "输出信号设置
[A] 如果通道退出,则发出信号
[A] 移位信号输出(0/1)。
[ A ] 通道 "输入信号设置
[A] 通道进入信号
[A] 移位信号输入(1<)。
//---
[B] 频道 "分析设置
[ B ] 扫描仪条
[B] 阴影酒吧
[ B ] 以前的水平
[ B ] 通道 "输出信号设置
[B] 如果通道退出,则发出信号
[ B ] 移位信号输出(0/1)。
[ B ] 通道 "输入信号设置
[B] 通道进入信号
[B] 移位信号输入(1<)。
//---
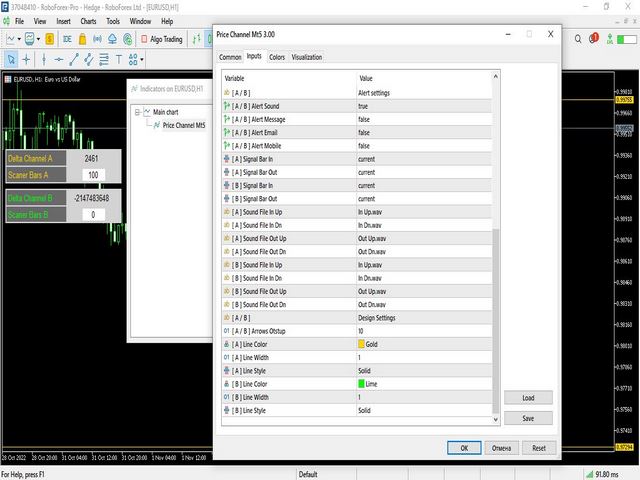
[ A / B ] "警报设置
[ A / B ] 警报声
[ A / B ] 警报信息
[A / B] 提醒电子邮件
[A / B] 警报手机
//---
[A] 信号栏输入(当前/关闭)。
[A] 信号条输出(当前/关闭)。
[ B ] 信号条输入(当前/关闭)。
[B] 信号条输出(当前/关闭)。
//---
[A] 声音文件在上
[A] 声音文件在Dn
[A] 声音文件出来了 上
[A] 声音文件输出 Dn
[B] 声音文件在上
[B] 声音文件在Dn
[B]声音文件输出向上
[B] 声音文件输出 Dn
//---
[ A / B ] "设计设置
[A / B] 箭头Otstup
[ A ] 线条颜色
[ A ] 线条宽度
[A] 线条风格
//+------------------------------------------------------------------+
谢谢你对我的创作理念和工作工具的关注!