• 概述
  • 评论
  • 评论

AIS Forest Fire Trend MT5

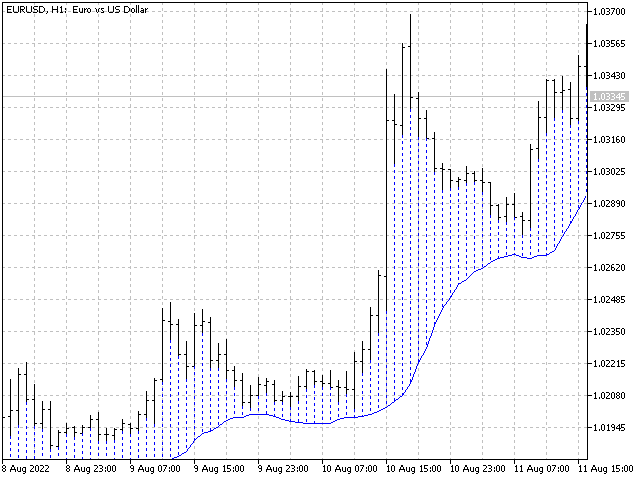
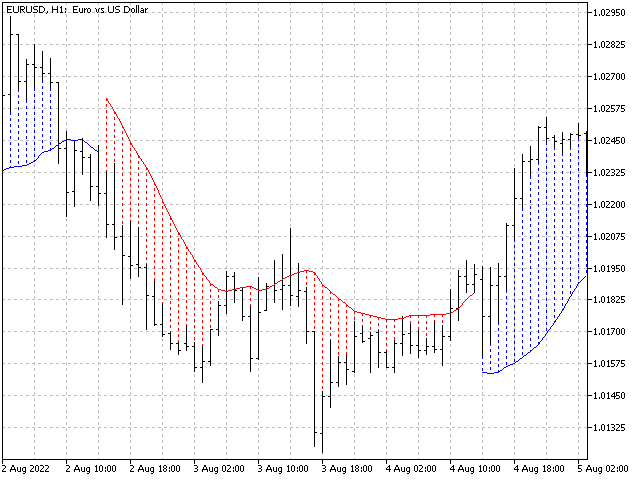
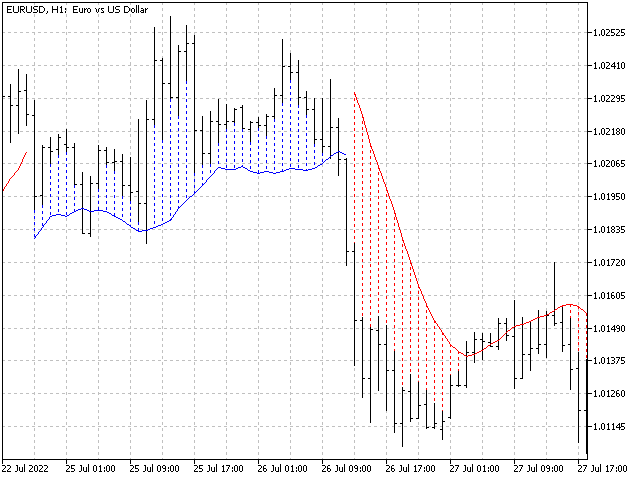
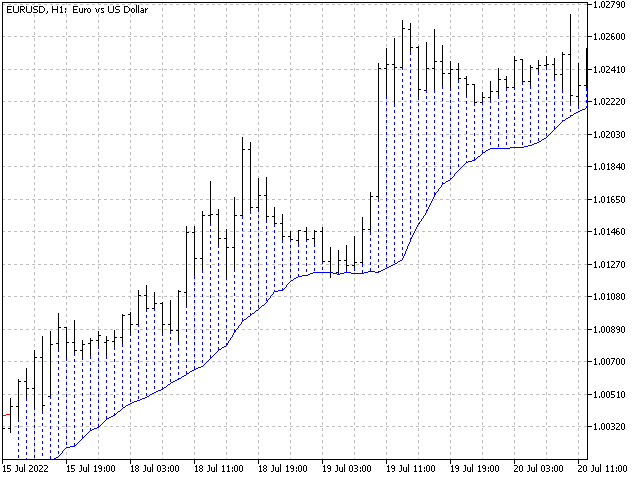
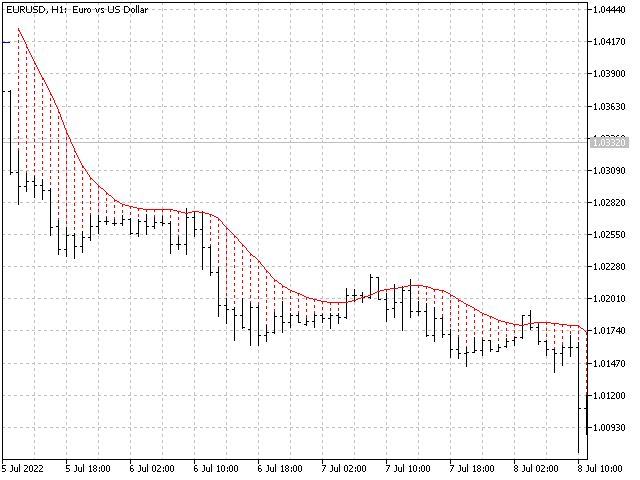
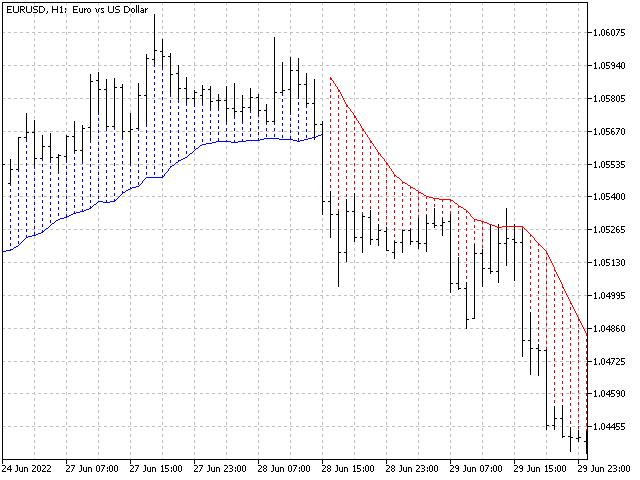
其中一个数字序列称为“森林火灾序列”。它被公认为最美丽的新序列之一。它的主要特点是该序列避免了线性趋势,即使是最短的趋势。正是这一属性构成了该指标的基础。
在分析金融时间序列时,该指标试图拒绝所有可能的趋势选项。只有当他失败时,他才会认识到趋势的存在并给出适当的信号。这种方法可以让人们正确地确定新趋势开始的时刻。然而,误报也是可能的。为了减少它们的数量,该指标添加了一个额外的过滤器。当新柱打开时会生成信号。在任何情况下都不会发生重绘。
指标参数:
  • Applied Price - 应用价格常数;
  • Period Main - 指标的主要周期,其有效值在 5 - 60 之间;
  • Period Additional - 附加周期,此参数的有效值为 5 - 40;
  • Signal Filter - 附加信号滤波器,有效值 0 - 99;
  • Alerts - 启用后,指示器会在出现新信号时提醒您;
  • Send Mail - 允许指标向电子邮件发送消息;
  • Push - 允许您发送 Push 消息。


推荐产品
Noize Absorption Index
Ekaterina Saltykova
Noize Absorption Index - is the manual trading system that measures the difference of pressure between bears forces and bulls forces. Green line - is a noize free index that showing curent situation. Zero value of index shows totally choppy/flat market.Values above zero level shows how powerfull bullish wave is and values below zero measures bearish forces.Up arrow appears on bearish market when it's ready to reverse, dn arrow appears on weak bullish market, as a result of reverse expectation.
Your Trend Friend
Luigi Nunes Labigalini
5 (1)
The trend is your friend! Look at the color of the indicator and trade on that direction. It does not  repaint. After each candle is closed, that's the color of the trend. You can focus on shorter faster trends or major trends, just test what's most suitable for the symbol and timeframe you trade. Simply change the "Length" parameter and the indicator will automatically adapt. You can also change the color, thickness and style of the lines. Download and give it a try! There are big movements w
Owl Smart Levels MT5
Sergey Ermolov
4.07 (28)
MT4版本  |   FAQ Owl Smart Levels Indicator 是一個完整的交易系統,包含 Bill Williams 的高級分形、構建正確的市場波浪結構的 Valable ZigZag 以及標記準確入場水平的斐波那契水平等流行的市場分析工具 進入市場和地方獲利。 策略的详细说明 指示灯使用说明 顾问-贸易猫头鹰助手助理 私人用户聊天 ->购买后写信给我,我会将您添加到私人聊天中,您可以在那里下载所有奖金 力量在於簡單! Owl Smart Levels 交易系統非常易於使用,因此適合專業人士和剛開始研究市場並為自己選擇交易策略的人。 策略和指標中沒有隱藏的秘密公式和計算方法,所有策略指標都是公開的。 Owl Smart Levels 允許您快速查看進入交易的信號,突出顯示下訂單的水平並向您發送有關已出現信號的通知。 優點很明顯: 清楚地顯示主要和更高時間框架的趨勢方向。 指示儀器信號的出現。 標記開單、止損設置和固定利潤的水平。 沒有多餘的,只有必要的結構! ZigZag 表示全球趨勢的方向,因此也表示貿易方向。 市場反轉點的短線清楚地表明在什麼水平上構建斐波那
Crash 1000 Scalping Indicator for the Crash 1000 Deriv Synthetic Index. Introduction The Crash 1000 Scalping Indicator is a specialized tool designed for the Crash 1000 index on the Deriv Synthetic market. This indicator is particularly useful for scalping on the M1 timeframe, helping traders to identify precise entry and exit points for buy positions. It is designed to be non-repainting, providing clear signals with audible alerts and push notifications, and is compatible with mobile devices th
Fibo Channels
Jeffrey Quiatchon
Fibo Daily Channel Indicator The  Indicator is a powerful tool for traders, providing precise daily support and resistance levels based on Fibonacci retracement and extension calculations. This indicator automatically draws key pivot points (PP, R1, R2, S1, S2) as well as additional extension levels (R3, R4, S3, S4), helping traders identify potential reversal and breakout zones with ease. It includes customizable alerts and push notifications, allowing traders to receive updates whenever the pr
ROMAN5 时间突破指标自动绘制日线的支撑和阻力突破箱体。它可帮助用户识别何处进行买入、卖出。当新信号出现时,它可发出提示和声音。它还具有发送邮件功能。您的邮件地址和 SMTP 服务器设置应该在 MetaTrader 5 的 "邮箱" 标栏里的设置窗口里指定。 蓝色向上箭头 = 买。 红色向下箭头 = 卖。 您可以使用一款我的移动止损产品,来自动移动止损,并包括设置盈亏平衡。 ROMAN5 分型移动止损   ROMAN5 抛物线SAR 移动止损 ROMAN5 布林带移动止损 ROMAN5 HeikenAshi 移动止损 ROMAN5 均线移动止损 ROMAN5 高级移动止损 如果您希望尝试 EA, 参见 ROMAN5 时间突破 EA 。 版本 1.2: 发送推送通知至移动终端。
FREE
Blahtech Market Profile MT5
Blahtech Limited
5 (9)
Was: $249  Now: $149   Market Profile defines a number of day types that can help the trader to determine market behaviour. A key feature is the Value Area, representing the range of price action where 70% of trading took place. Understanding the Value Area can give traders valuable insight into market direction and establish the higher odds trade. It is an excellent addition to any system you may be using. Inspired by Jim Dalton’s book “Mind Over Markets”, this indicator is designed to suit the
Rainbow EA MT5
Jamal El Alama
Description : Rainbow EA MT5 is a simple Expert advisor based on   Rainbow MT5 indicator witch is based on Moving average with period 34. The indicator is incorporated in the EA, therefore, it is not required for the EA to operate, but if you wish, you can download it from   my product page . The Expert Advisor settings are as follows : Suitable for Timeframes up to H1 The parameters below can be set according to your trading rules. StopLoss ( Stop Loss in pips) TakeProfit ( Take Profit in pips
LT Rainbow Trend
Thiago Duarte
5 (1)
Do you, like me, like to trade with the trend? Then this indicator will help you! Rainbow Trend is a trend indicator, which uses several Moving Averages on the chart. It measures different trend strenght zones for different periods: very long term, long term, mid term, short term and very short term. Each zone has its color, and it is possible to have sound alert when the prices leaves a zone and enters another. Its configuration is very simple. If you find any bug or have any suggestions, conta
Be notified of every color change of Heiken Ashi (HA) candles. The indicator will trigger past and new signals every time that HA candles change their colors. ( Note : this tool is based on the code of Heiken Ashi indicator developed by MetaQuotes Software Corp.) Features The signals are triggered at closing of last bar/opening of a new bar; Any kind of alerts can be enabled: Dialog Box, Email message, SMS notifications for smartphones and tablets, and Sound alerts; By default, up arrows are pl
首先,值得强调的是,这个交易工具是非重绘、非重画和非滞后的指标,非常适合专业交易。 在线课程,用户手册和演示。 智能价格行动概念指标是一个非常强大的工具,既适用于新手,也适用于经验丰富的交易者。它将超过20个有用的指标合并到一个指标中,结合了高级交易思想,如内圈交易员分析和智能资金概念交易策略。该指标侧重于智能资金概念,提供有关大型机构交易方式的见解,帮助预测它们的动向。 它在流动性分析方面尤其擅长,有助于理解机构的交易方式。它擅长预测市场趋势,并仔细分析价格波动。通过将您的交易与机构策略对齐,您可以更准确地预测市场走向。该指标多才多艺,擅长分析市场结构,识别重要的订单区块,并识别各种模式。 它擅长识别BOS和CHoCH等模式,理解动量的转变,并突出显示供需强劲的关键区域。它还擅长发现强大的不平衡,并分析价格创造更高高点或更低低点的模式。如果您使用斐波那契回撤工具,该指标可以满足您的需求。它还可以识别相等的高点和低点,分析不同的时间框架,并通过仪表板显示数据。 对于使用更高级策略的交易者,该指标提供了工具,如公平价值差指标和优惠和折扣区域的识别。它特别关注高时间框架订单区块,并
An indicator of pattern #31 ("Long Island") from Encyclopedia of Chart Patterns by Thomas N. Bulkowski. The second gap is in the opposite direction. Parameters: Alerts - show alert when an arrow appears   Push - send a push notification when an arrow appears (requires configuration in the terminal) GapSize - minimum gap size in points ArrowType - a symbol from 1 to 17 ArrowVShift - vertical shift of arrows in points   ShowLevels - show levels ColUp - color of an upward line ColDn - color of a d
Trading Utility for Forex Currency Pairs Only not for Gold  Functions Auto Lot Calculation based on Risk Auto stoploss  Auto TakeProfit Breakeven Auto Close Half % Close in percentage with respect to the PIPs Pending Orders BuyLimit Sell Limit with distances BuyStop Sell Stop    with distances Trading Informations Risk in percentage For Multiple trades Combine Takeprofit and Combine Stoplosses
US30NinjaMT5
Satyaseelan Shankarananda Moodley
US30 Ninja is a 5 minute scalping indicator that will let know you when there is a trade set up (buy or sell). Once the indicator gives the trade direction, you can open a trade and use a 30 pip stop loss and a 30 pip to 50 pip take profit. Please trade at own own risk. This indicator has been created solely for the US30 market and may not yield positive results on any other pair. 
Indicator and Expert Adviser  EA Available in the comments section of this product. Download with Indicator must have indicator installed for EA to work. Mt5 indicator alerts for bollinger band and envelope extremes occurring at the same time. Buy signal alerts occur when A bullish candle has formed below both the lower bollinger band and the lower envelope  Bar must open and close below both these indicators. Sell signal occur when A bear bar is formed above the upper bollinger band and upper
Riko Trend mt5
Nadiya Mirosh
The Riko Trend indicator is a revolutionary trend trading and filtering solution with all the important features of a trend tool built into one tool! The Riko Trend indicator is good for any trader, suitable for any trader for both forex and binary options. You don’t need to configure anything, everything is perfected by time and experience, it works great during a flat and in a trend. The Riko Trend indicator is a technical analysis tool for financial markets that reflects the current price f
This indicator obeys the popular maxim that: "THE TREND IS YOUR FRIEND" It paints a Blue line for BUY and also paints a RED line for SELL. (you can change the colors). It gives alarms and alerts of all kinds. IT DOES NOT REPAINT COLOR and can be used for all currency pairs and timeframes. Yes, as easy and simple as that. Even a newbie can use it to make great and reliable trades. https://www.mql5.com/en/market/product/115553
To download MT4 version please click here . - This is the exact conversion from TradingView: " PA-Adaptive Hull Parabolic " By "Loxx". - This is a non-repaint and light processing load indicator - You can message in private chat for further changes you need. - All input options are available. - Buffers are available for processing within EAs. - Highlight option is omitted as does not show good in Metatrader. 
Laguerre SuperTrend Clouds   adds an Adaptive Laguerre averaging algorithm and alerts to the widely popular SuperTrend indicator. As the name suggests,   Laguerre SuperTrend Clouds (LSC)   is a trending indicator which works best in trendy (not choppy) markets. The SuperTrend is an extremely popular indicator for intraday and daily trading, and can be used on any timeframe. Incorporating Laguerre's equation to this can facilitate more robust trend detection and smoother filters. The LSC uses the
Trend Monitor MT5
Pavel Zamoshnikov
4.5 (2)
The indicator generates early signals basing on ADX reading data combined with elements of price patterns. Works on all symbols and timeframes. The indicator does not redraw its signals. You see the same things on history and in real time. For better visual perception signals are displayed as arrows (in order not to overload the chart). Features The best results are obtained when the indicator works on two timeframes. For example: M30 – the indicator shows the main trend; M5 – the indicator gen
Hull Heikin Ashi Smoothed
Flavio Javier Jarabeck
Heikin Ashi candlesticks are a powerful tool for traders, offering a clear and smooth visualization of market trends. Unlike traditional candlesticks, they filter out market noise, providing a cleaner view of the market's direction and strength, which helps traders make more informed decisions. The Hull Heikin Ashi Smoothed indicator from Minions Labs takes this a step further by integrating the Hull Moving Average for enhanced smoothing and precision. This indicator not only simplifies trend id
Mine Farm
Maryna Kauzova
Mine Farm is one of the most classic and time-tested scalping strategies based on the breakdown of strong price levels. Mine Farm is the author's modification of the system for determining entry and exit points into the market... Mine Farm - is the combination of great potential with reliability and safety. Why Mine Farm?! - each order has a short dynamic Stop Loss - the advisor does not use any risky methods (averaging, martingale, grid, locking, etc.) - the advisor tries to get the most
Stratos Pali mt5
Michela Russo
5 (4)
Stratos Pali Indicator is a revolutionary tool designed to enhance your trading strategy by accurately identifying market trends. This sophisticated indicator uses a unique algorithm to generate a complete histogram, which records when the trend is Long or Short. When a trend reversal occurs, an arrow appears, indicating the new direction of the trend. Important Information Revealed Leave a review and contact me via mql5 message to receive My Top 5 set files for Stratos Pali at no cost ! Down
Renko Gold
Ignacio Agustin Mene Franco
Renko Gold! clearly indicates the floors and ceilings where it goes from 4 lines, the line below that marks the floor in green confirming with the thinnest line clarifies the purchase entry, the same is for sale, the top line marks the ceiling and the thinnest red line marks the sale, This indicator works for all temporalities! For Forex and Synthetic Indices markets! It also works for crypto markets! Good profit! World Investor.
Awesome Oscillator by Bill Williams with the ability to fine-tune and replace the averaging algorithms of the indicator, which significantly expands the possibilities of using this oscillator in algorithmic trading and brings it closer in its properties to such an indicator as the MACD. To reduce price noise, the final indicator is processed with an additional Smooth averaging. The indicator has the ability to give alerts, send mail messages and push signals when the direction of movement of th
HMA Trend Professional MT5
Pavel Zamoshnikov
4.25 (4)
Improved version of the free HMA Trend indicator (for MetaTrader 4) with statistical analysis. HMA Trend is a trend indicator based on the Hull Moving Average (HMA) with two periods. HMA with a slow period identifies the trend, while HMA with a fast period determines the short-term movements and signals in the trend direction. The main differences from the free version: Ability to predict the probability of a trend reversal using analysis of history data. Plotting statistical charts for analyzi
Celebrate Vietnamese Tet 2025 with Special Offer : ALL TOOLS  only $35 ! 通过 SuperTrend AI Clustering MT5 with Scanner ,体验人工智能的强大力量。这款革命性的交易工具适用于 MetaTrader 5 (MT5),结合了 K-means 聚类和广受欢迎的 SuperTrend 指标,帮助交易者在趋势和信号中掌握主动。 See more MT4 version at:   SuperTrend AI Clustering MT4 with Scanner See more products at:   https://www.mql5.com/en/users/ndhsfy/seller 为何此工具独树一帜 虽然传统的 SuperTrend 指标有助于检测趋势,但 SuperTrend AI Clustering 更进一步,融合了机器学习。这意味着指标不再是静态设置,而是根据实时性能指标动态调整,从而提供更准确及时的信号。 工作原理 SuperTrend AI 的工作原理
Fractal 358 Plus
Renato Fridschtein
Fractal 358 Plus is a predictive indicator that provides the clearest sight of price movements. Identifying graphic patterns such as Caixote (Crate), Pivot and Inside Candle , it shows entries and exits spots, as well as threats to your trades in the markets. It comes ready to use with B3 Mini Index (WIN$ series) and can be adjusted to use with any asset and timeframe. Fractal 358 unravels price movement Based on the Fibonacci sequence, Fractal 358 is a new and different way of reading and und
DYJ BoS
Daying Cao
DYJ BoS指标自动识别和标记市场结构转变的基本要素,包括: 结构突破(BoS):当价格出现重大波动,突破之前的结构点时检测到。 它标记了可能的上升趋势线和下降趋势线(UP&DN,也是就不断创新高和创新低),一旦价格突破这些线,标记红色(BEAR)和绿色(BULL)箭头 BoS通常发生在价格决定性地穿过之前价格行动所建立的摆动低点或摆动高点时。当价格高于波动高点或低于波动低点时,它们只是打破了之前形成的市场结构,因此被称为“打破”结构。这通常表明市场情绪和趋势方向的变化,表明现有趋势的延续或新趋势的开始。 通常,为了提高关闭准确性,建议不设置止损和止盈,结束位置一般在相同方向的下一个突破点位置   关闭 ,或者是在反方向的突破点关闭 当您获得某个品种   足够 交易的经验时,你可以使用SL=7*TP的比率, 对于外汇符号,设置TP=500(5美元/最低交易量),SL=3500(35美元 /最低交易量 );单位点数POINTS。 对于 Volatility 75 Index 指数符号,设定TP=500000(5美元 /最低交易量 ),SL=3500000(35美元 /最低交易量 )
该产品的买家也购买
Trend Screener Pro MT5
STE S.S.COMPANY
4.88 (69)
使用趋势筛选指标释放趋势交易的力量:由模糊逻辑和多货币系统提供支持的终极趋势交易解决方案! 使用趋势筛选器(由模糊逻辑提供支持的革命性趋势指标)提升您的趋势交易。 它是一个强大的趋势跟踪指标,结合了超过 13 种高级工具和功能以及 3 种交易策略,使其成为使您的 Metatrader 成为趋势分析器的多功能选择。 限时优惠:趋势筛选指标终身仅需 50 美元。 ( 原价 250$ ) (优惠延长) 体验趋势筛选器 100% 无需重新绘制的准确性,确保您的交易决策不受过去价格变化的影响。 释放多时间框架和多货币功能的多功能性,使您能够以无与伦比的信心在外汇、商品、加密货币和指数领域进行交易。 利用 Trend Screener 的综合策略套件增强您的交易: - 趋势跟踪策略和趋势延续策略 :趋势筛选器的趋势跟踪策略提供清晰的趋势延续信号,让您有效捕捉趋势走势并管理风险。 - 反转策略和早期入场点策略 :趋势筛选器的反转策略可检测市场方向的潜在变化,使您能够预测趋势反转并利用疲弱的市场趋势。通过早期入场点,您可以在潜在的趋势变化之前定位自己 获取可观的利润。 - 倒卖策略: 趋势筛选器的倒卖
Quantum TrendPulse
Bogdan Ion Puscasu
5 (11)
介绍 Quantum TrendPulse   ,这是一款终极交易工具,它将 SuperTrend   、   RSI 和 Stochastic 的强大功能整合到一个综合指标中,以最大限度地发挥您的交易潜力。该指标专为追求精准和效率的交易者而设计,可帮助您自信地识别市场趋势、动量变化以及最佳进入和退出点。 主要特点: 超级趋势整合: 轻松跟随当前的市场趋势并乘上盈利浪潮。 RSI 精度: 检测超买和超卖水平,非常适合把握市场逆转时机,可用作 SuperTrend 的过滤器 随机精度: 利用随机振荡在波动的市场中寻找隐藏的机会, 用作超级趋势的过滤器 多时间范围分析: 从 M5 到 H1 或 H4,在不同时间范围内关注市场动态。 可定制的警报: 当您的自定义交易条件得到满足时收到通知,这样您就不会错过任何交易。 无论您是新手还是经验丰富的交易员,   Quantum TrendPulse 都能为您提供所需的优势,帮助您增强策略并自信地进行交易。借助这一强大的指标,将洞察力转化为利润 — 掌控您的交易! ***购买 Quantum TrendPulse,即可免费获得 Quantum Tr
FX Volume MT5
Daniel Stein
4.82 (17)
FX Volume:从经纪商视角洞察真实市场情绪 简要概述 想要提升您的交易策略? FX Volume 可提供零售交易者和经纪商的持仓实时数据——远早于诸如 COT 之类的延迟报告。不论您希望获得持续稳定的收益,还是想在市场中多一分制胜的砝码, FX Volume 都能帮您识别重大失衡、确认突破以及完善风险管理。立即开启体验,让真实的成交量数据为您的交易决策带来革新! 1. 为什么 FX Volume 对交易者格外有用 极具准确度的早期预警 • 快速捕捉有多少交易者正在买入或卖出某个货币对——比大多数人提前一步。 • FX Volume 是 唯一 能够整合多家零售经纪商真实成交量数据并以简洁方式呈现的工具。 强力风险管理 • 及时识别多头或空头仓位的巨大不平衡,这往往预示着潜在的趋势反转,帮助您更自信地设置止损和目标位。 • 独家而真实的数据让每一次交易决策更具可靠性。 优化进场与出场点 • 发现“过度集中”的交易(大多数交易者都在同一方向),并通过真实成交量来确认突破。 • 避免依赖常见指标可能带来的误导信号,而是利用真实的实时成交量。 适配各种交易策略 • 将 FX
Golden Trend Indicator MT5
Noha Mohamed Fathy Younes Badr
4.86 (14)
Golden Trend indicator  is The best indicator for predicting trend movement this indicator never lags and never repaints and never back paints    and give  arrow buy and sell    before the candle appear  and it will help you and  will make your trading decisions clearer its work on all currencies and  gold and crypto and all time frame This unique  indicator uses very secret algorithms to catch the  trends, so you can trade using this indicator and see the trend clear on charts  manual guide and
FX Levels MT5
Daniel Stein
5 (1)
FX Levels:适用于所有市场的高精度支撑与阻力 快速概览 想要精准确定适用于任何市场(外汇、指数、股票或大宗商品)的支撑与阻力吗? FX Levels 将传统的“Lighthouse”方法与前沿的动态分析相结合,实现近乎通用的准确性。依托真实经纪商经验和自动化的每日与实时更新, FX Levels 帮助您捕捉价格反转点、设置合理的盈利目标,并自信地管理交易。立即使用,体验更准确的支撑/阻力分析如何助力您的交易更上层楼! 1. 为什么 FX Levels 对交易者非常有利 极度精准的支撑 & 阻力区 • FX Levels 专为不同经纪商提供的行情源和时间设置而设计,可生成几乎相同的价位区,解决数据不一致的常见问题。 • 这意味着无论您在哪里交易,都能获得稳定一致的水平线,为策略打下更加牢固的基础。 结合传统与先进技术 • 通过将久经考验的“Lighthouse”方法与动态分析相融合, FX Levels 不仅限于每日刷新,还可针对新的价格波动进行即时更新。 • 您可以选择经典的静态方式,或实时捕捉新出现的水平,以贴近最新的市场行为。 识别清晰的反转点 • FX Lev
TPSpro RFI Levels MT5
Roman Podpora
4.71 (17)
指示       俄罗斯 -        英语   建议 与指示器一起使用     -       TPSpro 趋势专业版 -   MT4版本       交易中的一个关键要素是做出买卖交易工具决定的区域或水平。尽管主要参与者试图隐藏他们在市场中的存在,但他们不可避免地会留下痕迹。我们的任务是学习如何识别这些痕迹并正确解释它们。 主要功能: 向卖家和买家显示活跃区域! 该指标显示所有正确的初始买入和卖出脉冲水平/区域。激活这些水平/区域后,开始寻找切入点,水平会改变颜色并填充特定阴影。此外,还会显示箭头,以便更直观地了解情况。 显示更高时间范围内的级别/区域(MTF 模式) 添加了使用更高时间间隔显示级别/区域的功能。此外,该指标还具有自动趋势检测功能(   TPSproTREND PRO   )。 用于交易的单独专业的逐步算法。 该算法专为日内交易而设计,既可顺势交易,也可逆势交易。每个活动模板均提供详细说明。 适用于多种时间范围 。 TPSpro RFI 水平指标可用于图表上的任何时间范围,从一分钟(M1)开始一直到每月(MN)。 图形和声音警报。 该指标提供图形和声音指示,
Gold Stuff mt5
Vasiliy Strukov
4.92 (173)
Gold Stuff mt5 是专为黄金设计的趋势指标,也可用于任何金融工具。 该指标不会重绘,也不会滞后。 推荐时间框架 H1。 购买后立即联系我以获得设置和个人奖励!   你可以在我的个人资料中找到它。   重要! 购买后立即与我联系,以获得说明和奖金!   您可以免费收到我们的强力支持和趋势扫描指标的副本,请私信。大部头书!   设置 绘制箭头 - 打开关闭。 在图表上绘制箭头。 警报 - 打开关闭声音警报。 电子邮件通知 - 打开关闭。 电子邮件通知。 Puch-notification - 打开关闭。 推送通知。 接下来,调整色域。 Gold Stuff mt5 是专为黄金设计的趋势指标,也可用于任何金融工具。 该指标不会重绘,也不会滞后。 推荐时间框架 H1。 购买后立即联系我以获得设置和个人奖励!   设置 绘制箭头 - 打开关闭。 在图表上绘制箭头。 警报 - 打开关闭声音警报。 电子邮件通知 - 打开关闭。 电子邮件通知。 Puch-notification - 打开关闭。 推送通知。 接下来,调整色域。
FX Power MT5 NG
Daniel Stein
5 (9)
FX Power:分析货币强度,助您做出更明智的交易决策 概述 FX Power 是一款专业工具,帮助您全面了解主要货币和黄金在任何市场条件下的真实强度。通过识别强势货币用于买入,弱势货币用于卖出, FX Power 简化了交易决策,并帮助您发现高概率的交易机会。不论您是想跟随趋势还是通过极端的 Delta 值预测反转,这款工具都能完美适应您的交易风格。别再盲目交易——用 FX Power 让您的交易更加智慧。 1. 为什么 FX Power 对交易者极具价值 实时货币和黄金强度分析 • FX Power 实时计算并显示主要货币和黄金的相对强度,助您全面了解市场动态。 • 监控领先或落后资产,轻松识别值得交易的货币对。 全面的多时间框架视图 • 跟踪短期、中期和长期时间框架的货币和黄金强度,以便将您的交易策略与市场趋势保持一致。 • 无论是快进快出的短线交易还是更长期的投资策略, FX Power 都能为您提供所需的信息。 Delta 动态分析用于趋势和反转 • 极端 Delta 值常常预示反转机会,而平缓的 Delta 变化则确认趋势延续。 • 使用 Delta 分析,轻
Entry Points Pro for MT5
Yury Orlov
4.45 (127)
这款指标用于 MT5,可提供准确的入场交易信号,且无重绘。 它可应用在任何金融资产:外汇、加密货币、贵金属、股票、指数。 它将提供极其精准的评估,并告诉您何时开仓和平仓的最佳时机。 观看 视频 (6:22),其中包含一个仅处理单一信号的示例,该信号即可值回指标购价! 大多数交易者在 Entry Points Pro 指标的帮助下,在第一个交易周内即改善了他们的交易结果。 订阅我们的 Telegram 群 ! Entry Points Pro 指标的益处。 入场信号无重绘 如果信号出现,并得到确认,则它不会再消失;不像是重绘指标,它会导致重大的财产损失,因为它们可以在显示信号后再将其删除。 无差错开仓 指标算法可令您找到入场交易(买入或卖出资产)的理想时机,从而提高每位交易者的成功率。 Entry Points Pro 可操作任何资产 它允许您在 MT5 平台上交易任何经纪商的加密货币、股票、贵金属、指数、大宗商品和货币。 提供任何方向的信号 Entry Points Pro 指标提供针对任意价格走势的入场交易信号 - 上涨、下跌或横盘(横向)。 最大盈利潜力 离场信号
Matrix Arrow Indicator MT5
Juvenille Emperor Limited
5 (13)
矩阵箭头指标 MT5   是一种独特的 10 合 1 趋势,遵循   100% 非重绘多时间框架指标 ,可用于所有符号/工具: 外汇 、 商品 、 加密货币 、 指数 、 股票 。 Matrix Arrow Indicator MT5 将在其早期阶段确定当前趋势,从多达 10 个标准指标中收集信息和数据,它们是: 平均定向运动指数 (ADX) 商品渠道指数 (CCI) 经典 Heiken Ashi 蜡烛 移动平均线 移动平均收敛散度 (MACD) 相对活力指数 (RVI) 相对强弱指数 (RSI) 抛物线SAR 随机振荡器 威廉姆斯的百分比范围 当所有指标给出有效的买入或卖出信号时,相应的箭头将打印在图表上,在下一根蜡烛/柱线开盘时,指示强劲的上升趋势/下降趋势。用户可以选择使用哪些指标,并可以单独调整每个指标的参数。 Matrix Arrow Indicator MT5 仅从选定的指标中收集信息,并仅根据其数据打印箭头。   Matrix Arrow Indicator MT5   还可以为所有新信号发送终端、推送通知或电子邮件警报。无论您是黄牛、日内交易者还是波段交易者, Mat
FX Dynamic:借助可定制的 ATR 分析,追踪波动率与趋势 概述 FX Dynamic 是一款强大的工具,通过计算平均真实波幅(ATR)来为交易者提供日内和日间波动性方面的深度见解。通过设置 80%、100%、130% 等关键波动率阈值,您可以快速识别潜在的盈利机会,或者在市场超出常规范围时及时得到预警。 FX Dynamic 可根据您经纪商的时区进行调整,帮助您保持一致的波动率衡量标准,并能与 MetaTrader 平台完美结合,实现实时分析。 1. 为什么 FX Dynamic 对交易者极具价值 实时 ATR 洞察 • 仅需一眼便可了解日间与日内波动水平。当价格触及或突破 80%、100%、130% 的 ATR 阈值时,会发出提示,让您知道市场是否达到临界水平。 • 在波动完全爆发前预判可能的衰竭或突破走势。 多市场通用 • 适用于外汇、商品、指数等多种资产。 FX Dynamic 可以自动识别经纪商时区,也可手动进行调整。 • 您可选择只专注于某一特定品种,或在多市场保持一致的 ATR 标准。 更智能的风险管理 • 利用 ATR 门槛来优化止损或止盈位置。当市场
IX Power MT5
Daniel Stein
4.83 (6)
IX Power:解锁指数、大宗商品、加密货币和外汇市场洞察 概述 IX Power 是一款多功能工具,可分析指数、大宗商品、加密货币和外汇市场的强弱表现。 FX Power 提供针对货币对的最高精度,利用所有可用货币对数据进行分析,而 IX Power 专注于基础资产的市场数据。这使得 IX Power 成为非外汇市场的理想选择,同时在需要简单外汇分析时也非常可靠。它可以无缝适用于任何图表,提供清晰的、有行动价值的洞察,帮助提升您的交易决策。 1. 为什么 IX Power 对交易者非常有价值 多市场强弱分析 • IX Power 分析指数、大宗商品、加密货币和外汇市场的强弱表现,为每个市场提供量身定制的洞察。 • 监控 US30、WTI、黄金、比特币等资产的表现,发现交易机会。 适用于更广泛的市场 • 对于外汇交易, FX Power 提供无与伦比的精度,通过分析所有相关货币对。 • IX Power 专注于基础资产的市场数据,非常适合非外汇市场及简化的外汇分析。 实时适应性 • 借助自适应算法, IX Power 实时响应市场数据变化,保持分析的最新性。 • 实时更新
Basic Harmonic Patterns Dashboard MT5
Mehran Sepah Mansoor
4.57 (7)
该仪表盘显示所选符号的最新可用谐波形态,因此您可以节省时间并提高效率 /  MT4 版本 。 免费指标:  Basic Harmonic Pattern 指标列 Symbol:   显示所选符号 Trend:     看涨或看跌 Pattern:    形态类型(Gartley、蝴蝶、蝙蝠、螃蟹、鲨鱼、Cypher 或 ABCD) Entry:     入口价格 SL: 止损价 TP1: 第一止盈价 TP2: 第二次获利价格 TP3: 第三次获利价格 Current price:    当前价格 Age (in bars):   最后绘制的模式的年龄 主要输入 Symbols :   从 "28 种主要货币对 "或 "选定符号 "中选择。 Selected Symbols :   希望监控的符号,用逗号分隔("EURUSD,GBPUSD,XAUUSD")。如果您的经纪商为货币对设置了后缀或前缀,您必须在以下两个参数中添加(货币对前缀或货币对后缀)。 Max Iteration:   调整模式的最大迭代次数(如果该值越小,则模式越少,性能越快;如果该值越大,则模式越多,性能越慢)
首先,值得强调的是,这个交易系统是一个非重绘、非重画和非滞后的指标,这使得它非常适合手动和机器人交易。 在线课程,手册和下载预设。 “智能趋势交易系统 MT5”是专为新手和经验丰富的交易者量身定制的综合交易解决方案。它结合了超过 10 个优质指标,具有 7 多个强大的交易策略,使其成为适用于各种市场条件的多功能选择。 趋势跟随策略:提供精确的入场和止损管理,以有效地跟随趋势。 反转策略:识别潜在的趋势反转,使交易者能够利用区域市场的机会。 剃头策略:专为快速准确的日内交易和短期交易而设计。 稳定性:所有指标都不会重绘、不会重画和不会滞后,确保可靠的信号。 定制:支持自定义策略,以满足个人交易偏好。超过 7 种策略和组合可帮助您找到最佳策略。 信号清晰度:提供箭头信号,以指示清晰的入场和退出点。 实时警报:通过交易进出警报使交易者保持了解。 深入分析:提供更高时间框架的趋势分析和实时交易监控。 自适应颜色编码:利用蜡烛颜色编码来显示成交量、趋势和反转蜡烛信号。通过蜡烛颜色分析市场方向。 “智能趋势交易系统 MT5”赋予交易者必要的工具,以便在各种市场条件下做出明智和战略性的交易决策。无论
支撑和阻力筛选器是 MetaTrader 的一个级别指标,它在一个指标内提供多种工具。 可用的工具有: 1. 市场结构筛选器。 2. 看涨回调区。 3. 看跌回调区。 4.每日枢轴点 5.每周枢轴点 6. 每月枢轴点 7. 基于谐波形态和成交量的强大支撑和阻力。 8. 银行级区域。 限时优惠:HV 支撑和阻力指示器仅售 50 美元且终生可用。 (原价 125$) 通过访问我们的 MQL5 博客,您可以找到我们所有带有分析示例的高级指标: 单击此处 主要特点 基于谐波和音量算法的强大支撑和阻力区域。 基于谐波和成交量算法的看涨和看跌回调区域。 市场结构筛选器 每日、每周和每月的枢轴点。 文档 所有支持和阻力筛选器文档(说明)和策略详细信息均可在我们 MQL5 博客的这篇文章中找到: 单击此处。 接触 如果您有任何问题或需要帮助,请通过私信联系我。 作者 SAYADI ACHREF,金融科技软件工程师,Finansya 创始人。
ATrend
Zaha Feiz
4.75 (12)
ATREND: 工作原理及使用方法 工作原理 “ATREND”指标针对MT5平台设计,旨在通过结合多种技术分析方法为交易者提供强有力的买卖信号。该指标主要利用平均真实波幅(ATR)来测量波动性,并结合趋势检测算法来识别潜在的市场动向。 购买后请留言,您将获得特别的赠品。 主要特点: - 动态趋势检测:该指标评估市场趋势并相应调整信号,帮助交易者与当前市场条件对齐策略。 - 波动性测量:通过使用ATR,该指标衡量市场波动性,这对于确定最佳止损(SL)和止盈(TP)水平至关重要。 - 信号可视化:该指标在图表上直观地表示买卖信号,增强交易者的决策能力。 操作步骤 输入和设置: - 时间框架:此输入允许您设置指标计算的主要时间框架,默认值为15分钟。 - 时间框架2:此输入可用于定义额外分析的辅助时间框架,默认值为1分钟。 - 移动:此参数允许您将指标的计算向回移动,默认值为0。 - SLATR:此输入定义用于根据ATR计算止损水平的乘数,默认值为2.56。 - TPATR:此输入定义用于根据ATR计算止盈水平的乘数,默认值也为2.56。 - AlertsOn:启用或禁用交易信号的警报,
RelicusRoad Pro MT5
Relicus LLC
5 (17)
现在$ 147(更新后增加到$ 499) - 无限帐户(PC或Mac) RelicusRoad 用户手册 + 培训视频 + 访问 Private Discord Group + VIP 身份 一种看待市场的新方式 RelicusRoad 是世界上最强大的外汇、期货、加密货币、股票和指数交易指标,为交易者提供保持盈利所需的所有信息和工具。我们提供技术分析和交易计划,帮助每一位交易者取得成功,从初学者到高级。它是一个关键的交易指标,可以提供足够的信息来预测未来的市场。我们相信一个完整的解决方案,而不是图表上几个没有意义的不同指标。这是一个多合一指标,显示无与伦比且非常准确的信号、箭头 + 价格行为信息。 RelicusRoad 基于强大的人工智能,提供缺失的信息和工具来教育您并使您成为交易专家,成为成功的交易者。 几乎所有技术指标都滞后,这意味着它们只能报告已经发生的事情。因此,他们只确认您过去可以看到的价格已经在哪里。我们相信领先指标可以预测未来价格,而无需重新绘制,也不要过度依赖可能改变并导致重新绘制的滞后指标。如果您根据滞后指标进行交易并建立头寸,您就知道您已经大部分时间
Black Dragon indicator mt5
Ramil Minniakhmetov
4.82 (57)
趋势检测指标将补充任何策略,也可用作独立工具。   好处 易于使用,不会因不必要的信息而使图表过载; 可用作任何策略的过滤器; 具有内置的动态支撑和阻力水平,可用于获利和设置止损; 指标在烛台关闭后不会改变颜色;  适用于股票市场、指数、石油、黄金和所有时间范围; 具有吐司通知、邮件通知、推送通知和声音提醒功能。 我的其他开发可以在这里找到: https://www.mql5.com/zh/users/mechanic/seller 输入参数 Alert - 开/关。警报; Push Notification - 开/关。推送通知; Mail - 开/关电子邮件通知; Fibo 1,2,3,4,5,6,7,11,21,31,41,51,61,71 - 动态支撑和阻力位的设置。
I just sell my products in mql5.com, any other websites are stolen old versions, So no any new updates or support. - Lifetime update free -   Real price is 80$   - 25% Discount ( It is 59$ now ) Contact me for instruction, any questions! Related Product:  Gold Trade Expert MT5 - Non-repaint Introduction The breakout and retest strategy is traded support and resistance levels. it involves price breaking through a previous level.  The break and retest strategy is designed to help traders do two
Blahtech Supply Demand MT5
Blahtech Limited
4.54 (13)
Was: $299  Now: $149  Supply Demand uses previous price action to identify potential imbalances between buyers and sellers. The key is to identify the better odds zones, not just the untouched ones. Blahtech Supply Demand indicator delivers functionality previously unavailable on any trading platform. This 4-in-1 indicator not only highlights the higher probability zones using a multi-criteria strength engine, but also combines it with multi-timeframe trend analysis, previously confirmed swings
Trend Forecaster
Alexey Minkov
5 (6)
!SPECIAL SALE!  The Trend Forecaster indicator utilizes a unique proprietary algorithm to determine entry points for a breakout trading strategy. The indicator identifies price clusters, analyzes price movement near levels, and provides a signal when the price breaks through a level. The Trend Forecaster indicator is suitable for all financial assets, including currencies (Forex), metals, stocks, indices, and cryptocurrencies. You can also adjust the indicator to work on any time frames, althoug
Atomic Analyst MT5
Issam Kassas
4.32 (19)
首先值得强调的是,该交易指标是非重绘、非延迟的指标,这使其成为手动和机器人交易的理想选择。 用户手册:设置、输入和策略。 Atomic Analyst是一种PA价格行动指标,利用价格的力量和动量来寻找市场上更好的机会。配备了高级过滤器,可帮助去除噪音和假信号,并提高交易潜力。使用多层复杂的指标,Atomic Analyst扫描图表,并将复杂的数学计算转化为任何初学者都能理解并用来做出一致交易决策的简单信号和颜色。 “Atomic Analyst”是专为新手和经验丰富的交易者量身定制的综合交易解决方案。它将高级指标和一流功能融合为一体的交易策略,使其成为所有类型交易者的多功能选择。 日内交易和剥头皮策略:专为快速准确的日内交易和短期交易而设计。 日内和摆动交易策略:可用作追求价格大幅波动的日内和摆动交易者的可靠工具。 多货币和市场:凭借其可靠的精度,在不同的工具和市场上运作。 多个时间框架:可在多个时间框架上使用,性能良好。 稳定性:所有指标均不重绘、不重绘和不滞后,确保可靠的信号。 信号清晰度:提供箭头信号,用于清晰的入场和出场点。 实时警报:通过交易入场、SL和TP警报通知交易者
Fxaccurate Trend Trading is a method that focuses on identifying and capitalizing on market trends in the foreign exchange (Forex) market. This strategy is grounded in the principle that once a trend is established, it tends to persist, allowing traders to enter positions that align with the market's prevailing direction. Fxaccurate Trend Trading relies on various tools, indicators, and methodologies to spot, confirm, and trade in the direction of a trend, whether it’s upward (bullish) or downwa
PZ Swing Trading MT5
PZ TRADING SLU
5 (5)
Swing Trading 是第一个旨在检测趋势方向的波动和可能的反转波动的指标。它使用在交易文献中广泛描述的基准摆动交易方法。该指标研究多个价格和时间向量,以追踪总体趋势方向,并检测市场超卖或超买并准备好进行修正的情况。 [ 安装指南 | 更新指南 | 故障排除 | 常见问题 | 所有产品 ] 市场波动的利润不会被窃取 指示器始终显示趋势方向 彩色价格带代表机会基准 彩色虚线表示可能的反转波动 该指标分析其自身的质量和性能 它实现了一个多时间仪表板 可定制的趋势和波动周期 它实现了电子邮件/声音/推送警报 指示器为非重涂或重涂 什么是摇摆交易 摇摆交易是一种尝试在一天到一周内从证券中获得收益的交易方式,尽管某些交易最终可以保持更长的寿命。摇摆交易者使用技术分析来买入弱点和卖出力量,并有耐心等待这些机会的发生,因为在发生一波抛售浪潮之后购买证券而不是陷入抛售更有意义。 机会基准 关于历史数据的大量研究证明,适合于波动交易的市场倾向于在基线价格带上下交易,基线价格带由图表显示,使用平均真实区间计算得出。波动交易者使用基线,该策略是购买常态和卖出躁狂,或做空常态并掩盖沮丧。在没有疲
Legacy of Gann for MT5
Pavel Zamoshnikov
5 (5)
The indicator very accurately determines the levels of the possible end of the trend and profit fixing. The method of determining levels is based on the ideas of W.D.Gann, using an algorithm developed by his follower Kirill Borovsky. Extremely high reliability of reaching levels (according to K. Borovsky  - 80-90%) Indispensable for any trading strategy – every trader needs to determine the exit point from the market! Precisely determines targets on any timeframes and any instruments (forex, met
Optimum Points MT5
Yuriy Lyachshenko
该指标在一个窗口中显示多个时间框架的趋势方向。如果多个时间框架的趋势一致,则会画出箭头。 您还可以切换到柱状图,显示当前时间框架的趋势。 该指标在图表上绘制入场点和近似出场点。 警告:由于该指标是多时间框架的,因此在策略测试器中使用时,应提前下载所有必要时间框架的报价。为了避免在测试器中长时间等待下载报价,您可以设置起始日期为 2025.01.01,并选择 “仅开盘价 ”或 “控制点 ”模式。 MT4的指标版本 指标特点     该指标不会重绘。历史图表上显示的内容将实时显示。     可用于交易任何资产:加密货币、股票、金属、指数、商品和货币。     适用于所有时间框架。     进场信号在新蜡烛图打开时出现,不会重新绘制。     退出交易的信号是暂时性的,因为通常情况下你可以用更多的利润完成交易。     左上方有一个详细的交易统计面板,可以将其最小化。     它使用特殊公式计算移动平均线,从而确定趋势方向。     为了不错过进入交易的信号,您可以在 “提醒 ”窗口或通过 “推送 ”接收通知。     适用于从初学者到专家的所有级别用户。 统计面板     记录信
Royal Scalping Indicator M5
Vahidreza Heidar Gholami
5 (6)
Royal Scalping Indicator is an advanced price adaptive indicator designed to generate high-quality trading signals. Built-in multi-timeframe and multi-currency capabilities make it even more powerful to have configurations based on different symbols and timeframes. This indicator is perfect for scalp trades as well as swing trades. Royal Scalping is not just an indicator, but a trading strategy itself. Features Price Adaptive Trend Detector Algorithm Multi-Timeframe and Multi-Currency Trend Low
Auto Order Block with break of structure based on ICT and Smart Money Concepts (SMC) Futures Break of Structure ( BoS )             Order block ( OB )            Higher time frame Order block / Point of Interest ( POI )    shown on current chart           Fair value Gap ( FVG ) / Imbalance   -  MTF      ( Multi Time Frame )    HH/LL/HL/LH  -  MTF      ( Multi Time Frame )  Choch  MTF      ( Multi Time Frame )  Volume Imbalance     ,  MTF          vIMB Gap’s Power of 3 Equal High / Low’s  
Easy Breakout MT5
Mohamed Hassan
5 (2)
Enjoy a   50% OFF   Christmas holiday sale!   After your purchase, feel free to contact me for more details on how to receive a bonus indicator called VFI, which pairs perfectly with Easy Breakout for enhanced confluence!     Easy Breakout MT5   is a powerful price action trading system built on one of the most popular and widely trusted strategies among traders: the   Breakout strategy ! This indicator delivers crystal-clear Buy and Sell signals based on breakouts from key support and resis
作者的更多信息
选择StopLoss和TakeProfit的水平会对交易的整体表现产生非常强烈的影响。除了交易交易的明显参数 - 可能获胜或可能亏损的大小 - 止损和止盈的水平也会影响交易的预期持续时间以及一般交易的盈利能力。 如果您已使用“ AIS-ODT ”脚本确定了最佳事务持续时间,则可以开始确定与StopLoss和TakeProfit级别关联的参数。 为此,我们按以下步骤操作。首先,我们将确定在一个方向或另一个方向上的所有可能的价格偏差,并计算在一定时间内实现它们的概率。之后,您可以根据其大小,概率和预期利润值计算StopLoss和TakeProfit的最佳水平。 为此,请在感兴趣的货币对的图表和所需的时间范围内运行脚本。使用属性窗口中的ILB参数,设置交易仓位的期望持续时间,以柱数表示。在实用程序的工作期间,分析整个历史记录的数据,并选择最佳值。在脚本结束时,形成了两个文件 - “Buy.csv”和“Sell.csv”,其中包含获得结果的表 - 图1。 在表格的第一列中,指示了可能的TakeProfit大小,在第二列中,指示了最佳的StopLoss大小。第三列显示以百分比表示获胜这些参数的概
FREE
该脚本基于使用随机数生成器模拟贸易交易。即使使用相同的输入参数,这也可以使您获得完全不同的结果。运行脚本时,将打开一个对话框,您可以在其中设置外部变量的所需值。 在块中,TradingOptions定义了模拟交易所需的基本参数。 StartBalance  - 设置交易余额的初始大小。 NumberTrade  - 设置脚本运行时将建模的交易事务数。为了获得或多或少的显着结果,该参数必须大于30。 ProbabilityWinning  - 获胜交易的概率。表示为百分比,有效值为1到99。 Min.StopLoss  - 表示以点为单位的最小StopLoss值,将在建模交易操作时使用。 Max.StopLoss  - 以磅为单位设置StopLoss的最大值。 PositiveWin。 - 该变量建立修正,借助于该修正在模拟交易中获得积极的期望。 脚本的工作是执行以下操作。首先,计算获胜交易的预期概率 -  PW。之后,随机设置StopLoss的值,该值将在此事务中使用。考虑到预期收益应为正数,计算TakeProfit规模。考虑到点值,TakeProfit和StopLoss水平将转换为
FREE
This script allows selecting the TakeProfit and StopLoss levels. It analyzes the history data, and then calculates the probability of reaching a given price level. How the script works Suppose you have a trading strategy and you want to select the TakeProfit and StopLoss levels. Run the script and set the parameter: Number of Bars - the average position holding time in bars. Once the script operation is complete, the AIS-PPL.csv file will be created in the Files folder in the terminal data cata
FREE
该脚本的设计使交易者可以确定交易交易的平均持续时间,在此期间可能的利润和损失的比率将是最佳的。 首先,让我们看一下确定贸易交易最佳持续时间的一般方法。我们介绍以下变量: R  - 交易的结果; T  - 交易开放的时间; W  - 上一笔交易结束与下一交易开盘之间的时间。 每个交易者都努力在最短的时间内获得最大的利润。这种愿望可以通过以下简单表达来描述: R/(T+W)→max 。 很明显,变量  T  和  W  取决于交易的总持续时间和交易数量。设  ATD  是交易的平均持续时间, N  是交易总数。然后,交易的平均持续时间应与其总数的平方根成比例增长,即: ATD~√N 。 但是,有一些有根据的问题出现 - 任何交易持续时间等同于其他交易持续时间,交易持续时间如何影响交易操作的结果?为了得到所提问题的答案,我们将对历史数据的价格行为进行一项小型研究。 我们继续如下。我们将历史数据划分为由一定数量的柱组成的系列,对应于交易的平均持续时间。在每个这样的系列中,我们计算最大价格变动,我们将引用更大的偏差  StopLoss ,并且更小 - 到 TakeProfit 。 之后,我们将计
FREE
选择StopLoss和TakeProfit的水平会对交易的整体表现产生非常强烈的影响。除了交易交易的明显参数 - 可能获胜或可能亏损的大小 - 止损和止盈的水平也会影响交易的预期持续时间以及一般交易的盈利能力。 如果您已使用“ AIS-ODT ”脚本确定了最佳事务持续时间,则可以开始确定与StopLoss和TakeProfit级别关联的参数。 为此,我们按以下步骤操作。首先,我们将确定在一个方向或另一个方向上的所有可能的价格偏差,并计算在一定时间内实现它们的概率。之后,您可以根据其大小,概率和预期利润值计算StopLoss和TakeProfit的最佳水平。 为此,请在感兴趣的货币对的图表和所需的时间范围内运行脚本。使用属性窗口中的ILB参数,设置交易仓位的期望持续时间,以柱数表示。在实用程序的工作期间,分析整个历史记录的数据,并选择最佳值。在脚本结束时,形成了两个文件 - “Buy.csv”和“Sell.csv”,其中包含获得结果的表 - 图1。 在表格的第一列中,指示了可能的TakeProfit大小,在第二列中,指示了最佳的StopLoss大小。第三列显示以百分比表示获胜这些参数的概
FREE
MinDeposit MT5
Aleksej Poljakov
3 (1)
The script analyzes the history of quotes and gives recommendations on the minimum deposit. The calculations take into account the variability of prices and the standard deviation. Margin requirements for the instrument are also taken into account. The result of the script is the minimum recommended deposit for trading the given currency pair.
FREE
MinDeposit
Aleksej Poljakov
5 (1)
The script analyzes the history of quotes and gives recommendations on the minimum deposit. The calculations take into account the variability of prices and the standard deviation. Margin requirements for the instrument are also taken into account. The result of the script is the minimum recommended deposit for trading the given currency pair.
FREE
The script allows selecting the required 'Filter level' value of the AIS-MTF indicator. Run the script on the required chart and selected timeframe. Once its operation is complete, the HPS.csv file will be created in the Files folder. Open the file. You will see three columns. The 'Filter lvl' column represents the value of the 'Filter level' for the AIS-MTF indicator. Am. dev. - degree and direction of the indicator's deviation from the price level (sorted in ascending order). Negative values i
FREE
The script allows selecting the required 'Filter level' value of the AIS-MTF MT5 indicator. Run the script on the required chart and selected timeframe. Once its operation is complete, the HPS.csv file will be created in the Files folder. Open the file. You will see three columns. The 'Filter lvl' column represents the value of the 'Filter level' for the AIS-MTF indicator. Am. dev. - degree and direction of the indicator's deviation from the price level (sorted in ascending order). Negative valu
FREE
This script allows selecting the TakeProfit and StopLoss levels. It analyzes the history data, and then calculates the probability of reaching a given price level. How the script works Suppose you have a trading strategy and you want to select the TakeProfit and StopLoss levels. Run the script and set the parameter: Number of Bars - the average position holding time in bars. Once the script operation is complete, the AIS-PPL.csv file will be created in the Files folder in the terminal data cata
FREE
AIS 正确平均线指标允许您设置市场趋势运动的开始。该指标的另一个重要品质是趋势结束的明确信号。指标不会重新绘制或重新计算。 显示值 h_AE - AE 通道的上限 l_AE - AE通道的下限 h_EC - 当前柱的高预测值 l_EC - 当前柱的低预测值 使用指标时的信号 主要信号是通道AE和EC的交点。 当 l_EC 线高于 h_AE 线时,可能会开始上升趋势。 在 h_EC 线低于 l_AE 线之后,可以预期下降趋势的开始。 在这种情况下,应注意 h_AE 和 l_AE 线之间的通道宽度。它们之间的差异越大,趋势就越强。您还应该注意 AE 通道实现的局部高点/低点。这时,价格变化的趋势变得最强。 可定制的指标参数 设置指标包括根据时间范围选择 LRH 参数。此参数的有效值范围为 1 到 350。 此参数越小,指标越敏感,错误信号的增加可能。另一方面,此参数不应设置得太高,因为指标会变得不那么敏感并会跳过信号。
AIS Weighted_Moving_Average 指标计算加权移动平均线,并允许您确定趋势市场运动的开始。 权重系数的计算考虑了每个柱的具体特征。这使您可以过滤掉随机的市场走势。 确认趋势开始的主要信号是指标线方向的变化和穿过指标线的价格。 WH(蓝线)是高价的加权平均值。 WL(红线)是最低价的加权平均值。 WS(绿线)是所有价格点的加权平均值。 选项 LH - 计算值的柱数。 要快速选择 LH,您首先需要检查是较高时间范围的倍数的值。 例如,指标设置为 M15。 然后我们检查以下LH的值 周期 M30/M15 = 2 期间 H1/M15 = 4 期间 H4/M15 = 16 周期 D1/M15 = 96 周期 W1/M15 = 480 它们之间的值也可能是有趣的。
AIS Advanced Grade Feasibility 指标旨在预测未来价格可能达到的水平。他的工作是分析最后三个柱形图并在此基础上进行预测。该指标可用于任何时间范围和任何货币对。在设置的帮助下,您可以达到预期的预测质量。 预测深度 - 以条形图设置所需的预测深度。建议在 18-31 内选择此参数。 你可以超越这些限制。但在这种情况下,预测水平的“固定”是可能的(对于小于 18 的值),或者水平宽度过大(对于大于 31 的值)。 置信水平 1、置信水平 2 和置信水平 3 - 预测置信水平。可在 1-99 范围内设置。置信度 1 应该大于置信度 2,置信度 3 应该是最小的。 这些水平中的每一个都显示价格将达到此值的概率百分比,该值由预测深度参数确定的柱线数量决定。 Color lvl high 和 Color lvl low - 允许您选择线条的颜色 Style lvl - 允许您选择与级别对应的线条样式 宽度 lvl - 设置与级别对应的线的宽度
The indicator is designed to measure the price volatility. This allows determining the moments for opening or closing trade positions more accurately. High intensity of the market indicates the instability of its movement, but allows for better results. And, conversely, low intensity of the market indicates the stability of its movement. Parameters Bars to process - the number of bars to measure the price movements. A low value of this parameter allows determining the moments of rapid price mov
This indicator uses the Fibonacci p-numbers to smooth a price series. This allows combining the advantages of the simple and exponential moving averages. The smoothing coefficients depend on the level of the p-number, which is set in the indicator parameters. The higher the level, the greater the influence of the simple moving average and the less significant the exponential moving average. Parameters Fibonacci Numbers Order - order of the Fibonacci p-number, specified by trader. Valid values a
The indicator is based on the analysis of interaction of two filters. The first filter is the popular Moving Average. It helps to identify linear price movements and to smooth minor price fluctuations. The second filter is the Sliding Median. It is a non-linear filter. It allows to filter out noise and single spikes in the price movement. A predictive filter implemented in this indicator is based on the difference between these filters. The indicator is trained during operation and is therefore
This indicator studies the price action as a combination of micro-trends. All micro-trends are analyzed and averaged. Price movement is filtered based on this averaging. IP_High and IP_Low (blue and red dashed lines) show the instantaneous price movement. They display the forecast only for the current price values, taking into account only the number of bars defined by the 'Filter level' parameter. SP_High and SP_Low (blue and red solid lines) smooth the price movements with respect to history.
This indicator implements the process of simple linear smoothing. One of the disadvantages of exponential smoothing is the rapid attenuation of the signal. This does not allow for a full-fledged monitoring of long-term tendency of a price series. Linear smoothing allows fine-tuning the signal filtering. The indicator is configured by selecting the parameters: LP - period of smoothing. The higher the value, the more long-term tendencies are displayed by the indicator. Valid values are from 0 to 2
该指标是基于中值和移动平均特性的组合的顺序混合滤波器。 使用中值允许滤除价格序列值中的异常异常值和随机脉冲。同时,中值滤波器不会对价格变动的趋势起作用,而是保持不变。 由于中值滤波器是非线性的,因此使用简单移动平均值进行平均来平滑其值。这种方法使我们不仅可以更准确地识别趋势,还可以更准确地识别价格变动中的周期性成分。此外,它还增加了指标对价格变化的敏感度,并减少了价格序列与指标读数之间的延迟。因此,指标可以相当准确地警告新趋势的开始,以及旧趋势的结束。 您可以使用 FL 参数调整滤波器的深度及其灵敏度。其允许值为0到63.同时, 2 * FL + 1 条用于计算指标值。因此,FL值越大,指标显示价格图表的趋势越强。
该指标是两个改进的Lanczos滤波器的组合。 第一个过滤器用于推断价格。根据过去的价值,他预测当前柱内可能的价格变动。也就是说,它表明如果过去的趋势保持不变,价格会是多少。 第二个过滤器,用于平滑和平均窗口内的价格,由过滤器的级别决定。由于选择了权重,此过滤器最积极地响应价格变动中存在的周期性组件。 可以使用EF和IF参数调整指标。通过选择 EF 和 IF 的值,您可以获得有关趋势价格变动开始的信号。 EF   - 指数滤波器的窗口大小。有效值为 EF = 0 ... 255 。并且在计算期间处理的条数是 2 * EF + 1 。该参数越大,价格序列的过去价值的影响越大。结果以实线绘制。 IF   - 调整平均窗口的大小。 IF = 0 ... 255 的值。要计算的条数是 2 * IF + 1 。 IF 值越大,使用此过滤器检测到价格变动的较长时段。结果以虚线显示在图表上。
该脚本的设计使交易者可以确定交易交易的平均持续时间,在此期间可能的利润和损失的比率将是最佳的。 首先,让我们看一下确定贸易交易最佳持续时间的一般方法。我们介绍以下变量: R - 交易的结果; T - 交易开放的时间; W - 上一笔交易结束与下一交易开盘之间的时间。 每个交易者都努力在最短的时间内获得最大的利润。这种愿望可以通过以下简单表达来描述: R/(T+W)→max 。 很明显,变量 T 和 W 取决于交易的总持续时间和交易数量。设 ATD 是交易的平均持续时间, N 是交易总数。然后,交易的平均持续时间应与其总数的平方根成比例增长,即: ATD~√N 。 但是,有一些有根据的问题出现 - 任何交易持续时间等同于其他交易持续时间,交易持续时间如何影响交易操作的结果?为了得到所提问题的答案,我们将对历史数据的价格行为进行一项小型研究。 我们继续如下。我们将历史数据划分为由一定数量的柱组成的系列,对应于交易的平均持续时间。在每个这样的系列中,我们计算最大价格变动,我们将引用更大的偏差 StopLoss ,并且更小 - 到 TakeProfit 。 之后,我们将计算整个历史中价格范围的
FREE
让我们看一下外汇市场价格变化的本质,而不是关注这些变化发生的原因。这种方法将使我们能够确定影响价格变动的主要因素。 例如,让我们看一下欧元兑美元货币对和H1时间框架的开盘价。对于这些价格,我们构建了Lameray图(图1)。 在该图中,可以看出价格变动基本上根据线性方程发生。要确定此等式的参数,可以使用最小二乘法。在这个特定的例子中,改变开盘价的等式采用以下形式: Open [i] = 0.99989 * Open [i + 1] +0.00013。 让我们来看看这个等式如何充分描述价格变动。为此,我们删除线性分量并分析残差(图2)。 从图中可以清楚地看出,这些残留物相当混乱,如果我们将它们视为噪声,我们可以得到一个相当简单的系统来预测下一个柱的开盘价,这是以该指标的形式实现的。
该指标更具信息量。他的工作基于这样的假设,即市场中的价格变动可以表示为特定颜色的噪声,这取决于价格值分布的参数。由此,可以从不同角度分析价格变化,并将价格变动视为特定颜色的噪声,可以获得有关市场当前状态的信息并对价格行为进行预测。 在分析指标读数时,会考虑指标线的位置 - 它们位于当前柱的开盘价的上方或下方以及距离它的距离。 白噪声(白噪声) - 这种方法的特点是价格(当前和史前)被认为功率相等,这与简单的移动平均值相结合。白噪声信号更有可能证实这一特征 - 它越偏离当前价格,市场中的趋势运动就越强烈。相反,如果白噪声线接近开盘价,那么这就是趋势结束或横向价格变动的证据。 闪烁噪声(闪烁噪声)概述了趋势的上边界或下边界(取决于线是否高于或低于价格)。此外,这种噪音线与货币对价格的交叉点可以作为新趋势开始的证据,甚至是短期趋势的开始。 布朗噪声在很多方面的行为类似于指数平滑。因此,噪声线跟随价格,只有市场突然和突然的变化才有可能出现大的偏差。 蓝噪声显示趋势对当前趋势的强烈程度。由于蓝色噪声线与当前价格存在较大偏差,我们可以说趋势已经耗尽其力量并接近完成。 紫色噪音表明周期性或周期性价
尽管“ AIS Color Noise Filter ”指示器存在一些缺点,但使用它来平滑价格序列和预测价格的想法看起来非常有吸引力。 这是由于以下几个原因: 首先,考虑到几个噪声成分,可以建立相互独立的因素预测,从而提高预测质量; 其次,价格序列的噪声特征在整个历史中表现得相当稳定,从而可以获得稳定的结果; 最后,噪声变化使我们希望预测系统非常敏感,并且它对价格变化的反应将非常快。 因此,我们得到一个指标,尽管有所有简化,但能够准确预测价格将会移动的渠道。该指标的主要优点是速度快,易于学习。主要缺点是指标无法选择最重要的预测因素。 LH 是一个参数,用于设置进行预测的历史数据的长度。其允许值为0  -  255,而指标处理的柱数超过此参数指定的单位数。
很多时候,在金融系列的研究中应用他们的平滑。使用平滑,您可以删除高频成分 - 据信它们是由随机因素引起的,因此无关紧要。平滑总是包括一些平均数据的方法,其中时间序列中的随机变化相互吸收。大多数情况下,为此目的,使用简单或加权移动平均方法,以及指数平滑。 这些方法中的每一种都有其优点和缺点。因此,简单的移动平均值简单直观,但其应用需要时间序列的周期和趋势分量的相对稳定性。另外,信号延迟是移动平均值的特征。指数平滑方法没有滞后效应。但即使在这里也存在缺陷 - 只有在将系列与随机异常值对齐时,指数平滑才有效。 简单和指数平均值之间的合理折衷是使用加权移动平均线。但是,存在选择特定重量值的问题。让我们一起尝试解决这个问题。 因此,首先要定义我们希望从平滑过程中实现的目标: •首先,我们需要从价格序列中删除随机变化和噪音; •其次,我们希望识别异常排放和异常价格行为,这些行为也可用于贸易; •最后,平均程序应确定市场中存在的可持续趋势。 当然,我们希望平滑程序适应当前的市场情况。 为了获得理想的结果,我们将根据此价格水平与研究期间的最高和最低价格之间的差异来计算权重。通过这种方法,我们得到一个
为了隔离长期和非随机组件,不仅要知道价格变化了多少,还要知道这些变化是如何发生的。换句话说 - 我们不仅对价格水平的价值感兴趣,而且对这些水平相互替代的顺序感兴趣。通过这种方法,人们可以找到影响(或可能影响)特定时间点价格变化的长期和稳定因素。了解这些因素可以让您做出或多或少准确的预测。 让我们确定我们希望从财务系列的分析中得到什么具体结果: •首先,我们需要强调这一趋势,如果它存在于市场中; •其次,我们需要确定周期性成分; •第三,结果应足够稳定,可用于预测; •最后,我们的分析方法应该适应当前的市场形势。 为了满足指定的条件,我们使用相对价格变化的回归分析,并基于该模型做出指标。该指标的算法基于对历史数据的学习,其工作在交易者的完全控制之下。 LH 是一个参数,用于确定用于平滑金融系列的柱数。其允许值介于0到255之间。 UTS 是影响学习速度和深度的参数。它的值也在0到255之间。如果UTS的值为零,则在整个历史记录中进行学习。在所有其他情况下,训练集会不时更新。更新越频繁,UTS值越小。 该指标的主要缺点是,当平滑金融系列被认为是静止时,这可能会导致一些延迟。
其中一种强大的分析方法是使用Levy流程对财务系列进行建模。这些过程的主要优点是它们可用于模拟大量现象 - 从最简单到最复杂。我只想说市场中分形价格变动的想法只是Levy过程的一个特例。另一方面,通过适当选择参数,任何Levy过程都可以表示为简单的移动平均值。图1显示了一个Levy过程的示例,其中片段放大了几次。 让我们考虑使用Levy流程来平滑价格图表的可能性。首先,您需要选择Levy过程的参数,以便它可以用于模拟线性过程。然后我们得到一个权重系统,其中包括不同符号的系数。有了这个,我们不仅可以平滑金融范围,还可以跟踪其中存在的反趋势和周期性成分。 通过选择参数 LF 来配置指示器的操作。它决定了故事的深度,并将对其进行分析。此参数的允许值位于0  -  255之间。用于计算的条形数将比此数字多两个。 蓝线表示高价平滑的结果,绿线表示收盘价,红线表示低价。 该指标的主要缺点是根据严格定义的算法执行抗锯齿,该算法没有考虑市场中的急剧和强烈变化。此外,与所有平滑指标一样,存在可以达到简单移动平均值的滞后。
AIS Channel Price
Aleksej Poljakov
通常,交易者面临着确定价格在不久的将来可能发生变化的程度的任务。为此,您可以使用Johnson分发类型SB。这种分布的主要优点是即使只有少量的累积数据也可以使用它。用于确定此分布参数的经验方法允许您准确地确定价格通道的最大和最小水平。 这些值可用于不同的情况。例如,它们可用于设置市场订单的止损和止盈水平,或挂单的入场点。此外,使用追踪止损时可以定向这些水平。此外,在历史足够大的情况下,指标可能预示着上升趋势或下降趋势的开始。嗯,或者说它的结束,如果这样的趋势是。 该指标的主要缺点是对价格排放的敏感度极高,以及对市场形势变化的反应较迟。 蓝色和红色线分别显示价格通道的最大值和最小值。绿线表示在给定市场情况下价格的均衡值。 使用 LB 参数配置指标。此参数确定将在计算中使用的柱数,其允许值在2-64之间。
此指标可让您确定价格达到一个或另一个级别的可能性。它的算法非常简单,并且基于对特定货币对的价格水平的统计数据的使用。由于收集的历史数据,可以确定价格在当前柱形期间的变化程度。 尽管简单,但该指标可以为交易提供宝贵的帮助。因此,在其帮助下,可以确定交易头寸的TakeProfit和StopLoss水平。它可以帮助确定挂单的价格和确定TrailingStop的价格水平。 此外,该指标可以纳入现有战略。例如,您使用某种日内策略。然后,通过在D1时间框架上设置此指标,您可以在克服已经不希望开启新交易头寸之后获得水平。 该指标的主要缺点是它完全依赖于历史数据,并且不会以任何方式对某些当前的市场变化作出反应。 通过选择输入参数-L1 ... L4来执行该指标的设置 - 每个输入参数确定从每个柱的开盘价达到价格价格的概率。每个参数的值必须在99 ... 0之内,并且以下每个参数必须严格小于前一个参数。 尼古拉·尼古拉耶维奇(Nikolai Nikolaevich)是创造这个指标的意识形态灵感,如果你喜欢这个指标,那就写下几句话,我会告诉他。
筛选:
无评论
回复评论