Congestion Breakout
- 指标
- CARLO FINANCIAL SOFTWARE TECHNOLOGY LLC
- 版本: 1.101
- 激活: 10
CONGESTION BREAKOUT INDICATOR:
When you see a sideways price movement in a meaningless market, what goes through your mind? Is it a danger, an opportunity or completely a vacuum? Let's see if we can avoid the latter and focus on using it to our advantage. The ability to read price action through the display of rectangles on the chart could be the boost you need to achieve your trading goals.
What is congestion?
Congestion is a market situation where the price is trading around a particular level without making progress in any direction. When there is a congestion, the market not only moves sideways, but also moves in a disorderly fashion, making price action erratic.
When does a congestion occur?
Congestion can occur before the announcement of an important piece of news, when traders are waiting for the news, or immediately after its release, when the market is trying to figure out what the impact will be.
It is also normal for congestion to occur during periods of indecision, such as at lunchtime. In this case, you may see the start of a sideways movement that ends when traders return to their desks to resume trading.
Market congestion often ends when the bulls or bears get the better of the others and the price moves out of the congestion zone, usually with high volume.
How to use congestion zones to trade?
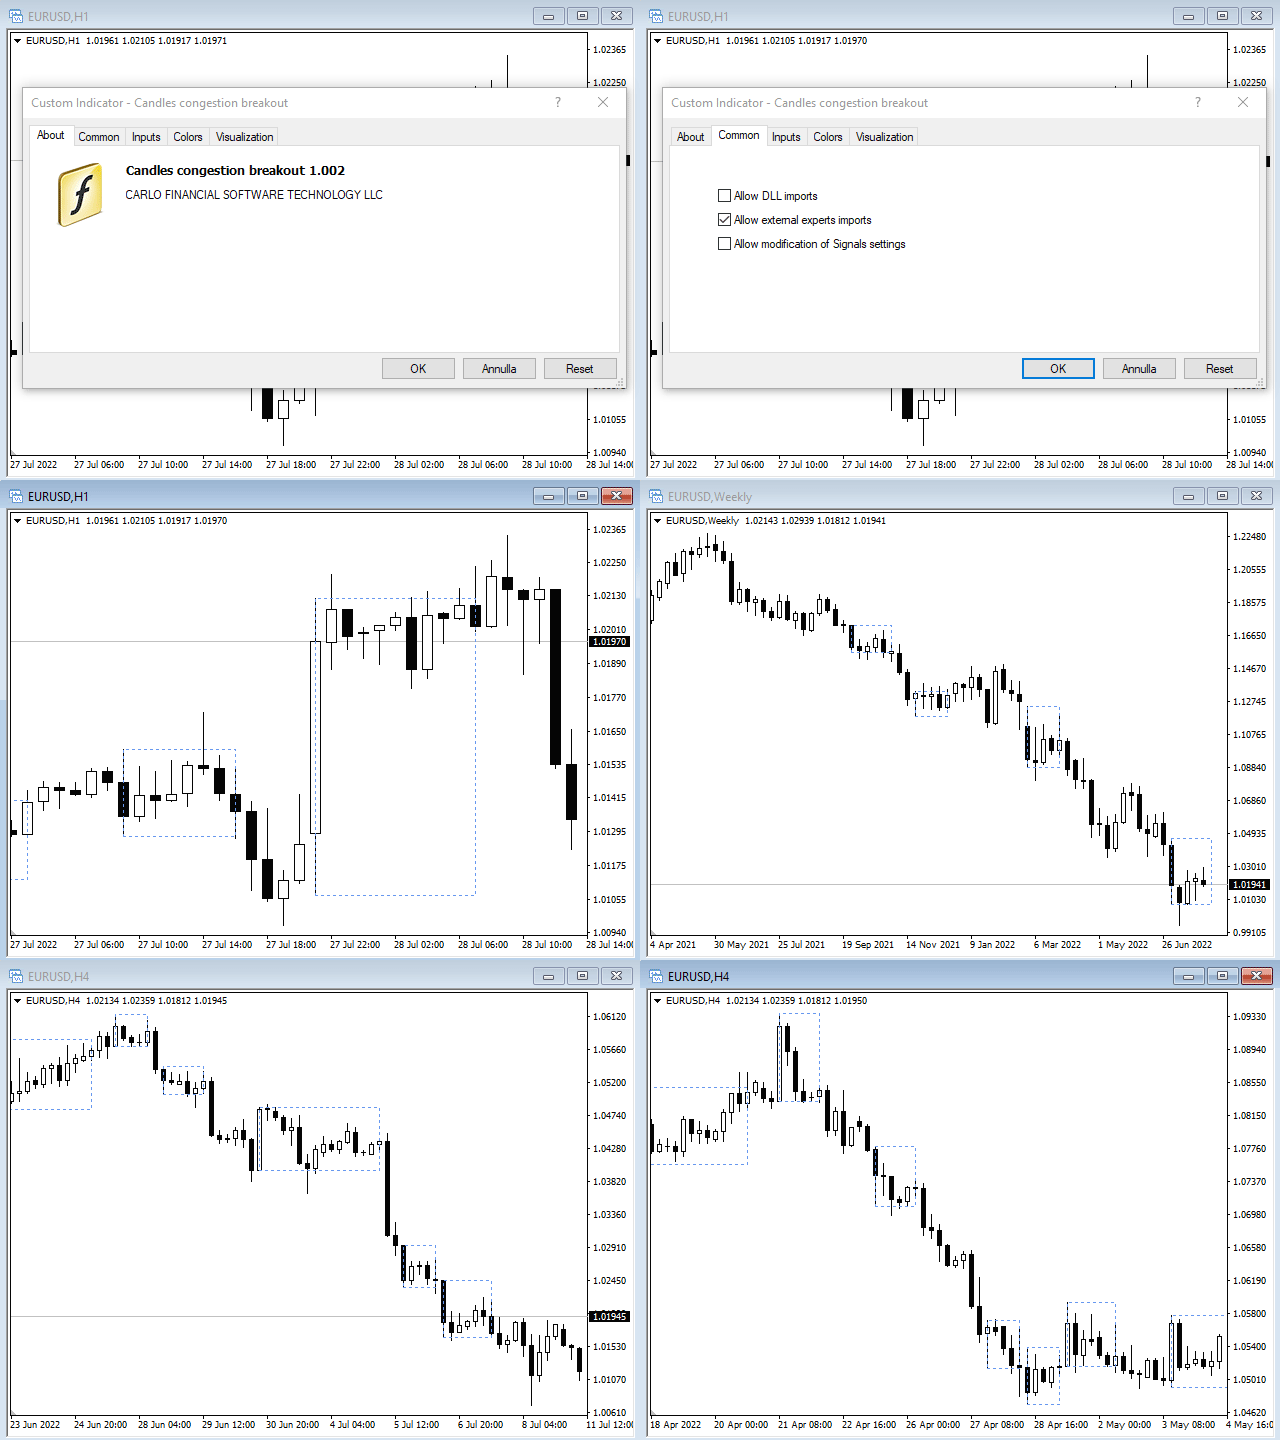
Congestion zones can be very useful for trading, which is where the Congestion Breakout Indicator comes in, a useful indicator that highlights these areas in all desired time frames.
· Congestion zones as support and resistance:
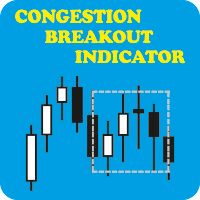
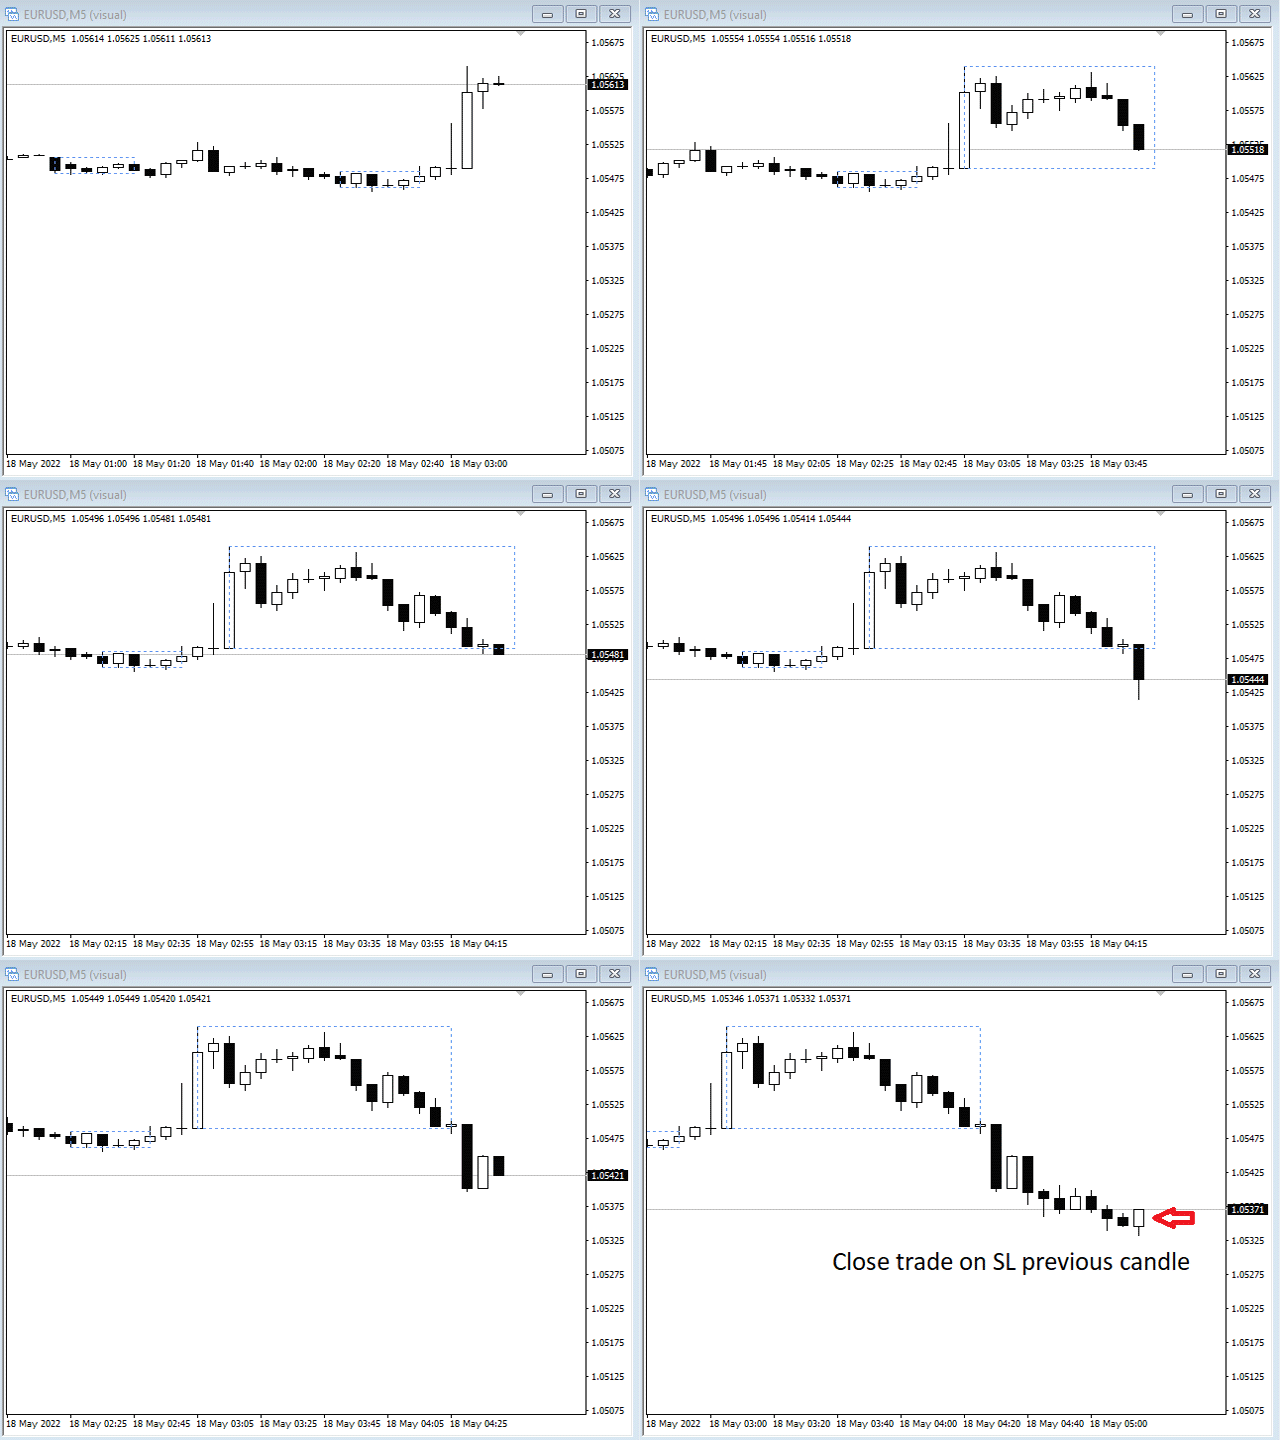
As a trader you should consider congestion zones as solid and highly reliable support and resistance zones; the indicator tracks the congestion area with a rectangle from the formation of the fourth bar to subsequent bars that have openings and closes, or only closes, within a previous larger candle (Measuring Bar).
· Congestion zones for trading exits:
Expect a price reaction in that zone whenever price reaches it and if, for example, you have managed to enter a trend early enough and secure a good profit, you can use price congestion signals to take some of your profits off the table.
· The congestion zone as a potential entry point:
Furthermore, spotting the congestion allows you to anticipate the eventual breakout, although it is important to know that multiple false breakouts can occur. So do not trade until a reliable breakout occurs with clear signs of trend continuation.
Why use the congestion breakout indicator in combination with the Candles Trading Panel?
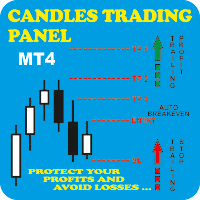
The combined use of this indicator and the Candles Trading Panel ( https://www.mql5.com/en/market/product/84104 ) allows you to minimise possible losses with a quick method to move the automatic Trailing Stop and Trailing Profit based on your analysis or with the ability to manually move the stop to breakeven if the trade does not immediately continue in the direction of the breakout within a specified time frame.
In addition, the congestion area display is a reference point for placing stop loss orders. Risk management is the key to successful trading and it is essential to enter a trade with stop loss orders already placed to protect your capital.
Instead, the efficient trailing profit method, within the Candles trading panel, will allow you to maximise your profits.
In any case, it is essential to have a trading plan and stick to it.
Key features:
· Ability to highlight congestions in two modes:
- open and close of successive bars within the bar
- close of successive bars within the measuring bar (only_close)
· Possibility to display nested congestions (flag_ congestion_in_congestion)
· Customisation of indicator colour (clr_congestion)
· Ability to receive Metaquotes ID alerts and messages when congestion breaks (send_MetaQuotes_ID_alert)
· Ability to customise the number of ticks before the breakout to receive alerts (ticks_to_congestion_break)






用户没有留下任何评级信息