SRL Edson Gould MT4
- 指标
- Grigorii Matsnev
- 版本: 1.0
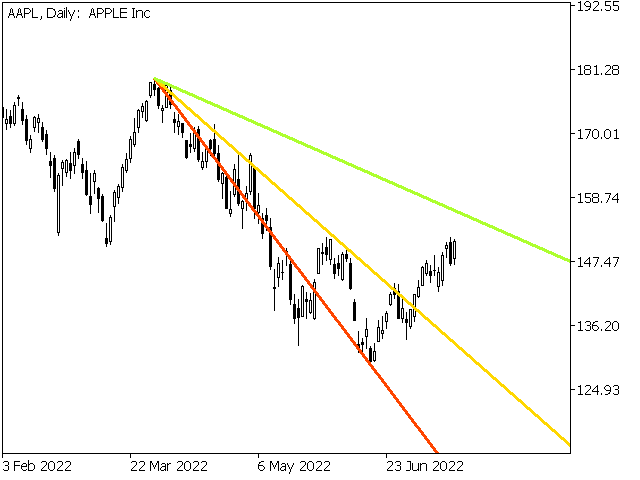
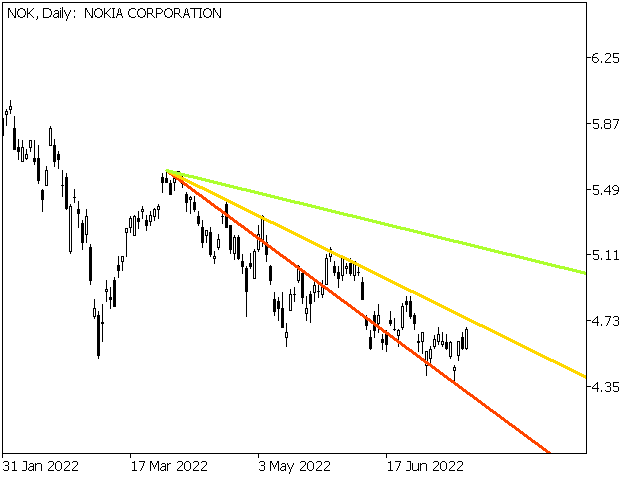
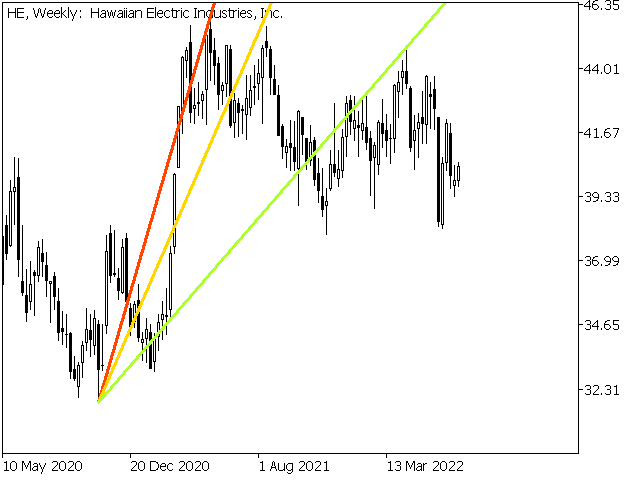
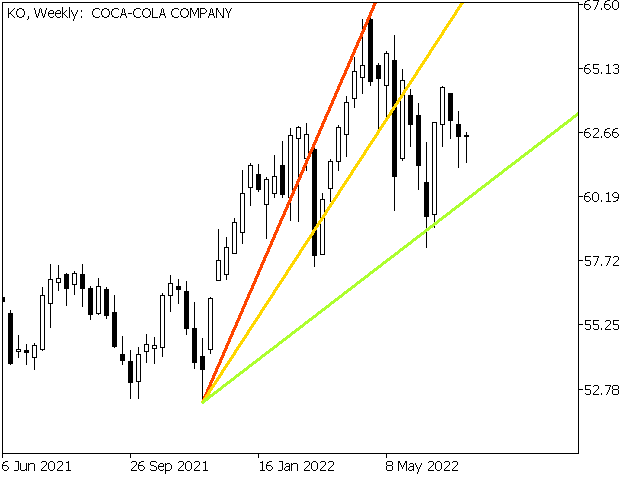
速度阻力线是确定趋势和阻力线的有力工具。 该指标使用图表极值和特殊的数学公式构建线条。 该指标可用于确定趋势方向和枢轴点。
<---------------------------->
指标参数:
"Depth of search" -搜索图表极值的深度(以条形为单位)
"Back step of search" -极值之间的最小距离(以条为单位)
"Deviation of price" -同一类型极端之间的允许价格差异
"Line color" -带有相应索引的线条颜色
"Line style" -带有相应索引的线条样式
"Line width"-具有相应索引的线宽
<---------------------------->
你可以在"艾德森*古尔德的稀有作品集"一书中找到更多信息,也可以在私人信息中与我联系。
<---------------------------->
提前感谢所有有兴趣的人,祝你好运征服市场!

Miglior indicatore al mondo,merita 100 stelle ed è gratuito